Author: Mike Vizard

  • Accurics Aligns DevSecOps Platform With GitLab

    Accurics Aligns DevSecOps Platform With GitLab

    Accurics today announced it has integrated its tool for discovering violations of security policies that occur when developers provision infrastructure as code with both the continuous integration and continuous delivery (CI/CD) platform and the static application security assessment testing (SAST) tools from GitLab.

    Om Moolchandani, chief information and security officer (CISO) and CTO for Accurics, said both integrations make it easier for developers to discover security issues earlier as part of a DevSecOps workflow using the company’s Terrascan tools.

    Many of the issues organizations are having with cloud security these days can be traced back to misconfigurations created by developers when configuring infrastructure using tools such as Terraform. Accurics created Terrascan to identify those misconfigurations.
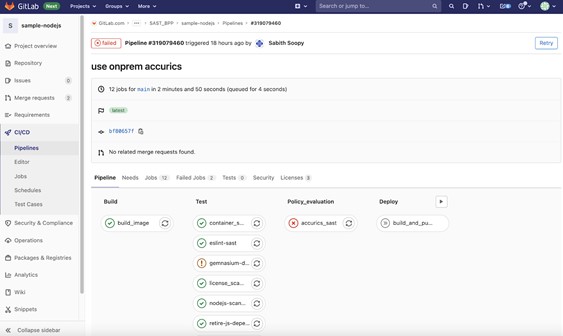
    The integration with GitLab makes it easier to incorporate Terrascan into a DevOps workflow in a way that also aggregates data collected from both SAST and dynamic application security testing (DAST) tools, said Moolchandani. That approach effectively unifies what today are two separate cloud infrastructure and application development pipelines by enabling DevOps teams to employ threat scores to enforce security policies as code that are deemed too risky to deploy with block builds, he added.

    At the same time, the integration with SAST and DAST tools provides the context developers need to prioritize remediation efforts before applications are deployed in a production environment, noted Moolchandani.

    Organizations of all sizes are now trying to strike a balance between two conflicting agendas. On the one hand, infrastructure-as-code (IaC) tools such as Terraform have played a critical role in enabling developers to build and deploy applications faster. The issue is that developers lack the security expertise required to ensure infrastructure is secured properly at a time when cybercriminals are more aggressively seeking to compromise software supply chains. Organizations most likely won’t slow down the rate at which applications are being deployed to make sure software supply chains are not compromised. However, in the absence of best DevSecOps practices—which still are not widely implemented—there may be a backlash against shifting application responsibility left toward developers.

    The challenge that creates is most organizations don’t have enough security expertise available to review applications in a timely manner before they are deployed, which results in them hoping security issues will be discovered and remediated during the application update cycle before cybercriminals find a way to exploit a vulnerability.

    Of course, hope does not make for an application security strategy. Organizations will need to find ways to enable developers to better secure applications while simultaneously making it easier for cybersecurity teams to maintain a zero-trust IT environment that reduces the chances organizations will be breached via, for example, a phishing attack to steal developer credentials.

    Regardless of how DevSecOps workflows and zero-trust IT architectures are implemented, it’s clear organizations have run out of time to resolve longstanding security issues that are now making the kinds of headlines no one wants to see.

  • Cortex Taps GitLab to Help DevOps Teams Manage Microservices

    Cortex Taps GitLab to Help DevOps Teams Manage Microservices

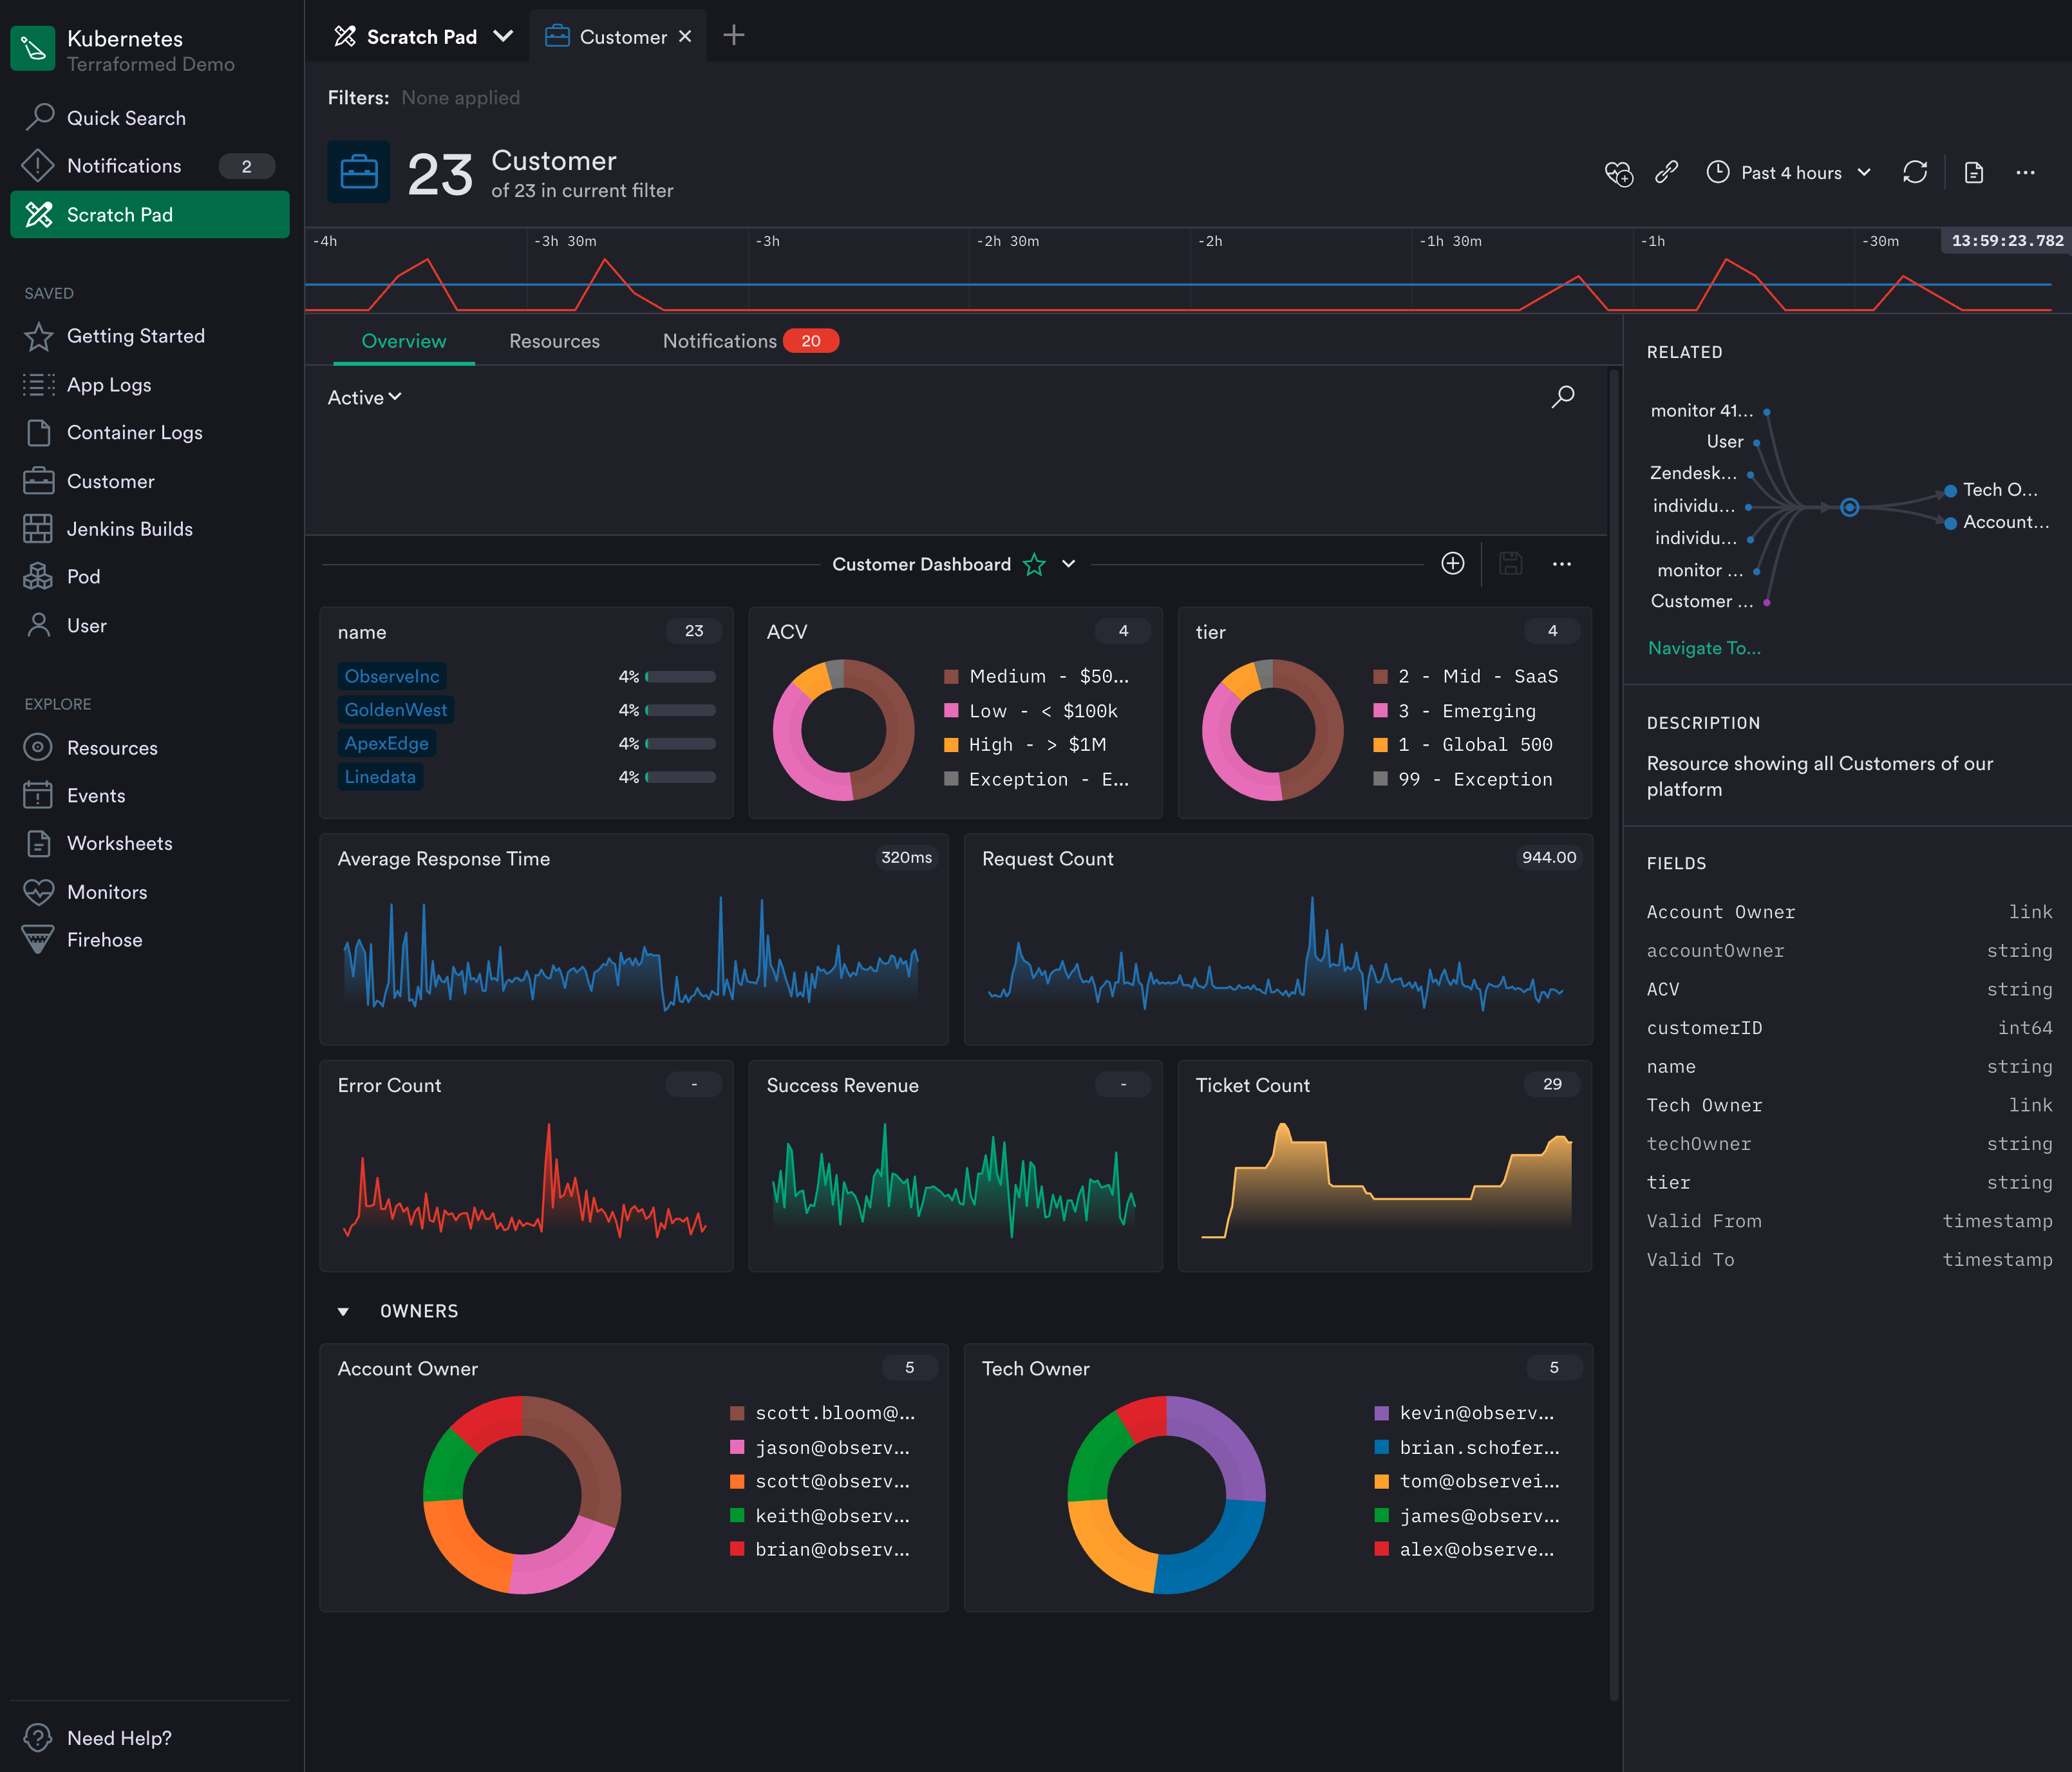
    Cortex, a provider of a platform for tracking ownership of microservices, this week announced its platform can now import services from the GitLab continuous integration/continuous delivery (CI/CD) platform.

    Anish Dhar, Cortex CEO, said the company’s platform is now integrated with more than 30 tools that are regularly employed by DevOps teams, including offerings from GitLab, Datadog, Sonarqube, Snyk and PagerDuty, as well as open source platforms such as the Kubernetes container orchestration engine and the Istio service mesh.

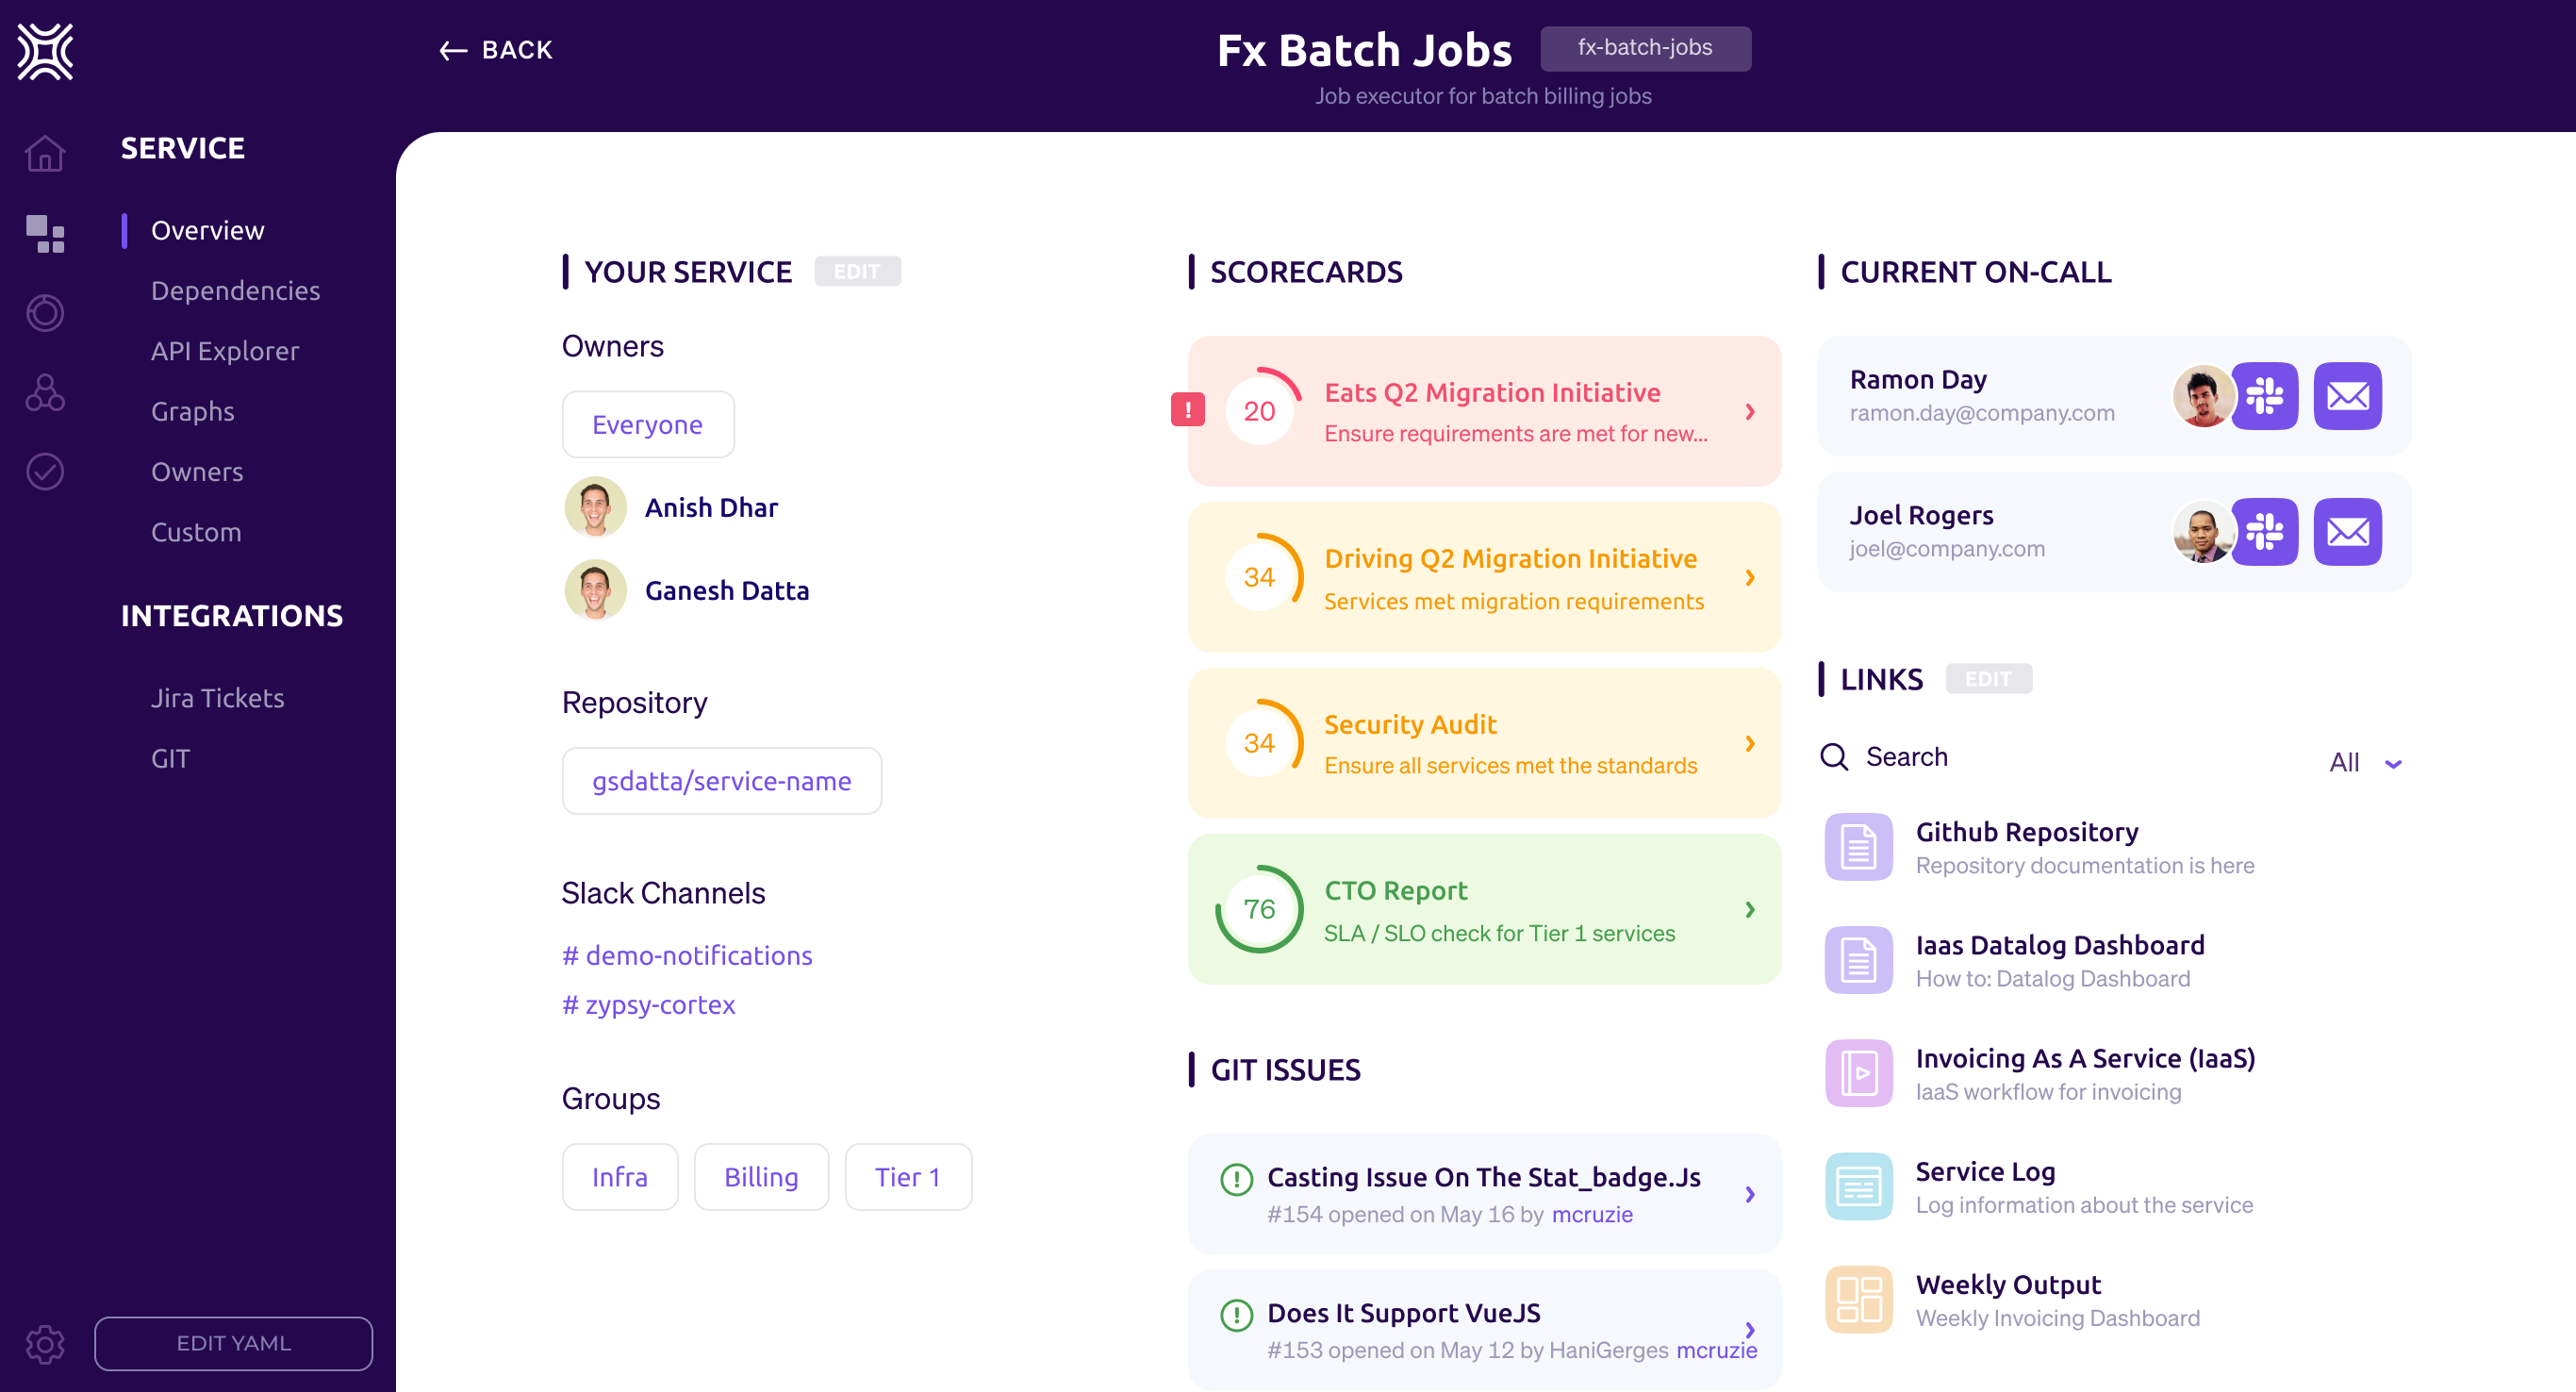
    Designed for site reliability engineers (SREs) and other DevOps professionals, the Cortex platform eliminates the need to rely on spreadsheets to manually track ownership of microservices. Instead, Cortex imports data residing within the tool employed by developers to surface who within an organization is responsible for maintaining which microservices.

    In addition, a Cortex dashboard enables DevOps teams to see which developers are on-call in the event of an unexpected incident, the latency rate microservices are experiencing and which vulnerabilities have yet to be remediated.

    Grades can also be assigned to specific microservices based on metrics that are associated with a specific microservice. That approach allows DevOps teams to apply gamification techniques using a scorecard to encourage developers to continuously improve their microservices, noted Dhar. That approach will also make it apparent to other developers which microservices running in a production environment can be most reliably employed, added Dhar.

    Cortex

    At the core of the platform is Cortex Query Language (CQL), a domain-specific language that allows DevOps teams to define granular rules that can be applied to, for example, on-call rotations, security vulnerabilities, package versions, service level objectives (SLOs) and the overall health of the microservice. Engineers can employ code in the form of YAML files to set reliability standards across teams and types of services through direct integrations with a variety of tools. In effect, Cortex provides a reliability-as-code platform, said Dhar.

    As responsibility for applications shifts further left, each development team is being held accountable for the life cycle of any microservice or application they create. The challenge enterprise DevOps teams are encountering is that when there are hundreds, even thousands, of microservices, it’s difficult to determine who on the development team is responsible for a specific microservice. Rather than trying to keep track of the relationship between development teams and microservices using a spreadsheet, Cortex is making a case for a tool that automates that discovery and tracking process.

    Most organizations today are embracing microservices to build and deploy more flexible applications at varying rates. However, it’s only a matter of time before they find themselves trying to navigate a web of interdependencies between microservices that can’t be managed using spreadsheets. DevOps teams, of course, might be inclined to use their skills to create their own tool for tracking microservices. However, given all the tasks at hand, maintaining a custom platform for discovering and tracking ownership of microservices is likely something better done by a vendor willing to maintain and support a purpose-built tool.

  • CloudBolt Adds Cloud Cost Tool to Hybrid Management Platform

    CloudBolt Adds Cloud Cost Tool to Hybrid Management Platform

    CloudBolt Software this week added cost management capabilities for Amazon Web Services (AWS) and Microsoft Azure public clouds along with codeless integrations with additional platforms to its hybrid cloud management platform.

    Grant Ho, chief marketing officer for CloudBolt, said the Spring Release of the company’s platform, now generally available, enables IT operations teams to rely much less on custom code to integrate the various elements of a hybrid cloud computing environment. The Spring edition adds support for the VMware vRealize Automation 8 automation platform, the configuration management database provided by ServiceNow as a cloud service and the IP address management platform from SolarWinds.

    CloudBolt

    In the wake of the COVID-19 pandemic, CloudBolt is betting more organizations will look to centralize IT management as part of an effort to reduce the total cost of IT. The cost management capabilities added to the platform enable IT teams to position themselves as more of an independent arbiter of where certain classes of workloads should run, based on cost, at a time when organizations have never had as many options as they do today, noted Ho.

    A recent survey published by CloudBolt found 80% of respondents are prioritizing real-time insight into cost optimization and security remediation. A total of 71% want self-service to be easy for end users, while 62% want an approach to integration that doesn’t require deep domain knowledge or special expertise.

    A full 94% of respondents also noted hybrid cloud computing will be critical to digital transformation. A total of 92% also noted that empowering end users through self-service IT is a digital transformation accelerator, while 99% said successful automation depends on streamlining integrations.

    More than three quarters (78%) noted they lack the visibility necessary to optimize cloud deployments. More than half (56%) also admitted their self-service offerings fail to meet user needs and more than three-quarters (76%) still rely on some form of custom coding when it comes to integration.

    Most enterprise IT organizations are trying to strike a balance between cost and flexibility as IT environments become more distributed. Each time a new platform is added to an IT environment, the total cost of IT rises because additional consoles for managing those platforms need to be staffed. The challenge is finding a way to centralize the management of IT in a way that reduces the number of consoles that have to be mastered without requiring every business unit to standardize on a platform that locks an organization into a single provider.

    It’s unclear to what degree IT organizations will rely on traditional IT service management (ITSM) platforms manned by administrators versus DevOps platforms deployed by site reliability engineers (SREs) to achieve that goal. However, one way or another, the cost of distributed computing environments needs to be reduced, even as they are becoming more complex. The primary issue now is deciding how best to achieve that goal in an IT environment where every application owner tends to view themselves as master of their own IT domain.

  • Lightbend Launches Serverless Managed DevOps Service

    Lightbend Launches Serverless Managed DevOps Service

    Lightbend today unfurled a cloud service based on a serverless framework that provides developers with a managed DevOps platform to build applications that dynamically scale resources up and down as required.

    Brad Murdoch, executive vice president for strategy at Lightbend, said Akka Serverless provides access to its Java development platform environment that runs atop Kubernetes via a declarative application programming interface (API) based on the gRPC protocol. Support for additional open APIs, such as GraphQL, is planned, added Murdoch.

    At the same time, Lightbend revealed today that Jonas Bonér has assumed the role of CEO in place of Mark Brewer. Previously CTO and founder of the Akka Project, Bonér is a co-author of a reactive manifesto that defines the core principles required to build applications using a reactive programming model.

    Akka Serverless, available via an open beta program that provides access to limited amounts of storage, is scheduled to be generally available in the fourth quarter on the Google Cloud Platform (GCP), with support for additional cloud services planned.

    The service is made possible because Lightbend extended an existing open source Cloudstate serverless framework to create a platform-as-a-service (PaaS) environment to support large amounts of distributed stateful data that developers employ to build applications, noted Murdoch. That capability overcomes the performance limitations of existing function-as-a-service approaches, based on other serverless computing frameworks, that don’t support stateful application development, added Murdoch.

    In fact, one of the reasons that adoption of serverless frameworks has been limited thus far is the inability to be employed within the context of a stateful application that requires a lot of access to data, said Murdoch.

    Lightbend addressed that issue by enabling event sourced entities persist each change in state as an event that Akka Serverless writes to a journal. That journal can be used to replay events to reconstruct state at a particular time, debug or provide an audit. At runtime, a key distinguishes each entity instance from all others.

    Akka Serverless is the latest in a series of managed DevOps services that automatically scales as developers request new resources. There is no need for developers to configure and manage a database on which to build their application. Many organizations are migrating to these services because they would rather focus their time and effort on building applications versus managing a DevOps platform, said Murdoch.

    It’s not clear to what degree organizations will embrace managed DevOps services, which are starting to appear on various cloud platforms. However, the implication is that by choosing these types of services, organizations may not need to hire, for example, as many site reliability engineers (SREs). The challenge, however, going forward is that most of the managed DevOps platforms are currently tied to a specific cloud service at a time when most organizations are routinely using more than one cloud.

    Of course, developers will need to continue to manage continuous integration (CI) processes, but, in time, the continuous delivery side of the DevOps equation may be incorporated within a managed service. Regardless of the path forward, as DevOps processes continue to become more automated, the pace at which applications can be deployed is about to significantly accelerate.

  • Observe Seeks to Put More IT Metrics in Context

    Observe Seeks to Put More IT Metrics in Context

    Observe, Inc. announced today it has updated it observability platform to add support for metrics based on time series data. In addition, the company is revamping how the platform generates alerts as part of an effort to surface more actionable intelligence.

    Jeremy Burton, Observe CEO, said rival observability platforms require IT teams to sift through hundreds of metrics that are generated using elaborate tagging schemes that ultimately drive up the cost of storage. The Observe platform curates metrics by associating them with, for example, a customer, to provide more relevant context, Burton noted.

    That approach eliminates the need to present IT teams with overwhelming lists of metrics in addition to reducing storage costs by removing the need for a complex tagging scheme, added Burton.

    The latest update leverages that approach to metrics to only generate alerts based on curated metrics attached to customers, pods, shopping carts or containers. Rather than simply being alerted to a drop in response times, for example, the IT team can also easily see which customers or pods might be affected. That shift will reduce the volume of alerts that are already overflowing in email inboxes and across other communications platforms.

    Fresh from raising an additional $7 million, Observe today also revealed it has added 20 paying customers since launching the platform on top of the Snowflake cloud service residing on the Amazon Web Services (AWS) public cloud. Rather than reinventing the same core infrastructure, Observe is leveraging a data analytics engine that is already widely employed in IT environments.

    For now, Observe will continue to primarily focus on metrics as part of an effort to deliver insights in a form IT operations teams are prepared to consume today, said Burton. Over time, however, Observe will add support for distributed traces via tools such as OpenTelemetry and Jaeger as it adds additional application performance management (APM) capabilities, added Burton. Rather than telling IT operations teams they are managing IT in the wrong way, the goal is to meet IT operations teams where they are today, noted Burton.

    That strategy also enables the Observe platform to be employed to manage both monolithic and microservices-based applications running on Kubernetes clusters, noted Burton. The immediate goal is to provide IT teams with an alternative to legacy monitoring tools that provide more context at total lower cost by allowing IT organizations to rationalize tools that don’t tend to be especially well integrated, added Burton.

    In the longer term, Observe will also employ machine learning algorithms to collect data more efficiently. However, Burton said the company remains skeptical of visions of an IT future that depend on machine learning algorithms to continuously learn IT environments that are not only unique, but subject to frequent changes.

    Competition among observability platform providers is already fierce. Each IT team will need to decide what type of platform makes the most sense for them based on costs and their preference for specific capabilities one vendor might have that another doesn’t provide. One way or another, however, the way IT environments are managed will soon be changing for the better.

  • Grafana Labs Advances Open Source Visualization and Observability

    Grafana Labs Advances Open Source Visualization and Observability

    During the online GrafanaCONline conference today, Grafana Labs announced that version 8.0 of its open source visualization software widely employed by DevOps teams is now generally available. In addition, version 1.0 of Grafana Tempo, an open source back end platform for collecting distributed traces that are needed to drive observability across an application environment, is also generally available.

    At the same time, Grafana Labs revealed that Grafana Tempo is now available as a service on Grafana Cloud.

    Version 8.0 of Grafana adds support for additional types of visualizations such as streaming panels, state timeline, status history, bar chart and histograms in addition to a revamped unified alerting system that enables DevOps teams to view and edit alerts generated by Grafana and open source Prometheus monitoring platform via a common user interface. The notification system adopted to achieve that goal is based on a Prometheus alert manager that provides capabilities such as grouping, deduping and silencing of notifications alongside advanced message templates.

    The latest release of Grafana also improves startup and graph rendering performance, thanks to a major reduction in initial download size and graph rendering time.

    The enterprise edition of Grafana has also been updated to provide support for fine-grained access controls, improves caching of back end data sources and improved reporting capabilities such as live dashboard links that can be embedded in email.

    Overall, Grafana Labs claims there are now more than 750,000 active installations of Grafana that organizations are employing to create visualizations that correlate data collected from multiple back end sources.

    In addition to contributing to Grafana and Grafana Tempo, the company is running a cloud service that makes multiple instances of Prometheus running on different clusters accessible from a central console.

    Torkel Ödegaard, creator of the Grafana project and chief Grafana officer for Grafana Labs, said Grafana Tempo promises to further advance observability thanks mainly to its ability to employ object storage to capture complete distributed traces. Rather than only sampling traces, it’s now feasible to trace every request. Grafana Tempo is also compatible with any open source tracing protocol, such as Jaeger, Zipkin and OpenTelemetry, and can be integrated with metrics, logs and dashboards via a managed Grafana Cloud service.

    It’s not quite clear how quickly organizations are embracing distributed traces to improve application observability or, for that matter, to what degree traces might eliminate the need for certain types of metrics or log analytics. The one thing that is certain is DevOps teams require more context than ever to proactively manage complex IT environments. Distributed traces make it simpler to track interactions between application services. The challenge is they can require IT teams to store a lot more data.

    In time, of course, distributed tracing will become more commonly employed as developers more routinely instrument applications based on microservices that tend to have lots of dependencies that are difficult to discover in the absence of some type of distributed tracing capability. Of course, distributed tracing has been around, in some form or another, in application performance management (APM) platforms for some time. The difference now is that, as open source software, it’s becoming more affordable to implement.

  • HashiCorp Increases Terraform’s Enterprise Appeal

    HashiCorp Increases Terraform’s Enterprise Appeal

    During the online HashiConf Europe conference today, HashiCorp debuted the general availability of a 1.0 release of HashiCorp Terraform along with updates to HashiCorp Terraform Cloud service.

    Meghan Liese, senior director of product marketing for HashiCorp, said in both cases HashiCorp is moving to enable organizations to better secure and govern IT infrastructure-as-code provisioned using open source Terraform tools.

    Version 1.0 of HashiCorp Terraform provides access to a stable application programming interface (API) that will foster interoperability and simplify future upgrades.

    The Terraform Cloud service, which eliminates the need for IT teams to set up and manage a Terraform platform, adds workflows enhancements to the Terraform Cloud that include the ability to publish curated modules to a private registry, enhancements that make it easier to visualize elements of a workspace and a preview of an ability to check with third-party tools related to a Terraform run.

    Overall, the goal is to make it simpler for organizations to compose, collaborate and reuse infrastructure-as-code using modules and the public and private registry options, said Liese. The public registry already has more than 5,000 modules. Terraform Cloud now offers a native workflow to publish modules from the public registry directly into an organization’s private registry.

    Terraform, of course, has been widely employed since it first debuted in 2014. There have been 15 major updates prior to the release of Terraform 1.0, which is intended to provide a foundation that ensures backward compatibility between releases going forward.

    In some instances, Terraform can be too much of good thing. It has considerably accelerated the rate at which IT infrastructure can be provisioned within the context of a DevOps workflow. The challenge, though, is developers often lack the security expertise required to prevent infrastructure from being misconfigured at a time when cybercriminals have become more adept at scanning for those vulnerabilities. To enable IT teams to prevent those misconfigurations, HashiCorp makes available both an enterprise edition of Terraform as well as its Terraform Cloud service. Terraform Enterprise is used by more than 1,200 enterprises, while Terraform Cloud has more than 120,000 users that execute more than 30,000 runs per day.

    It’s not clear if security concerns might one day lead to a backlash against the concept of shifting more responsibility left toward developers to improve productivity. In some cases, developers are simply deploying more insecure applications faster. HashiCorp is making a case for Terraform platforms that allow centralized IT teams to exercise more control over how infrastructure is provisioned as code. The need for that approach is becoming more pronounced, as organizations not only employ Terraform to provision cloud infrastructure but also on-premises IT environments.

    Regardless of how infrastructure is provisioned by developers, security of infrastructure, both inside and outside of the cloud, remains a priority as more workloads than ever are deployed. In effect, the attack surface that needs to be defended has dramatically expanded. Of course, the best security issue of all is the one that never happened because infrastructure is being provisioned right the first time and every time thereafter.

  • GitLab Acquires UnReview to Further AI Ambitions

    GitLab Acquires UnReview to Further AI Ambitions

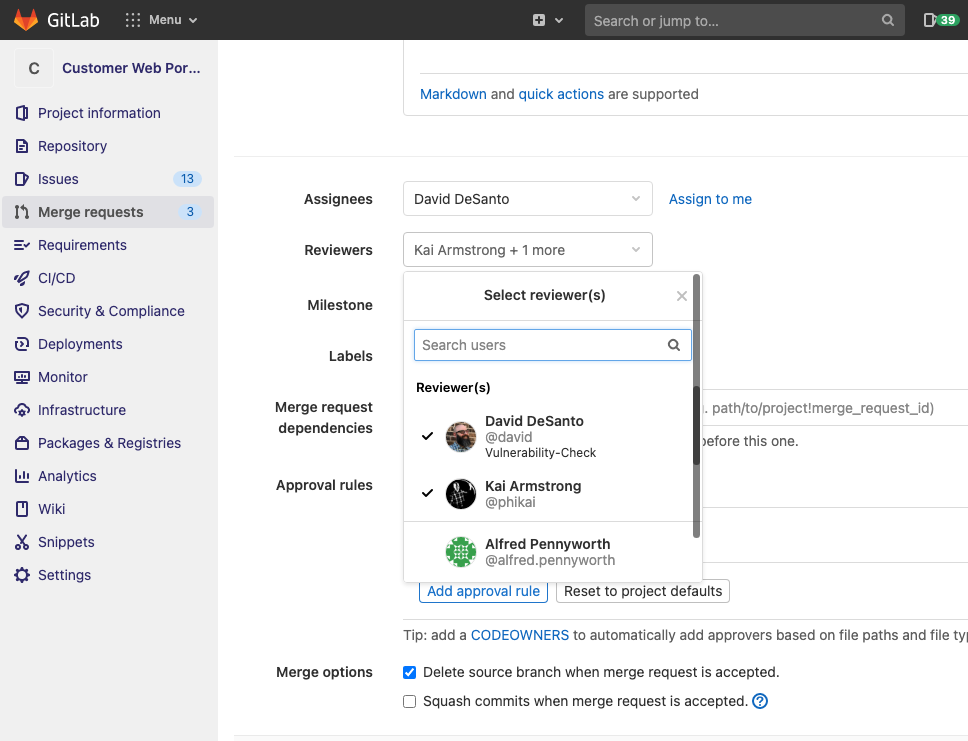
    GitLab announced this week it has acquired UnReview, a provider of a tool that employs machine learning algorithms to identify which expert code reviewers to assign to a project based on both the quality of their previous efforts and current workloads.

    David DeSanto, senior director for product management at GitLab, said the acquisition of UnReview is the latest step in an AI strategy that, in addition to optimizing DevOps processes, will eventually unify machine learning operations (MLOps) and DevOps workflows.

    Accessed via the Dev section of the GitLab platform, UnReview will also be employed to manage the overall code review process.

    GitLab

    DeSanto said GitLab is committed to employing AI technologies to automate workflows and compressing cycle times across all stages of the DevSecOps life cycle. The goal is to not eliminate the need for DevOps teams, but rather eliminate low-level tasks that conspire to hamper productivity while at the same time improving application security, noted DeSanto.

    Providers of DevOps platforms are now locked into an AI arms race on two separate fronts. Each of them clearly sees the opportunity to leverage machine learning algorithms and other forms of AI to automate a wide range of processes. At the same time, it’s apparent providers of MLOps platforms are borrowing heavily from DevOps best practices to manage the development of AI models. However, from the perspective of a DevOps team, an AI model is just another type of software artifact. Rather than deploying two distinct platforms, the goal should be to bring the data scientists that build AI models into the larger DevOps community, said DeSanto.

    The current challenge, of course, is the pace at which DevOps and data science teams work. It may take six months or more for a data science team to construct and validate an AI model that needs to be embedded within an application. Aligning the timetable for an AI model with the application development life cycle is difficult to accomplish if neither team has any meaningful visibility into each other’s workflows. As the rate at which AI models can be developed steadily improves, that alignment issue will only become all the more pressing.

    Going forward, it’s hard to envision any application that won’t have some sort of AI model embedded within it. The issue is that, just like any other software artifact, an AI model needs to be updated. As new data sources become available, an AI model is likely to drift beyond the parameters intended. A rapid change in business conditions may also require the replacement of an entire AI model. The same processes that DevOps teams apply to update any software artifact can also be applied to an AI model.

    It’s unclear how long it will take before some type of convergence of DevOps and MLOps inevitably occurs, as organizations look for more efficient ways to manage what will become thousands of AI models. The one certain thing is the longer it takes to make the effort, the more difficult it will become to overcome the organizational inertia that has been allowed to set in.

  • Cribl Automates Observability Efforts

    Cribl Automates Observability Efforts

    Cribl today announced it has updated the Cribl LogStream observability tool in addition to generally making available a software-as-a-service (SaaS) offering dubbed LogStream Cloud.

    Nick Heudecker, senior director for market strategy and competitive intelligence at Cribl, said Cribl LogStream provides the means to aggregate log data collected from multiple platforms and applications in a format any observability or monitoring tool can access.

    The challenge with observability platforms today is they leave it up to IT organization to copy and paste data into the platform. LogStream automates that process via a log router that collects and optimizes data streams from existing installed agent software and then shapes and routes that data on to analytics platform.

    Version 3.0 adds LogStream Packs, a framework for accelerating deployments of the log router. Alternatively, DevOps teams can employ LogStream Cloud to build and share LogStream configuration models.

    Heudecker said the goal is to reduce the cost of achieving observability by reducing the time and effort required to set up and manage data pipelines. No customization effort on the part of a DevOps team is required to collect and send data from hundreds of sources to any number of destinations, noted Heudecker.

    While observability is a core DevOps tenet, achieving it has been a major challenge. In addition to deploying and managing agent software to instrument IT environments, there’s a significant amount of time and data engineering effort needed to set up the pipelines employed to transfer data to a platform where it can be analyzed. Cribl is making a case for automating those data engineering tasks using a tier of software that abstracts data into a format that can be consumed by multiple observability and monitoring platforms.

    It’s not clear yet to what degree IT organizations perceive observability to be an evolution of monitoring, or simply the next logical evolution of monitoring. One way or another, IT teams need a lot more context than they have historically been able to attain using legacy monitoring tools. Each platform employed within an enterprise typically comes with its own monitoring tools that are used by the IT teams tasked with managing it. Whenever there is an issue, however, IT teams will spend hours correlating data from multiple tools to ascertain the root cause of a problem.

    Observability platforms promise to reduce that time and effort by applying analytics to data collected from multiple platforms. The challenge now is finding a way to efficiently collect all that data.

    It may be a while before IT organizations start to abandon all the monitoring tools they have in place in favor of observability platforms. However, as IT environments continue to become more complex (thanks, in part, to the rise of cloud-native computing platform based on microservices) the need for those platforms becomes more acute. The issue is enabling DevOps teams to achieve that goal without having to wait for an overworked data engineer to find the time to build a pipeline.

  • Atlassian Delivers on Forge App Dev Platform Promise

    Atlassian Delivers on Forge App Dev Platform Promise

    Atlassian this week made available a Forge platform for building applications that complements its existing portfolio.

    Mike Tria, head of platform engineering for Atlassian, said Forge is intended to provide an application development environment to both IT organizations and third-party partners. It provides developers with access to an integrated Atlassian DevOps toolchain to accelerate testing, deployment, debugging and to capture log data, added Tria. Forge also presents developers with a command line interface through which they can be onboarded to the Atlassian cloud where Forge runs to access documentation and application samples. It uses OAuth 2.0 to ensure applications deployed on the Atlassian cloud only access data they have permission to access.

    The overall goal is to provide developers with a more modern application development environment as an alternative to the application development platform the company previously made available.

    Once an application is built, developers can then publish their applications on the Atlassian Marketplace as free or commercial offerings. There are already more than 3,500 Forge apps that were created during a beta process that began late last year. Forge will soon be extended to the rest of the Atlassian portfolio, noted Tria.

    Forge is intended to complement an Open DevOps initiative launched earlier this month that tightens integration between the Jira project tracking and management tools provided by Atlassian and a wide range of other tools commonly employed by DevOps teams. The goal is to not only make it easier to correlate issues that are listed in Jira with artifacts found in various software platforms, but also to collect data from DevOps tools to automatically update Jira.

    That data will then be employed to inform key performance indicators (KPIs), based on graphs that Atlassian provides within Jira, to keep track of value streams. Rather than having to acquire a separate value stream management (VSM) platform to track software development progress, the insights needed to understand the impact of, for example, a delay to one project becomes a dividend of using Jira.

    Like most providers of software-as-a-service (SaaS) applications, Atlassian has been making available a platform for building applications on top of the same platform it employs to build its own applications. Atlassian claims there are more than 1,200 partners building applications in addition to internal IT that teams that have built custom extensions to its applications. Atlassian has already shown a proclivity for acquiring independent software vendors (ISVs) that build applications on its platform. As part of the overall Forge initiative, Tria said Atlassian will be working more closely to identify the white space that won’t be addressed by the Atlassian product roadmap at some future date.

    In the meantime, independent software vendors and internal IT teams will need to determine to what degree they will prefer to stand up their own application development environment versus opting to be dependent on Atlassian. In theory at least, applications built on Forge should be more tightly integrated with the rest of the Atlassian portfolio. The only potential downside is, of course, any potential conflict that might emerge with a provider of an application development platform that also happens to sell application software.