Category: Application Performance Management/Monitoring

  • Best of 2021 – Best Practices for Application Performance Testing

    As we close out 2021, we at staging-devopsy.kinsta.cloud wanted to highlight the most popular articles of the year. Following is the eighteenth in our series of the Best of 2021.

    When done properly, software application performance testing determines if a system meets certain acceptable criteria for both responsiveness and robustness. Before you jump in to testing, though, there are some best practices to remember.

    Start by defining test plans that include load testing, stress testing, endurance testing, availability testing, configuration testing and isolation testing. Align these plans with precise metrics in terms of goals, acceptable measurements, thresholds and a plan to overcome performance issues for the best results. Make sure you can triage performance issues in your testing environment; you should analyze issues impacting application performance by examining system functionality under load, not just the indicators of poor performance on the load testing tool side. Leveraging application performance management (APM) tools, which simulate production environments, provide much deeper insights into application functionality, as well as into overall performance under stress or load.

    10 Performance Testing Best Practices

    1. Test Early and Often

    Performance testing is often an afterthought, performed in haste late in the development cycle, or only in response to user complaints. Instead, you should be proactive. Take an agile approach that uses iterative testing throughout the entire development life cycle. Specifically, provide the ability to run performance “unit” testing as part of the development process – and then repeat the same tests on a larger scale in later stages of application readiness. Use performance testing tools as part of an automated pass/fail pipeline, where code that passes moves through the pipeline and code that fails is returned to a developer.

    2. Consider Users, Not Just Servers

    Performance tests often focus solely on the performance of servers and clusters running software. Don’t forget that people use software, and performance tests also should measure the human element. For instance, measuring the performance of clustered servers may return satisfactory results, but users on a single, troubled server may experience an unsatisfactory result. Tests should take user experience into account, and user interface timing should also be captured along with server metrics.

    3. Understand Performance Test Definitions

    It’s crucial to have a common definition for the types of performance tests that should be executed against your applications, such as:

    • Single User Tests. Testing with one active user yields the best possible performance, and response times can be used for baseline measurements.
    • Load Tests. Understand the behavior of the system under average load, including the expected number of concurrent users performing a specific number of transactions within an average hour.
    • Peak Load Tests. Understand system behavior under the heaviest anticipated usage for concurrent number of users and transaction rates.
    • Endurance (Soak) Tests. Determine the longevity of components, and whether the system can sustain average to peak load over a predefined duration. Monitor memory utilization to detect potential leaks.
    • Stress Tests. Understand the upper limits of capacity within the system by purposely pushing it to its breaking point.
    • High Availability Tests. Validate how the system behaves during a failure condition while under load. There are many operational use cases that should be included, such as seamless failover of network equipment or rolling server restarts.

    5. Build a Complete Performance Model

    Measuring your application’s performance includes understanding your system’s capacity. This includes planning what the steady state will be in terms of concurrent users, simultaneous requests, average user sessions and server utilization during peak periods of the day. Additionally, you should define performance goals, such as maximum response times, system scalability, user satisfaction scores, acceptable performance metrics and maximum capacity for all of these metrics.

    6. Define Baselines for Important System Functions

    In most cases, QA systems performance don’t match production systems performance. Having baseline performance measurements for each system can give you reasonable goals for each testing environment. These baselines provide an important starting point for response time goals, especially if there are no previous metrics, without having to guess or base them on the performance of other applications.

    7. Perform Modular and System Performance Tests

    Modern applications are incorporate many individual, complex systems, including databases, application servers, web services, legacy systems and so on. All of these systems need to be performance tested individually and together. This helps expose weaknesses, highlight interdependencies and understand which systems you should isolate for further performance tuning.

    8. Measure Averages, but Include Outliers

    When testing performance, you need to know average response time, but this measurement can be misleading by itself. Be sure to include other metrics, such as 90th percentile or standard deviation, to get a better view of system performance.

    KPIs can be measured by looking at average and standard deviations. For example, set a performance goal for the average response time plus one standard deviation beyond it (see Figure 1). In many systems, this improved measurement affects the pass/fail criteria of the test, matching the actual user experience more accurately. Transactions with a high standard deviation can be tuned to reduce system response time variability and improve overall user experience.

    application

    9. Consistently Report and Analyze the Results

    Performance test design and execution are important, but test reports are, too. Reports communicate the results of your application’s behavior to everyone in your organization, especially project owners and developers. Analyzing and reporting results consistently also helps to determine future updates and fixes. Remember to consider your audience and tailor reports to each audience. Reports for developers should differ from reports sent to project owners, managers, corporate executives and even customers, if applicable.

    10. Triage Performance Issues

    Providing the results of performance tests is fine, but those results, especially when they demonstrate failure, are not enough. The next step should be to triage the code/application and system performance, and involve all parties: developers, testers and operations personnel involved. Application Monitoring Tools can provide clarity regarding the effectiveness of triage.

    Additionally, remember to avoid throwing your software “over the wall” to a separate testing organization, and ensure your QA platforms match production as closely as possible. As with any profession, your efforts are only as good as the tools you use. Be sure to include a mix of manual and automated testing across all systems.

     

  • Best of 2021 – Torvalds’ Bug Warning is a Lesson for Linux Users 

    Best of 2021 – Torvalds’ Bug Warning is a Lesson for Linux Users 

    As we close out 2021, we at staging-devopsy.kinsta.cloud wanted to highlight the most popular articles of the year. Following is the third in our series of the Best of 2021.

    Linux does, occasionally, raise security concerns. While many users see it as the most secure, robust and versatile operating system available — that’s this writer’s opinion, as well — security precautions still have to be taken.

    A recent, widely publicized case illustrated this point; Linux creator himself, Linus Torvalds, warned against the use of the Linux 5.12 release. He described a “nasty bug,” and wrote that the situation is a “mess,” due to the use of swap files when adding Linux updates. This nasty bug, in fact, had the potential to destroy entire root directories.

    Some of the main takeaways following this “mess” include: tread very carefully when installing early Linux releases, especially those that involve swapping files instead of partitions, and especially, despite Linux’s well-known security advantages, avoid becoming complacent, because Linux security is not always foolproof.

    Hence, while the “state of Linux security today is quite good, and has evolved in a positive way with more visibility and security features built, like many operating systems, you must install, configure and manage it with security in mind; that is how cybercriminals take advantage, [via] the human touch,” said Joseph Carson, chief security scientist and advisory CISO at Thycotic, a provider of privileged access management (PAM) solutions.

    A Patch for Nastiness

    As Torvalds noted a few weeks ago, “most people don’t use a swap file, but a separate swap partition and the bug in question really only happens when you have a regular file system, and put a file on as a swap.”

    “The bad news is that the reason we support swap files in the first place is that they do end up having some flexibility advantages, and so some people do use them for that reason. If so, do not use [release candidate] RC1,” Torvalds wrote. “Thus, the renaming of the tag.”

    After issuing the warning, Torvalds released a patch that he says prevents the bug from destroying swap file systems. However, it may have already been too late for early adopters of release 5.12. Ubuntu, a leading Linux distro, can swap files by default.

    “It is nasty bug if you are still using swap files,” Carson said. “If you do still use swap files, then you could be impacted, resulting in potential data loss or a corrupted system.”

    DevOps teams – or anyone else running Linux and installing patches, whether on multi-servers or on individual workstations – still need, of course, to follow strict best practices. “Like any operating system, security depends entirely on how you use, configure or manage the operating system,” Carson said. “Each new Linux update tries to improve security; however, to get the value, you must enable and configure it correctly.”

    Linux Goodness

    The fact that Torvalds was so forthcoming about the bug, as well as the level of transparency that the Linux kernel offers, also demonstrates one of the many reasons Linux remains popular. Given that the Linux kernel, in one variety or another, is used “not only in about 50% of the internet servers of the world, but also in a substantial part of all our smartphones, it is good to see this level of transparency at ‘root level,” said Dirk Schrader, global vice president, security research at New Net Technologies (NNT), which providers cybersecurity and compliance software.

    “The security of Linux is based on its transparency; the ability to review the code of a distribution,” says Schrader. “Quite often forgotten is that transparency also involves talking about the mistakes, the errors, those nasty bugs.”

    Citing National Institute of Standards and Technology (NIST) vulnerability database statistics, Schrader described how, compared to the Windows family of desktop and server operating systems, for example, the Linux kernel shows better results for overall vulnerabilities. The number of vulnerabilities have also declined over the past four years, while Microsoft’s operating systems do not display the same trend, according to NIST’s national vulnerability database.

    Since Linux’s famous kernel is open source and transparent, it is possible to extrapolate that there are a greater number of potential vulnerability watchdogs compared to those monitoring vulnerabilities in closed systems. Some may argue that Microsoft has been, at times, less successful at detecting vulnerabilities and issuing much-needed patches.

    However, Linux users still must remain vigilant.

    “Still, for any of the Linux distributions, anyone using the early release candidates — RC1 in particular — should make sure that their own development or build process is undergoing change control, so that no mishaps will transfer the nasty bug into a production environment,”  said Schrader.

  • How Log4j Becomes a Serious DevOps Problem

    How Log4j Becomes a Serious DevOps Problem

    The recent discovery of the Apache Log4j vulnerability has wide-ranging implications for anyone who develops software, especially for those in the DevOps realm. What’s most troubling about the vulnerability (CVE-2021-44228) is how prevalent the use of Log4j is. The vulnerability is reported in a vast array of applications and directly impacts numerous Apache projects, including Druid, Dubbo, Flink, Flume, Hadoop, Kafka, Solr, Spark and Struts. There are also numerous Cisco programs impacted by the vulnerability. The list of impacted applications and libraries seems to be almost infinite, extending to Elastic LogStash, GrayLog2, Neo4J, Steam, Twitter and even the VMware Tanzu family of programs. 

    Simply put, any application that uses Log4J for logging and tracing is subject to the identified family of attacks known as Log4Shell. Those attacks prove easy to exploit and can be used to take control of vulnerable servers.

    Why DevOps Practitioners Should be Concerned

    The world of DevOps is all about reiteration, where features and improvements to applications are slipstreamed into production environments. To accelerate development, the QA process is usually limited to the most recent changes.

    In other words, developers, via their pipelines, can often establish a baseline of quality and then speed up their CI/CD pipelines by testing only what has changed since the last iteration of the application. This process ensures an acceptable level of quality without introducing what are perceived to be unnecessary steps.

    However, those processes do not take into account newly discovered flaws in older APIs and libraries, meaning that those flaws could telegraph into deployed applications and leave DevOps teams completely unaware of the impact and possible disruption. Detecting flaws after an application is deployed is like putting the cart in front of the horse.

    Further complicating the situation is that many developers lack a well-defined and well-maintained software bill of materials (SBOM), which means developers may be unaware of the components and/or libraries being used in a deployed application.

    Without an SBOM, it becomes increasingly difficult to remediate an issue with an application—especially if developers are unaware of the issue to begin with.

    Where Should Responsibility Lie?

    More often than not, vulnerabilities introduced into applications become a game of finger-pointing, where developers blame library suppliers or infosec staffers, and infosec blames developers for not performing due diligence on the components they are selecting to incorporate into their applications.

    Of course, finger-pointing only adds to the angst and delays the process of remediation and does nothing to determine where the responsibility for detecting and remediating vulnerabilities lies. DevOps teams need to put these squabbles aside and establish a process that deals with unintentionally introduced vulnerabilities. What’s more, DevOps teams need to invest in DevSecOps to make sure that vulnerabilities are detected and remediated as quickly as possible.

    To avoid the potentially massive disruption that a vulnerability like Log4Shell can cause, those running DevOps should consider:

    • Creating and maintaining an SBOM 
    • Deploying automated tools that scan for discovered vulnerabilities
    • Automatically comparing the SBOM against vulnerabilities
    • Including DevSecOps processes within their CI/CD pipelines
    • Frequently testing applications for flaws
    • Coordinating with cybersecurity personnel when a flaw is discovered
    • Patching frequently

    With more and more vulnerabilities discovered on an almost daily basis, DevOps teams must be ever vigilant about what components are incorporated into their applications. What’s more, with the increased use of low-code/no-code tools and integrated development environments (IDEs), DevOps will also need to consider if those tools use other libraries that can become compromised.


  • Speedscale Makes Free API Observability Tool Available

    Speedscale Makes Free API Observability Tool Available

    Speedscale today announced it is making a free edition of its observability tool for application programming interfaces (APIs) available to developers.

    Ken Ahrens, Speedscale CEO, said the goal is to expose more developers to the company’s API testing tool that can be accessed on their local machine via a command line interface (CLI). Dubbed Speedscale CLI, it is designed to enable individual developers to inspect, detect and map API calls on local applications or containers rather than having to subscribe to the company’s current API testing platform via a software-as-a-service (SaaS) model.

    That approach should reduce the number of disruptions DevOps teams are likely to encounter after an application is deployed in a production environment, noted Ahrens.

    Speedscale CLI features include service mapping, which enables developers to auto-detect and map external dependencies that could break, a traffic viewer for logging and tracing API calls and latency detection tools that show how code changes are impacting performance. In a forthcoming update, Speedscale also plans to include load generation capability to enable developers to run tests locally. The overall goal is to enable IT organizations to shift more responsibility for the management of APIs further left toward the developers that create them, said Ahrens.

    Naturally, Speedscale is also hoping that, as more developers are exposed to its observability platform for APIs, there will be increased demand for its SaaS platform among DevOps teams that need to manage and maintain APIs in production environments within their existing workflows. Speedscale exposes a set of APIs of its own to enable that integration, noted Ahrens.

    At its core, the Speedscale SaaS platform is designed to enable DevOps teams to replay how calls are made between APIs and external mock services to make it easier to diagnose issues.

    In general, there’s a lot more focus these days on APIs, thanks to digital business transformation initiatives that are dependent on APIs to integrate processes. The challenge organizations face is many of those APIs are built by separate development teams. In some instances, organizations can find themselves deploying redundant APIs. Other organizations will create APIs that, over time, are simply forgotten about or that go dormant when the developers that created them leave the organization. These “zombie APIs” often represent a security risk because cybercriminals now routinely scan IT environments for unattended APIs through which they can exfiltrate data without anyone noticing.

    One way or another, the management of APIs is becoming a distinct discipline within many organizations as they come to appreciate the level of IT flexibility they enable. Replacing backend services is a lot simpler when the APIs calls that invoke them both internally and externally remain relatively simple. The challenge is that building and maintaining microservices-based applications based on APIs is a more complex endeavor than building a monolithic application. The first step toward reducing that complexity is, of course, to provide more visibility into the application environment for all concerned.

  • Stacklet Embeds Collaboration in Compliance-as-Code Platform

    Stacklet Embeds Collaboration in Compliance-as-Code Platform

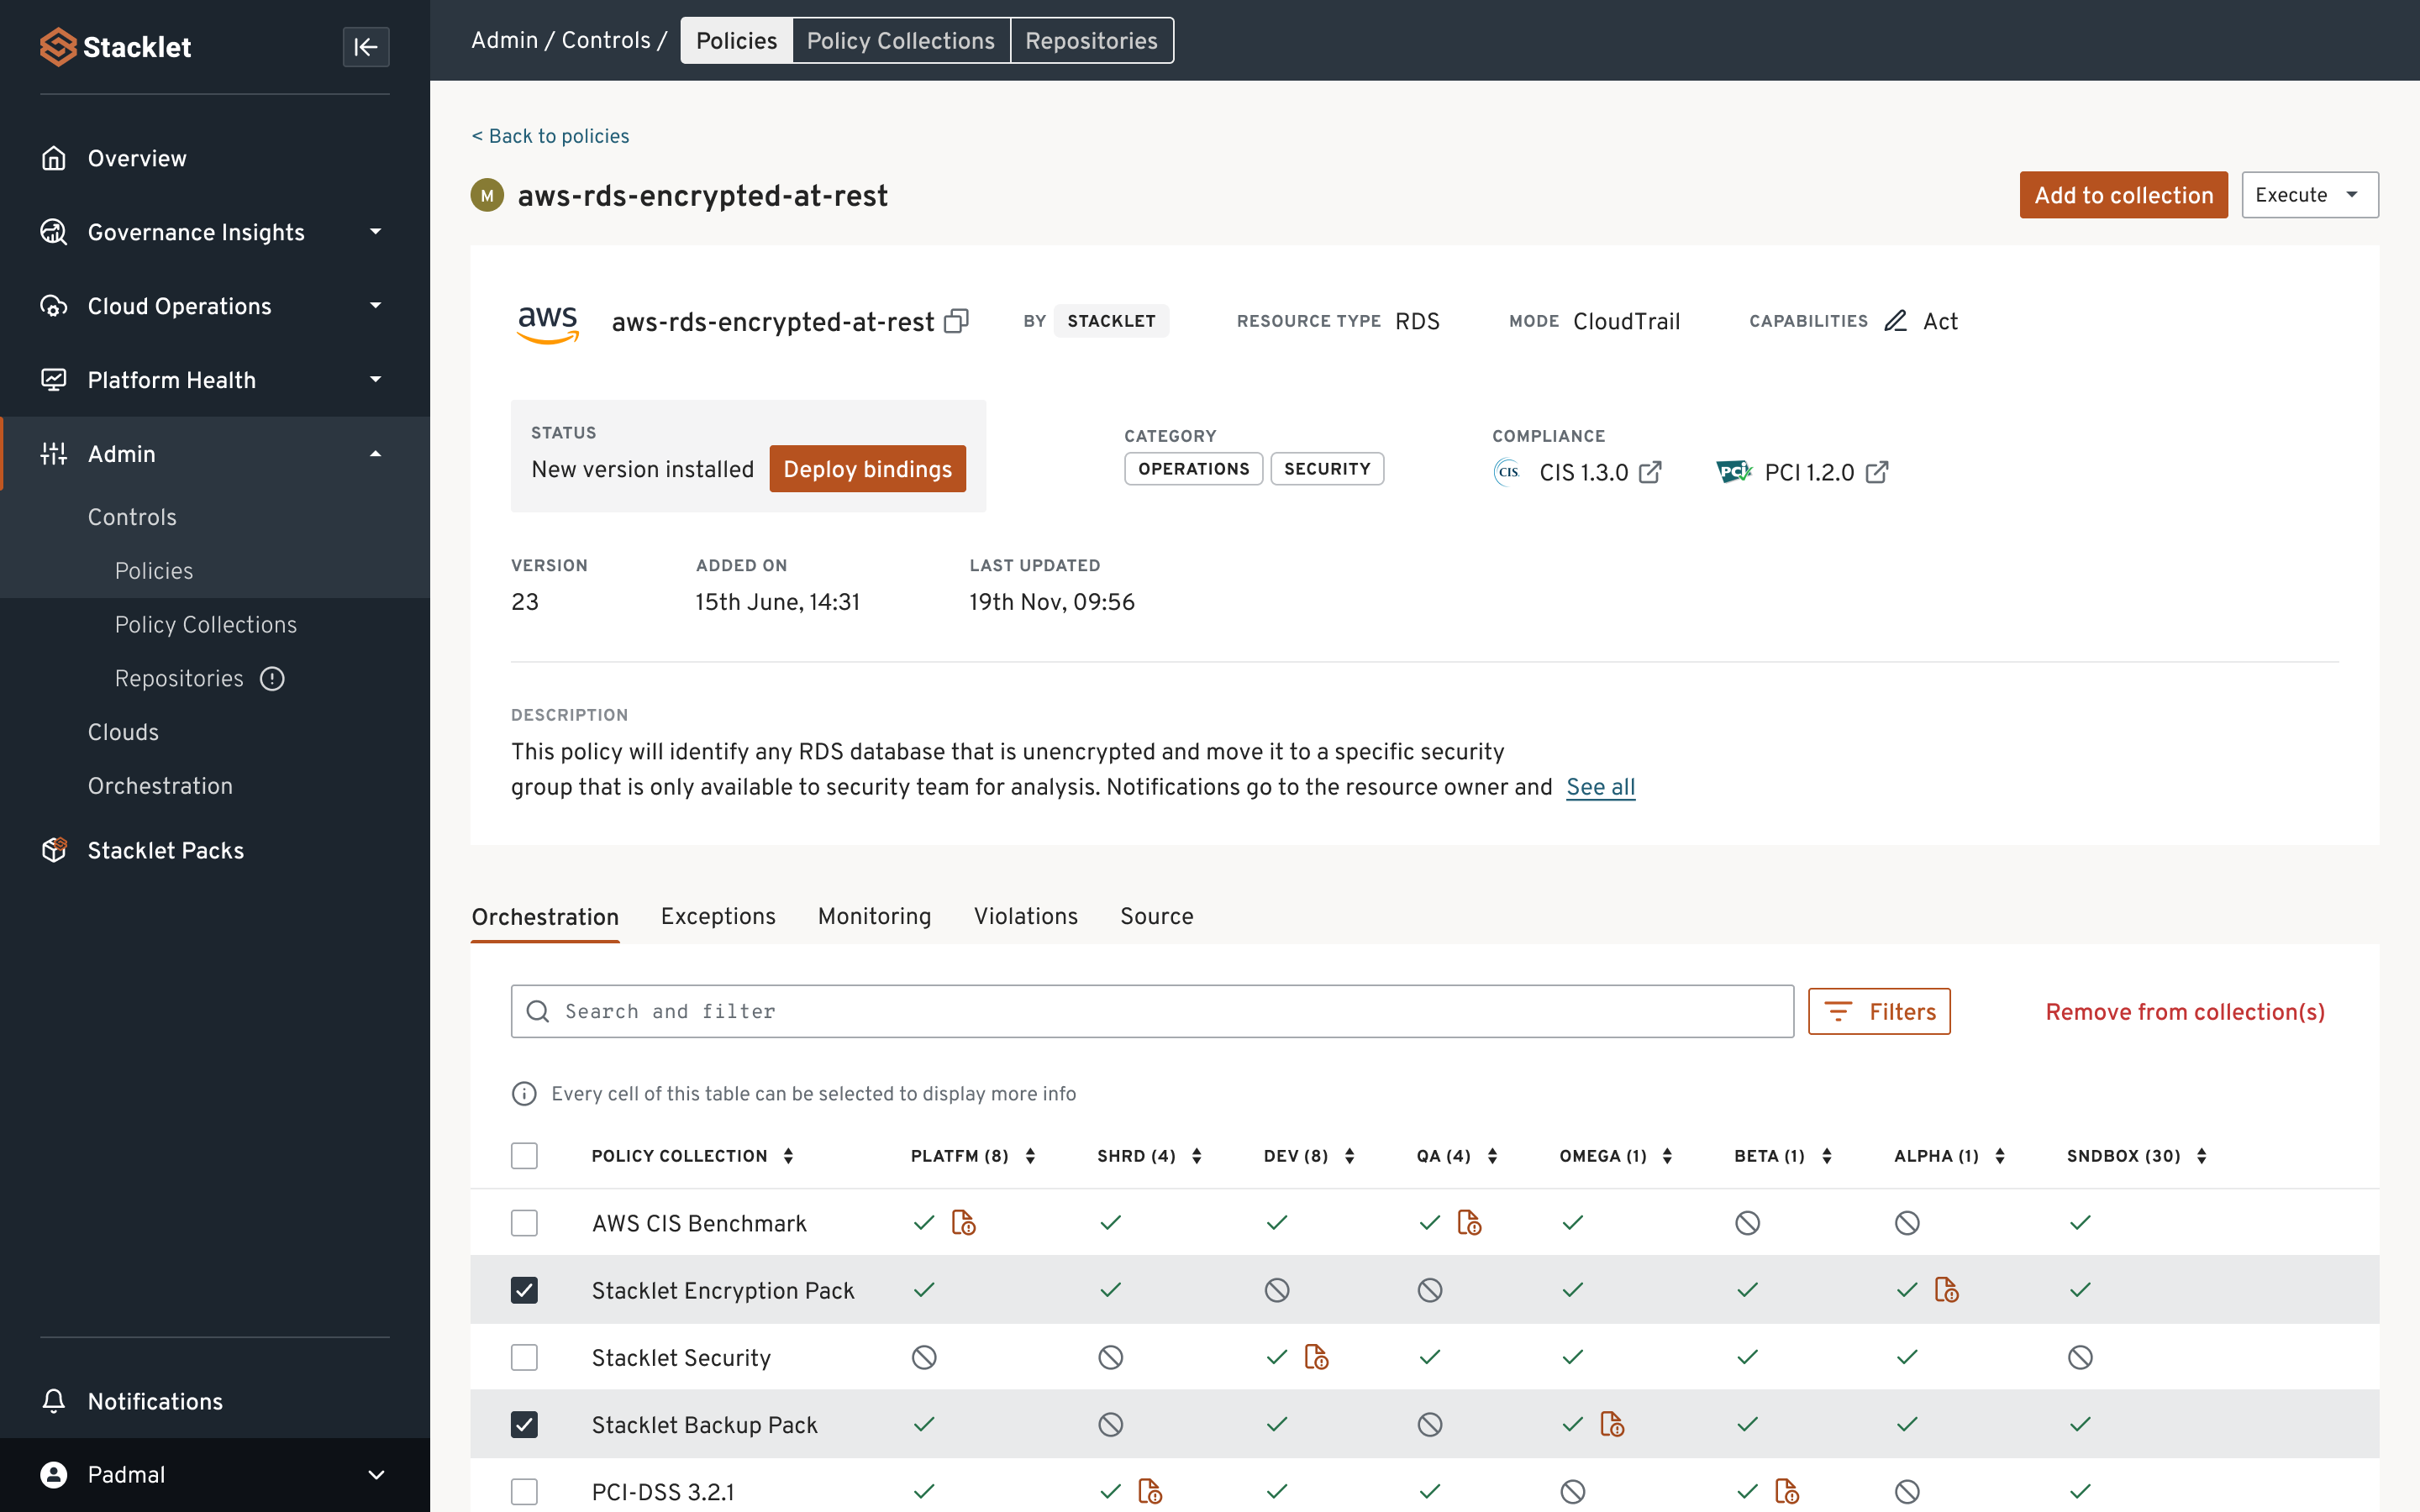
    Stacklet has added collaboration capabilities to its security and compliance platform that automatically groups related notifications, routes them to the right stakeholders and integrates with existing workflows and collaboration tools.

    The Stacklet platform is based on Cloud Custodian, an open source project that provides access to a domain-specific language that enables an IT team to employ YAML files to manage compliance-as-code.

    Stacklet CEO Travis Stanfield said that approach makes it simpler for organizations that have embraced DevSecOps best practices to comply with a wide range of mandates by shifting responsibility for achieving compliance further left toward DevOps teams.

    The latest version of the Stacklet Platform adds communications capabilities that leverage cloud resource configuration and policy metadata to automatically route notifications and escalations. Customizable notification templates add context for teams to collaborate either via email or integrations with Slack, Microsoft Teams and Symphony instant messaging. The Stacklet Platform can also trigger external workflows in tools such as Jira and ServiceNow to track issue resolution and generate reports.

    Ultimately, the goal is to make it simpler for IT teams to prioritize their compliance remediation efforts by keeping everyone involved continuously updated, said Stanfield.

    The number of compliance and security issues that organizations are experiencing in cloud computing environments is especially problematic. Developers often employ infrastructure-as-code (IaC) tools to provision cloud infrastructure. Unfortunately, they typically lack security and compliance expertise, which then results in large numbers of misconfigurations.

    The Stacklet platform is designed to give DevOps teams a way to prevent compliance and security issues using a compliance-as-code framework that spans multiple cloud platforms rather than requiring DevOps teams to employ a different set of compliance tools for each cloud platform on which applications are deployed.

    It’s not clear yet how far left responsibility for compliance will shift. In theory, organizations could avoid penalties if compliance issues are addressed before an application is deployed in a production environment. However, the teams that manage compliance in larger enterprises today are even further removed from DevOps teams than their cybersecurity counterparts. It may be several years before the cultural divide between these teams is bridged. In the meantime, many DevOps teams are taking it upon themselves to manage compliance as code to prevent unexpected issues from arising at the last minute before deployment.

    Overall, the goal is to enable DevOps teams to enforce compliance policies without slowing down the rate at which applications are built and deployed. The hope is that the adoption of compliance-as-code and DevSecOps best practices will address that issue. In fact, as the pace at which applications are deployed continues to accelerate to support digital business transformation initiatives, the number of potential compliance issues steadily increases. More troubling still, the greater the number of compliance issues there are, the more likely it becomes that cybercriminals will find a vulnerability to exploit.

  • Sentry Acquires Specto to Add Analytics Tool for Observability

    Sentry Acquires Specto to Add Analytics Tool for Observability

    Sentry this week announced it has acquired Specto, a provider of a set of tools for analyzing the performance of mobile applications.

    As the number of mobile applications being deployed continues to expand, developers are being asked to manage them as part of a general shift left that requires them to take on more accountability for how well their applications run in a production environment.

    Sentry CEO Milin Desai said today the Specto tools are focused on making it easier for developers to determine how mobile applications are running, but that the plan is to expand that analytics capability to a wider range of applications.

    As the responsibility for applications continues to shift left toward developers, the need for observability and monitoring tools that developers can easily use is becoming more acute. Sentry already provides a JavaScript software development kit that enables developers to insert a small amount of code in their application to track, for example, how many times an application failed. The Specto tools will take those observability capabilities to a deeper level by enabling developers to analyze a wider range of metrics collected, said Desai.

    Of course, DevOps teams are already collecting metrics, as well. Sentry has worked with partners such as GitLab and GitHub to provide a plug-in that makes it possible for DevOps teams to see the same metrics that developers are now using to manage applications. The goal is to make it easier for developers and IT operations teams to collaborate around a common set of metrics, said Desai.

    The rate at which responsibility for the management of applications is being shifted left, of course, varies widely. Some organizations continue to prefer to have developers mainly focus on writing code. However, Desai said Sentry is encountering more instances where site reliability engineers (SREs) are providing Sentry tools to developers as part of an effort to provide them with more insight into how their applications are running in a production environment.

    Historically, IT operations teams have relied on application performance management (APM) platforms to manage IT operations. Those platforms are now evolving into observability platforms that promise to provide more context by correlating events as they occur across both applications and IT infrastructure platforms. That approach, however, typically requires developers to insert agent software into their applications. Once inserted, that agent software needs to be maintained and updated within the context of a larger DevOps workflow.

    The Sentry approach provides developers with a tool for collecting data from an application that, after being embedded in the application, consumes just tens of kilobytes of memory. That approach eliminates the need to rely on much larger agent software to achieve observability.

    Regardless of how developers go about instrumenting their applications, the overall state of observability clearly needs to improve as application environments become more complex. The issue now is determining how best to achieve that goal in a way that benefits both developers and DevOps teams alike.

  • AWS Outage Exposes Weaknesses of DevOps Resilience

    AWS Outage Exposes Weaknesses of DevOps Resilience

    The December 7, 2021 Amazon Web Services (AWS) outage severely disrupted services from a wide range of businesses for more than five hours and highlighted just how reliant businesses have become on internet-delivered services. The outage mostly impacted web services in the eastern U.S., yet the implications are universal: It’s a reminder that many businesses blindly ignored the old axiom about putting all your eggs in one basket and instead are relying on a provider with a single point of failure.

    Services ranging from airline booking systems to streaming video to e-commerce were disrupted during the outage, causing millions of dollars in lost revenue and countless hours in productivity. One of the more interesting aspects of the outage is the impact it had on services from collaboration vendors such as Slack, Trello, Asana and Smartsheet—tools that many development and DevOps teams have come to rely on.

    Furthermore, core AWS services, such as the company’s Elastic Compute and DynamoDB cloud tools were also impacted, disrupting many third-party services and severely hampering business processes that use those services. While the obvious victims of the outage are well known, like Amazon’s own e-commerce operation, there is a troubling undercurrent: The disruption to DevOps frameworks and those using them.

    AWS has been rather tight-lipped about the root cause of the outage thus far; however, there are still many lessons to be learned for the DevOps community and questions that must be asked such as “Can the DevOps process survive during IaaS/SaaS disruptions?” and “Can multi-cloud failover solutions be baked into the applications DevOps builds?”

    There are no simple answers to those questions, but the outage highlights the need to understand the underlying architecture and framework of a deployed DevOps system. Take, for example, how many developers in the DevOps community have embraced SaaS tools to accelerate the development process and to feed CI/CD pipelines. SaaS applications such as code scanners, pipeline orchestration and even IDEs have become common in the world of DevOps. But has anyone bothered to ask what happens if a single one of those tools fails?

    What’s more, the reliance on SaaS tools in the development process has led to the creation of potential liabilities in the applications created by DevOps developers. DevOps applications have come to rely on APIs, are often driven by microservices and are frequently deployed into containers that run on SaaS. If any of those elements become non-functional, numerous applications could fail, ultimately putting the onus on developers to explain why they are creating applications with a single point of failure.

    Moving forward, the DevOps community needs to take a serious look at the components of their frameworks and determine if there are any single points of failure—including their IaaS/SaaS providers. While it may be impossible to remediate every single one, there is a lesson to be learned about how fragile the development process can become if no one bothers to build an inventory of the tools used and take into account how a failure of any one of those tools could impact workflow. There are numerous examples of how an external failure of a single component impacted the functionality of an application, while the discovery process of the root cause has taken days or even weeks. This can be mostly attributed to not only a lack of knowledge, but a lack of visibility into the components used.

    Those lessons can be extended to the development process itself, where the best practice of rooting out single points of failure can be extended to the applications themselves. Leveraging that intelligence starts with understanding the concept of a software bill of materials (SBoM), a piece of supporting documentation that is becoming increasingly important to the purveyors of applications. A properly-defined SBoM reveals all of the components (libraries, APIs, etc.) that are baked into an application and can be used as a map to define where weaknesses may lie.

    For the DevOps community, the recent AWS outage has become a clarion call to look inward and discover how the applications they are building may be part of the problem. With continuity and resiliency becoming major topics in the IT and business realm, it’s about time that DevOps practitioners start to look at how they can support both of those business-critical needs. The days of finger-pointing to shift blame must come to an end, and if businesses that rely on software want to grow, someone needs to take responsibility for providing answers when outages occur and learn from those outages to create applications that are more resilient.

  • Vercel Acquires Turborepo to Gain Build System

    Vercel Acquires Turborepo to Gain Build System

    Vercel today announced it has acquired Turborepo, a provider of a build system for JavaScript and TypeScript applications that provides developers with access to an easy-to-use monorepository for their code.

    In the wake of that acquisition, the command line interface (CLI) for accessing Turborepo will now be available under an open source license.

    Jared Palmer, creator of Turborepo and other popular open source projects including Formik and TSDX, will continue working on accelerating Turborepo’s capabilities as the new leader of a build performance team at Vercel.

    The goal is to move existing users of the Turborepo cloud service to a Vercel platform for building applications using the Next.js framework, which makes it possible to build web applications based on the React library for creating user interfaces that enable both static site generation (SSG) and server-side rendering (SSR).

    Palmer said monrepositories such as Turborepo not only make it easier for developers to manage builds but also reduce the amount of time required to process those builds using a continuous integration/continuous delivery (CI/CD) platform.

    Rival build systems are also much more complex to configure and manage, which Palmer said is a primary reason many developers have not yet set up their own mononrepositories.

    As the number of applications that organizations want to build and deploy in the digital business transformation era increases, the focus on developer productivity is intensifying. Rather than having to maintain a complex build system, Turborepo is designed to be simple to configure. As a result, more developers can reduce build times by as much as 50%, noted Palmer.

    In effect, front-end developers are able to more easily become full-stack developers by combining that build system with the Next.js framework, he added.

    DevOps teams will need to adjust to applications capable of providing richer application experiences without relying as much on backend infrastructure. That shift has implications for everything from the amount of network bandwidth consumed to the performance of web applications. The Vercel platform employs caching, routing and a React framework to optimize application performance in a way that reduces the dependency on backend infrastructure to optimize application performance.

    As web application development continues to evolve, the overall rate at which they web apps are built should increase significantly. Naturally, DevOps teams will need to consider the implications of having more applications move through DevOps pipelines and the need to continuously update those after they are deployed.

    It’s not clear whether or how much DevOps teams will nudge developers toward frameworks such as Next.js to develop web applications that might not tax backend infrastructure as much as previous generations of applications. In effect, developers can take advantage of frameworks that enable them to treat the underlying IT infrastructure as if it were serverless whenever possible with tools that have a familiar JavaScript construct. Vercel claimed there are already more than 30,000 sites running Next.js in production at organizations like Airbnb, Hulu, Nike, Ticketmaster and Uber.

    One way or another, it’s clear that the way web applications are being built is fundamentally changing. The only issue now is determining to what degree the rest of the IT organization is prepared to absorb that level of change.

  • API Sprawl a Looming Threat to Digital Economy

    API Sprawl a Looming Threat to Digital Economy

    New estimates say the total number of public and private APIs in use is approaching a whopping 200 million. APIs are becoming increasingly crucial to the global digital economy. They are the backbone of many digital platforms and drive the composable enterprise model. But this ubiquity presents sprawl issues.

    F5 recently released a study that examines the conditions of the API economy at large. Authored by Rajesh Narayanan and Mike Wiley of F5, the paper, Continual API Sprawl: Challenges and Opportunities in an API Driven Economy, articulates the state of API sprawl and the conditions behind its arrival.

    According to Narayanan and Wiley, “If data is the new oil, then APIs will become the new plastic.” This looming reality will require a continuous approach to API management to avoid further polluting the digital ecosystem.

    Below, I’ll review the report’s main takeaways to see what has given rise to API sprawl and consider how IT leaders should respond.

    State of API Growth

    APIs have evolved as a standard mechanism for businesses and services to connect and share value. And, as more companies begin to rely on them, the API economy is becoming big business—83% of organizations today consider API integration a critical part of their business strategy, according to the 2020 Cloud Elements State of API Integration Report.

    There is a proliferation of API styles. Thousands of public productized APIs exist, but more private and partner APIs are in use. Technically speaking, APIs come in many different forms—they may be web-based, browser-based or embedded into devices. The report also identifies single-purpose APIs and those that aggregate multiple data providers.

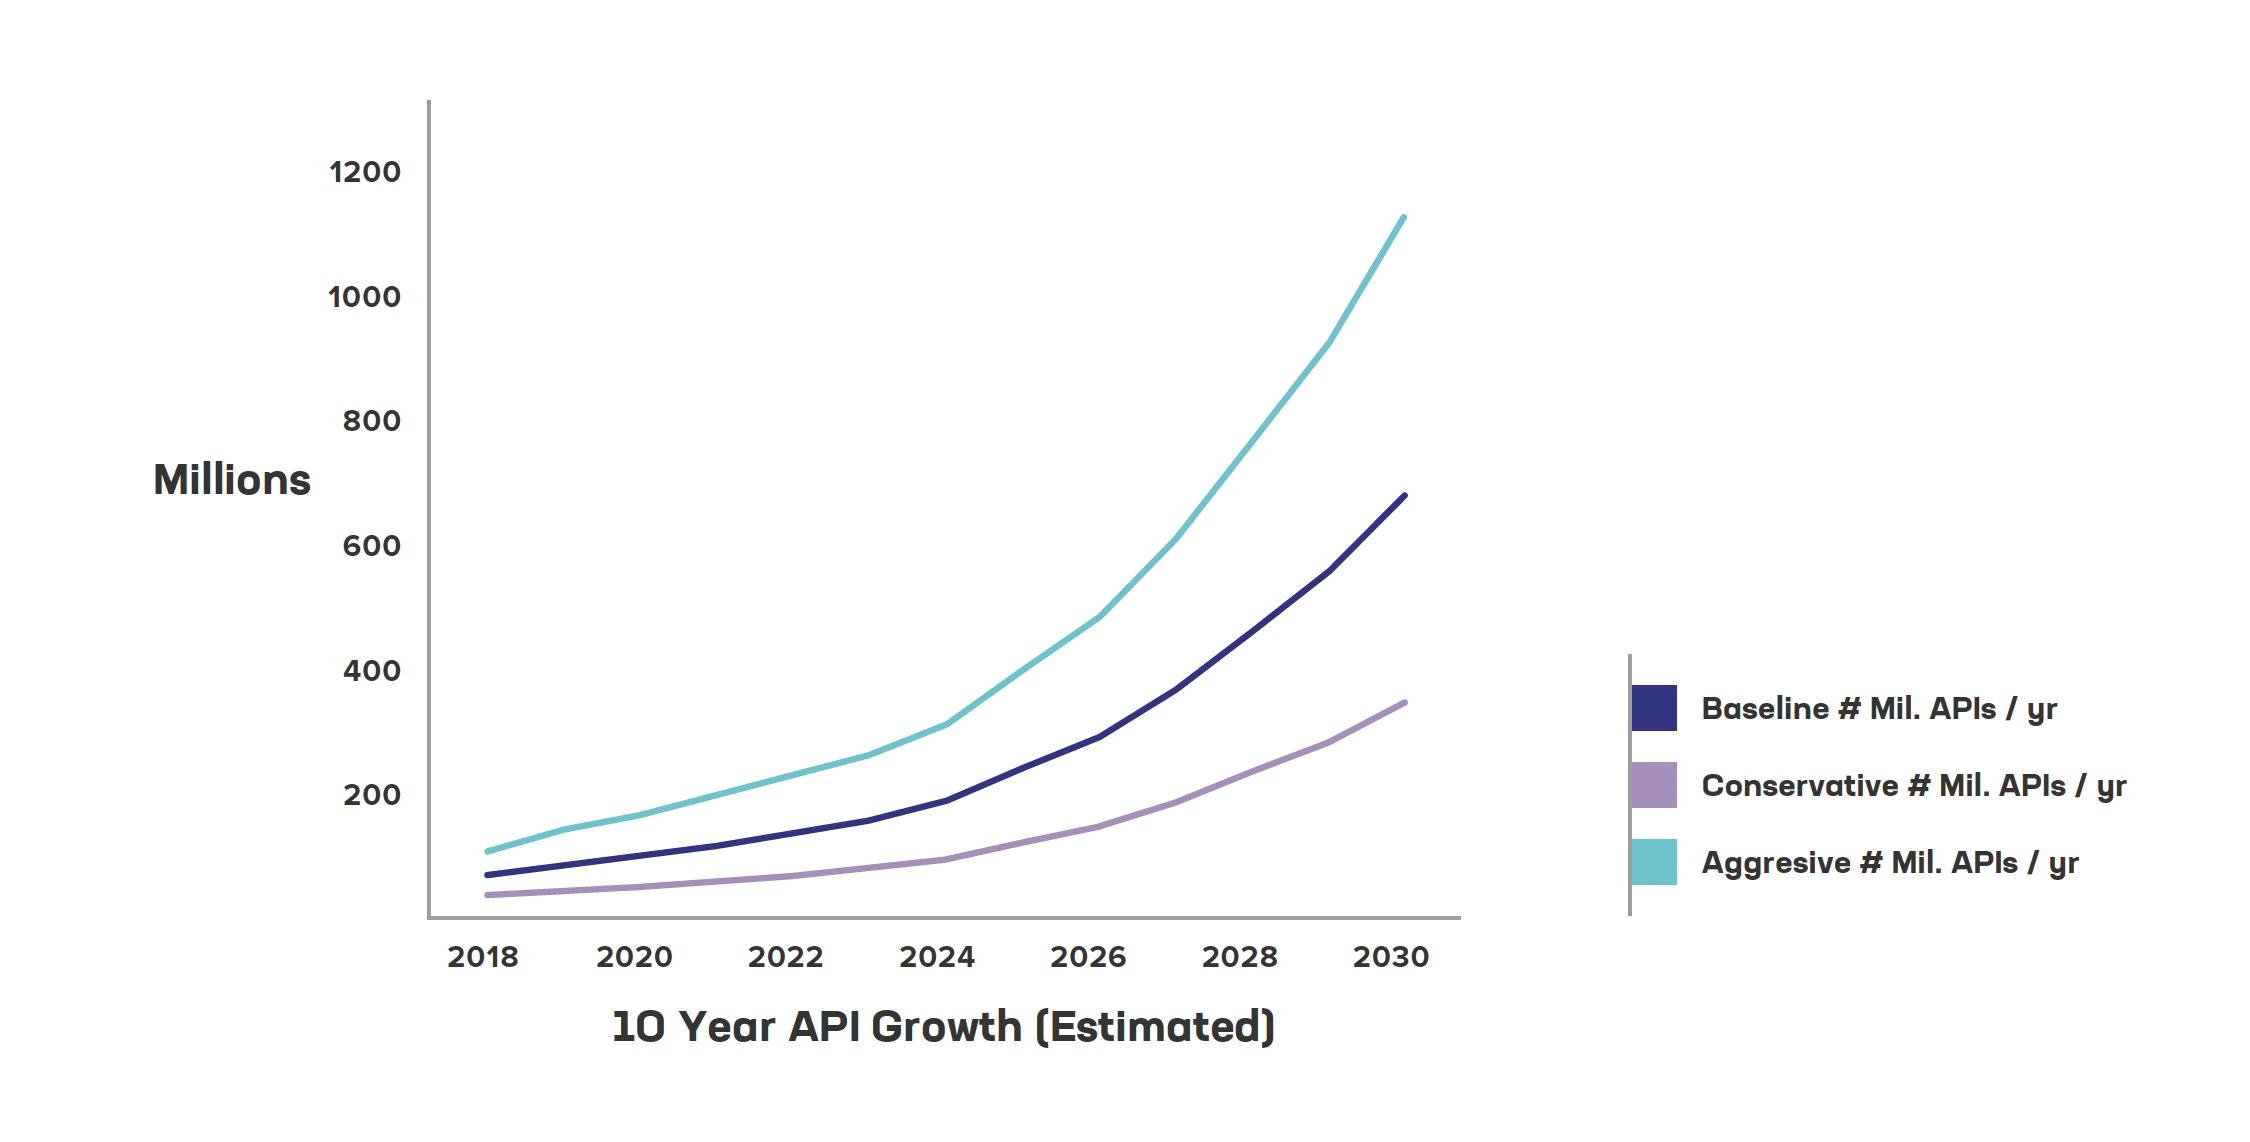
    API use cases are pervasive, from hotel bookings to weather, stock tickers, transportation, IoT, DevOps workflows and many other areas. “API-powered apps have permeated every aspect of our lives,” said the report. Yet, typical market estimates are usually quite conservative when sizing up this market, said F5. According to F5’s aggressive calculations, we will be approaching 1.7 billion active APIs by 2030.

    APIs present a high value from startup use cases to enterprise applications. However, a downside is that this growth is leading to sprawl, said Narayanan and Wiley.

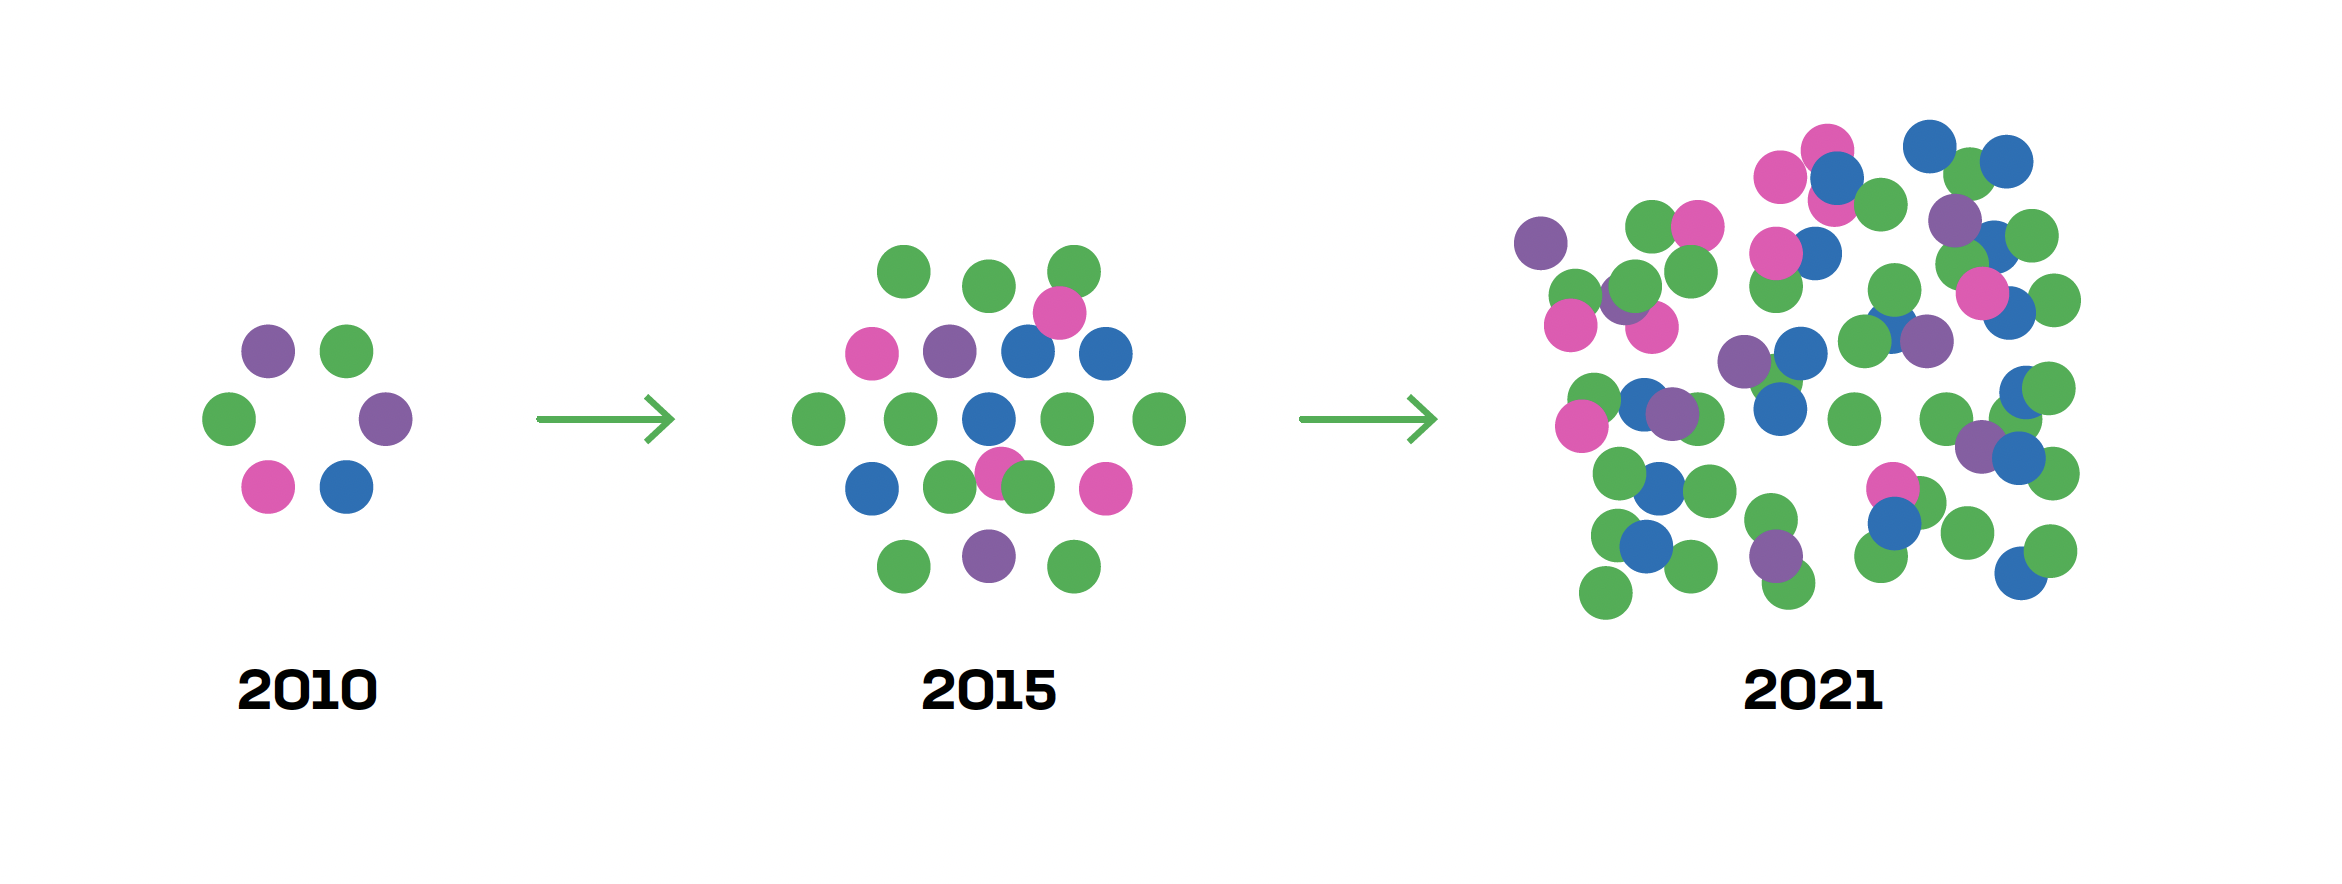
    API sprawl is the term used to describe both the exponentially large number of APIs being created and the physical spread of the distributed infrastructure locations where the APIs are deployed.

    Factors Driving API Sprawl

    Sheer growth. Sources predict the number of developers will grow to 45 million by 2030. SlashData also estimates that 30% of developers already use APIs. As the number of APIs on the market moves into the millions, managing growth poses a significant challenge, especially without proper governance and best practices.

    Lack of standards. “The lack of a common shared model contributes to API sprawl,” the report said. API design standards do exist, yet guidelines often leave room for nuances between services. Standards have also emerged around specific industries, like financial data exchange (FDX). While helpful for a single sector, this doesn’t advance multiple industries simultaneously. A lack of standardization leads to differing versioning approaches and integration challenges.

    New development approaches. Integration requirements are forcing many new APIs to unite disparate business apps. The microservices architecture trend is also adding to sprawl, as “APIs are both northbound to interfaces via microservices and horizontally between microservices.”

    Continuous software development. Continuous development, paired with the need to connect business units with bespoke requirements, could produce multiple versions of the same API. This quickly leads to maintenance difficulties, out-of-date documentation and broken clients. The report also cites rising data creation and “everything-as-a-service” trends as harbingers of an API sprawl.

    Various computing evolutions. New computing trends are also prompting a sprawl, says the report. Business units may be operating on different on-premises or cloud environments. When this hybrid situation occurs, APIs could get dispersed over many locations and become difficult to track. Specific connections may be created to cater to new environments like edge computing and IoT devices, further increasing sprawl.

    Problems With API Sprawl

    A digital economy reliant on APIs also relies on the underlying stability and availability of these services. Yet, “APIs have a shelf life and become unsupported if ignored by the developers,” the paper acknowledged. It could be hard to maintain service reliability for APIs sprawled across a distributed cloud. In addition to reliability issues, there are many other possible repercussions of an API sprawl.

    For one, management and operation at scale become difficult. Not all APIs are based on a specification, like OpenAPI. This means that API documentation may not be as streamlined and accessible, thus hurting discoverability and onboarding. “A simple means to connect these APIs may not be possible with conventional or legacy networking approaches,” the report added.

    As developers are top consumers of APIs, a sprawl could negatively impact their integration experience. Maintaining a swelling library of API dependencies can be cumbersome. Plus, APIs are prone to evolve and version over time and when endpoints are altered without advance notice, it leads to broken clients. Even small changes in API functionality can have a huge impact since all observable API behaviors will become relied upon, whether documented or not. (This is known as Hyrum’s Law).

    But the security ramifications of API sprawl are perhaps the most troubling. A whopping 91% of enterprises experienced an API security incident in 2020. Malicious API traffic also rose by a staggering 300% in mid-2021, Salt Labs found. Increased API use will undoubtedly cause more frequent attacks.

    “Unmanaged API sprawl is a security breach waiting to happen,” said the report. APIs typically adopt API keys for authentication and authorization, but this method is prone to misuse. Credentials are often exposed or misconfigured. Bad actors can use APIs to steal loads of data and computing power. As a result, sprawl is undermining trust in API connections and responses.

    Mitigating The Sprawl

    With the growth of the API economy slated to reach the billion mark in the next ten years, figuring out secure, stable inter-cluster communication will become more critical. According to F5, existing solutions (gateways, ingress controllers, service mesh and forward and reverse proxies) are not an adequate response.

    “We believe the solution should hence involve an intermediary (proxy) device focused on solving inter-cluster connectivity, security and integration challenges.” The writers call this solution API Gateway 2.0, which they describe as a bi-directional application-level proxy. The technology exists to implement such middleware and perhaps it could help companies address sprawl issues.

    Outside of Narayanan’s and Wiley’s recommendations, there are plenty of actions API owners can take to avoid adding to the sprawl. Here are a few:

    • Treat the API as a product
    • Improve developer experience
    • Use spec-driven development
    • Ensure up-to-date documentation and code libraries
    • Use consistent endpoint naming
    • Set clear guidelines for versioning and deprecation
    • Go beyond API keys with OAuth and OpenID Connect

    For more context, check out Continual API Sprawl: Challenges and Opportunities in an API Driven Economy for free without an email gate here.

  • Sumo Logic Extends Observability Reach to AWS Lambda

    Sumo Logic Extends Observability Reach to AWS Lambda

    At the AWS re:Invent conference this week, Sumo Logic announced that in addition to collecting log data, metrics and traces, it now can collect telemetry data from the Lambda serverless computing service provided by Amazon Web Services (AWS).

    In addition to collecting telemetry data, Sumo Logic also revealed that the Sumo Logic Continuous Intelligence Platform hosted on the AWS cloud can now analyze how functions used on the AWS Lambda service perform during transactions.

    That data can then also be correlated against the performance of other AWS services that Sumo Logic tracks via integrations with the AWS CloudWatch and AWS CloudTrail monitoring services.

    George Gerchow, chief security officer for Sumo Logic, said the company is making extensive use of the OpenTelemetry agent software created under the auspices of the Cloud Native Computing Foundation (CNCF) to make it simpler to instrument IT environments. That data is not only being used to improve application performance but also to surface anomalies indicative of a security breach, he added.

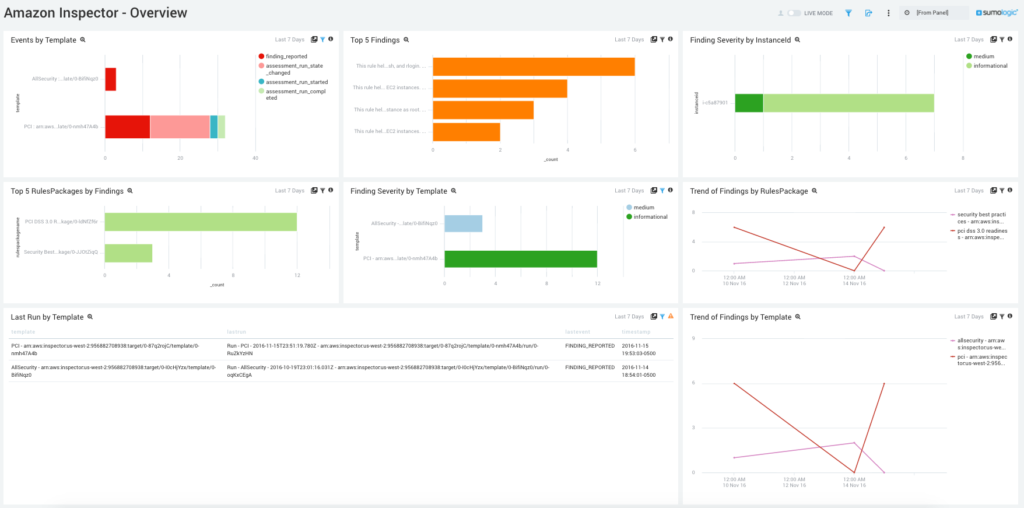
    As part of this ongoing security effort, Sumo Logic this week also added Sumo Logic AWS Quick Start integrations for rapid access to security and compliance insights along with support for Amazon Inspector, a vulnerability management service provided by AWS.

    AWS this week named Sumo Logic as its independent software vendor (ISV) partner of the year. The two companies have a longstanding relationship that began with Sumo Logic’s decision more than 10 years ago to build a monitoring platform hosted on the AWS cloud.

    As IT monitoring tools continue to evolve into observability platforms, Gerchow said it’s becoming much easier to leverage machine learning algorithms and open source agent software to identify the root cause of an issue before it results in a major disruption.

    Most IT teams today are still relying on legacy monitoring tools that only tack a set of predefined metrics to identify when a specific platform or application is performing within expectations. The metrics tracked generally focus on, for example, resource utilization. In contrast, observability combines metrics, logs and traces—a specialized form of logging—to instrument applications in a way that makes it simpler to troubleshoot issues.

    Observability, of course, in one form or another, has always been a core tenet of DevOps best practices. Initially, DevOps teams focused on continuous monitoring as the most effective way to proactively manage application environments. However, it can still take days (and sometimes weeks) to discover the root cause of an issue. Observability platforms promise to make it easier to manage IT environments even as the overall complexity of those environments continues to increase.

    It’s not clear at what rate IT organizations will be transitioning to observability platforms. However, it generally takes only one major outage before IT organizations start looking for better tools to manage their IT environment. As those IT environments become more complex, the probability that there will be a significant disruption is now higher than it’s ever been. The challenge and the opportunity is to find a way to instrument applications more widely; the expectation being that an observability platform will be able to analyze telemetry data to reduce the number of issues that lead to service disruptions.