Category: DevOps Toolbox

  • Why Vertical Collaboration Matters for DevOps

    Why Vertical Collaboration Matters for DevOps

    Vertical collaboration is defined by Rick Defour as a team of people working interdependently toward a common goal for which they are all mutually accountable.

    5699770361_566444924c_z

    Now that everyone is clear on the importance of collaboration and the different types, it’s time to delve into the importance of one type of collaboration in particular: vertical. Vertical collaboration is defined by Rick Defour as a team of people working interdependently toward a common goal for which they are all mutually accountable. You can find examples of vertical collaboration in educational settings where teachers of different levels work together to insure student success and in manufacturing settings where the supplier & retailer can better leverage themselves to enhance the bottom line for both.

    When you think of vertical collaboration in the tech space, the example of a dev team pushing out code is a good one. Each dev has a different area of specialty but they must work together in order to implement the new feature. Taking this into consideration then, it’s easy to see why a vertical collaboration tool has to be easy to use and not create any new boundaries. The more vertical a collaborative tool is built, the more useful it is to real people.

    The problem, of course, is that many companies view all collaboration tools as vertical. They only want to spend money on one tool so they pick the horizontal one (thinking that it’s the one more people will use) and it turns out to not actually be helpful to anyone. So that’s when companies start adding to their toolbox and then end up with a hodgepodge of tools. Instead of making their collaboration process more effective, they have made it more convoluted.

    I created VictorOps because there was no existing vertical collaboration platform for DevOps. Going into it, I knew I was solving a problem I’d had at a number of previous companies and therefore already knew the exact requirements needed. The collaborative platform would have to be mobile first, would have to allow for synchronous engagement while enabling asynchronous problem solving and would have to give all participants symmetric access to information from their enterprise monitoring platform.

    What I realized after creating VictorOps and using it to solve our own internal issues is that vertical collaboration gives team members the opportunity for scalable “leaning in” while also providing the freedom to lean out to reflect. What’s not to love about that?

  • Not all collaboration types are equal

    Not all collaboration types are equal

    Talking about collaboration in general terms is easy. I’ve done it and so has everyone else. It’s time now to dig deeper into the specifics of collaboration, meaning the different types – asynchronous vs. synchronous, vertical vs. horizontal – and how different companies fit into the magic collaboration quadrant. And yes, the quadrant is indeed magical.

    Let’s start with the two types of collaboration that are time-relevant, asynchronous and synchronous. Asynchronous collaboration takes place outside of real-time. The best example of a ubiquitous asynchronous collaboration tool is email. You send an email and the receiver has time to digest the information. The drawback to asynchronous communication is that it’s inadequate as a means of communicating a sense of urgency. You have to wait for someone to respond to an email and that lack of immediacy can cause damage in troubleshooting or problem solving situations. Email replies tend to include the original message for context because you can’t rely on the timing of the message to keep the context.

    On the other side of that collaboration coin, you have synchronous collaboration. Synchronous communication takes place like a conversation and more closely resembles a face-to-face interaction. A chat session is the ideal illustration of this concept. The obvious benefit to synchronous collaboration is the ability to send and receive information right away. This adds to the feeling of immediacy and tends to provide a more effective means of working together to solve issues in real-time.

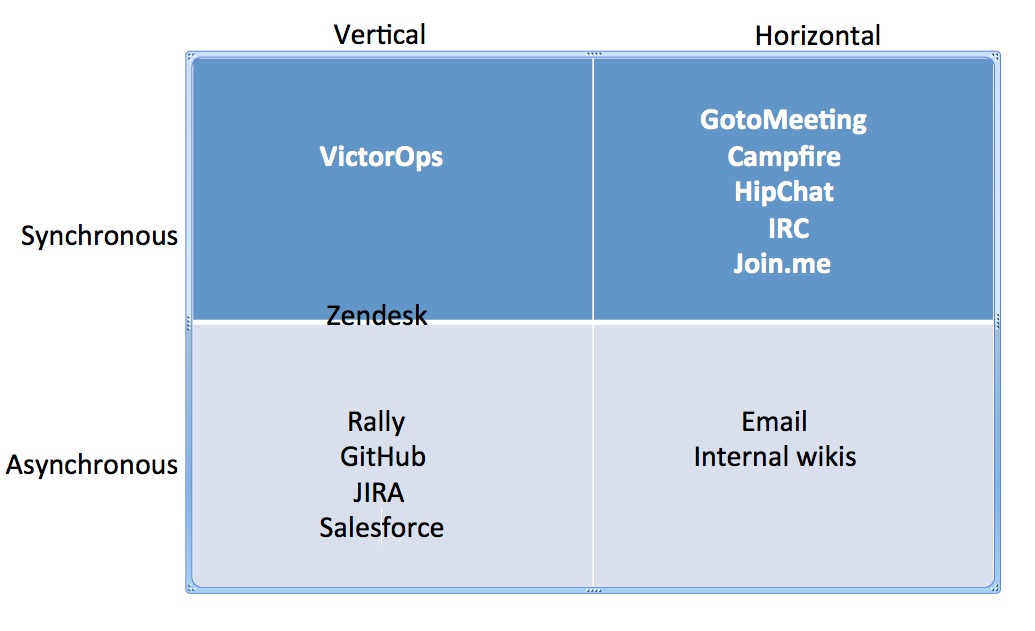
    Now that we have that covered, it’s time to move to the other defining aspect of collaboration: whether it’s vertical or horizontal. Vertical collaboration consists of problem solving tools that are domain-specific. An example of a vertical collaboration tool is one built for certain parts of the business like Salesforce for the Sales & Marketing teams or Rally for the development team. Horizontal collaboration consists of non-domain specific tools, meaning that they have potential use across all teams of an organization. Project management tools like Campfire or remote meeting solutions like Join.me or WebEx are examples of horizontal collaboration tools which tend to be widely adopted but lack the ability to really go very deep in helping in a domain-specific way.

    Check out the quadrant I created to better show where different companies currently fit into the ever-growing collaboration landscape, based on the definitions provided above.

    collaboration_quadrant2

    When looking at the state of collaboration tools, it’s interesting to note where most companies land within the quadrant. Why so few vertical synchronous ones? I’ll answer that next time.

  • Mobile Apps and Big Data Megatrends Drive Application Performance Management

    Mobile Apps and Big Data Megatrends Drive Application Performance Management

    As the megatrends of Big Data, mobility and cloud continue to reshape the IT landscape many companies are responding by refocusing their solutions to provide better visibility and support for these technologies.  Case in point is AppDynamics new Spring 2014 release announced yesterday (full disclosure, AppDynamics is a sponsor on staging-devopsy.kinsta.cloud but that sponsorship has nothing to do with editorial content, just banners).

    Jyoti Final_1I had a chance to catch up with Jyoti Bansal, founder and CEO of AppDynamics yesterday. Jyoti made it very plain that mobile applications are quickly tipping the bar in terms of what types of applications his customers are asking for support on. That along with enhanced NoSQL support and support of some for some of the hottest languages being used in development today (Node.js and Scala) lead the way in his company’s latest release.

    Gartner has weighed in on the increasing importance of monitoring mobile app performance.  Jonah Kowall, research vice president at Gartner, in a recent report states, “driven by the increasing significance of mobile application endpoints and increasingly dynamic Web technologies, end-user-experience monitoring will become even more important to enterprises. In fact, it is likely to shift its center of gravity from monitoring the end-user experience of individual applications to monitoring and analyzing end-user behaviors across the entire portfolio of applications available to an end-user at any given endpoint.”

    Personally I don’t think any of us need Gartner to tell us that there is an app for just about anything and many of them are mobile. Mobility is changing the way so many of us work. Mobile apps are poised to overtake web browsing sometime this year says Jyoti.

    If anything is bigger than mobile though it may be Big Data. It seems that Big Data is everywhere. I saw an interesting stat the other day, something along the lines of 90% of all the data stored in the world is less than two years old. I guess that explains why we didn’t hear as much about Big Data before that.  In any event there is big money being poured into Big Data solutions. Evidence of this is Intel’s Cloudera investment, $740m for 18% of the company. Cloudera is a Hadoop distributor of course and part of the AppDynamics new Big Data support is for enhanced Hadoop features.

    NoSQL companies have also been a big beneficiary of the Big Data megatrend  and VC investment of course. One of the biggest beneficiaries is MongoDB (again in full disclosure, staging-devopsy.kinsta.cloud is a media sponsor of MongoDB World).  Matt Asay who has written here on staging-devopsy.kinsta.cloud and is also the VP of Marketing and Business Development had this to say about AppDynamics new NoSQL support. “Together with AppDynamics and MongoDB, organizations can now leverage application performance management solutions to gain further insight into their MongoDB-based applications. This partnership allows users end-to-end visibility for optimal performance in production, an important feature for companies as they scale their MongoDB deployments.”

    To be accurate all of these new features in the Spring 2014 release of AppDynamics have actually been available already for at least a few weeks or months. In my conversation with Bansal I asked him that if he didn’t see a little irony in the fact that a DevOps enabler like AppDynamics still did somewhat traditional software releases instead of some sort of continuous delivery.  Bansal said that these once a quarter releases are really just packaging up features that are released in a continuous fashion over the preceding quarter.  These quarterly releases serve as a checkpoint, version control if you will.  In actuality though AppDynamic customers have been getting this functionality as it comes out.

    Application Performance Management seems to be a very hot area. In large part because of the mega trends of Big Data, mobility and cloud. It remains to be seen if these solutions will become part of (by acquisition or partnership) the bigger Application Development Lifecycle Management (ALM) market.

  • MongoDB Replication Pro-tips: Reporting Instances

    MongoDB Replication Pro-tips: Reporting Instances

    Any shop that has a DevOps culture, and that has MongoDB backed applications, uses replica sets… not just for production applications, but for those still in the prototyping phase. Replication is critical for uptime, so your Ops team has been working with your Devs all through the development of your project, and you didn’t defer a replication strategy until after you had a working app.

    Nor did you neglect to plan for your reporting needs. It is a given that beyond running your app, you need to get analytics on user behavior, general use, and other business-specific metrics. You can’t just run reports against your live database, (for reasons I detail below, in case they are not yet obvious to you). In your DevOps shop, developers and admins discussed, at the inception of the project, the plan for sequestering reporting tasks so that they do not interfere with production tasks.

    Keeping Reporting Reads Away From Production

    Limiting reporting queries to dedicated nodes is a canonical example, used all over the MongoDB replication documentation. Reporting does not require writes, and permits eventually consistent data. Daily summaries do not suffer if they are derived from data which is seconds or minutes stale. It does not change the fundamental meaning of user behavior reports if your counts are missing a few actions, and some tallies are slightly misaligned.

    But why is it so important to take advantage of this?

    Aside: The Problem With Mingling Production and Analytics

    Skip this section if this is already a no-brainer for you. If you want some background, read on.

    Consider the working set, the subset of your entire database that MongoDB reads from and writes to over any given time span. Your production environment will have a set of active users, and the documents pertaining to their data will be what the OS attempts to keep in physical memory.

    (Do not let your working set grow larger than RAM! If it’s heading there, you need to shard, so capacity planning is critical. But that’s a separate lesson. Monitor your instances with MongoDB’s free monitoring servicee, and maybe take an upcoming webinar in capacity planning.)

    Even if your database is hundreds or thousands of times the size of your available memory, if you have planned your schema and indices well, MongoDB will run efficiently because the data outside the working set can remain untouched on disk. As users become idle, their documents will fall out of use, and the RAM they occupy will become available to contain documents for new active users.

    Reporting jobs, though, read a wide range of data, do not visit the same data repeatedly, and each reporting task may address completely different data sets. On any database of decent size, this means these jobs require constant ejection of recently used documents from RAM to make room for new documents to be read. If you run these jobs on the same instance that is backing your production work load, your reporting jobs will fight with your production apps for RAM footprint, continuously ejecting your live users’ data, while your app continuously reloads it. Congratulations, you have built a thrashing machine.

    Replica Sets With Dedicated Reporting Instances

    You can build dedicated reporting nodes atop MongoDB replication by taking advantage of hidden replica set members, or tag sets in concert with read preferences. The first method is simpler, the second is more flexible.

    Reviewing MongoDB Replica Sets

    MongoDB Replica Sets create uptime durability by replicating data to all the nodes in a set, and providing seamless fail-over to clients. They contain one primary node that allows writes, while the rest are read-only secondaries. They manage among themselves which is primary, holding elections to determine which node should be primary when conditions require. Replica sets should contain an odd number of members to facilitate rapid elections without ties.

    It is fundamentally not knowable whether unreachable machines are down or if the network has been partitioned, so if a majority of the nodes in a replica set go offline (say, 2 out of a 3-member set), even if a healthy primary remains, it will step down to a read-only secondary. Not doing so could lead to multiple machines declaring themselves primary in the case of a network partition, and horrific data inconsistencies.

    Thus a replica set contains a minimum of 3 members, providing a fault tolerance of one machine failure.

    Reporting Instance, Hidden Member

    Hidden members of a replica set are configured to be priority: 0, to prevent them from ever being elected primary, and to be hidden: true, which prevents clients connected to the replica set from routing reads to it, even if they specify a read preference of secondary.

    To read from this hidden member, you will use a standalone connection, rather than the MongoReplicaSetClient type, and specify slave_ok.

    Hidden Member Setup

    We can use the mongo shell to hide a member of an existing replica set:

    # connect to primary directly
    Kusanagi:~ avery$ mongo --port 29019
    MongoDB shell version: 2.4.3
    connecting to: 127.0.0.1:29019/test
    
    // using my local replica set playground
    PRIMARY> conf = rs.config()
    {
        "_id" : "test",
        "version" : 21,
        "members" : [
            {
                "_id" : 0,
                "host" : "Kusanagi.local:29017",
            },
            {
                "_id" : 1,
                "host" : "Kusanagi.local:29018",
            },
            {
                "_id" : 2,
                "host" : "Kusanagi.local:29019",
            }
        ]
    }
    
    // we'll use members[1], the instance on port 29018
    PRIMARY> conf.members[1].priority = 0
    PRIMARY> conf.members[1].hidden = true
    PRIMARY> conf.version += 1
    PRIMARY> rs.reconfig(conf)
    Tue Apr  1 12:24:34.045 DBClientCursor::init call() failed
    Tue Apr  1 12:24:34.046 trying reconnect to 127.0.0.1:29019
    Tue Apr  1 12:24:34.047 reconnect 127.0.0.1:29019 ok
    reconnected to server after rs command (which is normal)

    Kusanagi.local:29018 is now hidden. It will continue to replicate and vote in elections as usual, but clients connecting to the replica set will never read from it, even if Kusanagi.local:29019 is taken down:

    irb(main):012:0> rs = Mongo::MongoReplicaSetClient.new(["Kusanagi.local:29017", "Kusanagi.local:29018", "Kusanagi.local:29019"])
    => <Mongo::MongoReplicaSetClient:0x3fe06e4fe564 @seeds=[["Kusanagi.local", 29017], ["Kusanagi.local", 29018], ["Kusanagi.local", 29019]] @connected=true>
    irb(main):013:0> rs.primary
    => ["Kusanagi.local", 29017]
    irb(main):014:0> rs.secondaries
    => #<Set: {}>
    # an empty set -- as far as this connection is concerned, there are no secondaries.

    Reporting code would look like this (in Ruby):

    require 'mongo'
    reporting = Mongo::MongoClient.new("Kusanagi.local", "29018", slave_ok: true)
    
    # error checking goes here
    
    reporting['my_application']['users'].aggregate(...)

    Considerations

    Using a hidden member is the simplest way to set up an instance for a dedicated workload such as reporting, however:

    Hidden Members Cannot Be Read From In Case of Emergency

    With 2 ordinary and one hidden member in a replica set, fault tolerance for writing is identical to a regular 3-member set. However, should you lose two nodes, your production application will not be able to gracefully degrade to read-only mode, because your hidden member will not allow replica set client reads. If you just like the simplicity of a hidden member, and cost is not an issue, use a 5-member set (with one member hidden) instead.

    Wrapper Code for Replica Sets Cannot Be Used

    Many teams create application-specific wrappers to add infrastructure knowledge to the clients provided by MongoDB drivers. Since you need to address your reporting instance with a stand-alone connection, you will not be able to reuse this investment, which will make you sad.

    Reporting Instance, Tagged Member

    The more complex, but flexible, method for routing reporting queries to a dedicated node is to use tagging and read preferences.

    As with the hidden member, set one member to priority: 0, but do not set it to be hidden. Instead, assign a tag of use: reporting:

    PRIMARY> conf = rs.config()
    {
        "_id" : "test",
        "version" : 21,
        "members" : [
            {
                "_id" : 0,
                "host" : "Kusanagi.local:29017",
            },
            {
                "_id" : 1,
                "host" : "Kusanagi.local:29018",
            },
            {
                "_id" : 2,
                "host" : "Kusanagi.local:29019",
            }
        ]
    }
    
    // we'll use members[1], the instance on port 29018
    PRIMARY> conf.members[1].priority = 0
    PRIMARY> conf.members[1].tags = { "use": "reporting" }
    PRIMARY> conf.version += 1
    PRIMARY> rs.reconfig(conf)
    [...]

    As before, Kusanagi.local:29018 will never become primary; however, in the case that the other two machines become unreachable, your application will be able to issue reads to the reporting server. It should go without saying that your reporting should be suspended during such an event.

    Your reporting code will look something like this (in Python, this time):

    from pymongo import MongoReplicaSetClient
    from pymongo.read_preferences import ReadPreference
    
    rep_set = MongoReplicaSetClient(
        'Kusanagi.local:29017,Kusanagi.local:29018,Kusanagi.local:29019',
        replicaSet = 'test',
        read_preference = ReadPreference.SECONDARY,
        tag_sets = [{'use':'reporting'}]
    )
    # check to ensure we're not running reporting against the sole remaining secondary
    if rep_set.primary is not None:
        rep_set.my_application.users.aggregate(...)

    The above will only send reporting queries to secondaries tagged use: reporting, and it guards against running at all if there is no available primary. In practice, you should throw exceptions and handle them in your escalation code if you find no primaries! Better still, your monitoring could set runtime-available values so you can branch on, for example, reporting_system.ok().

    Benefits and Considerations

    Using tags and read preferences allows a few degrees of flexibility that are not possible with hidden members.

    Reporting Instances Can Be Easily Added

    Because your connection code is declarative, rather than specific to a particular host, to add more nodes for reporting jobs, just add them and tag them, like so:

    PRIMARY> rs.add({_id:3, host:"Kusanagi.local:29020", priority:0, tags:{'use':'reporting'}})

    Your existing code will make use of the new capacity, and the replica set will continue operating without triggering an election and disconnecting your clients.

    Reporting Instances Can Be Shifted or Dropped

    The reporting tag can be moved, or even removed if you need to offer read bandwidth to other jobs in a pinch. A reconfiguration like this will trigger an election and disconnect all your clients, but this is no worse than any other option. Note: It is an anti-pattern to increase your general capacity by distributing production reads to secondaries. This is only an emergency measure.

    Some Drivers Require Manual Sync

    The Ruby driver (as of 1.9.2), for example, does not refresh its view of the replica set unless the client is initialized explicitly to do so with refresh_mode: :sync. Check your driver documentation.

    Conclusion

    Simple replication setup has been one of my favorite operational aspects of MongoDB since its introduction pre–1.0, when it made MySQL replication look like something out of the stone age. It was a little rough around the edges back then, but has truly come into its own. Whether you use tag sets or hidden members, building a reporting infrastructure atop MongoDB’s replication features simplifies operations, letting you focus on building a great application.

  • Deployment and Monitoring Automation with glu

    Deployment and Monitoring Automation with glu

    glu is a free/open source deployment and monitoring automation platform. glu is a project that was started at LinkedIn mid-2009 to address the exponentially growing needs of deploying the set of applications and services that make up the LinkedIn experience. Although some projects like Chef and Puppet existed at the time, they were mostly good at configuring the infrastructure (creating users, installing java, etc…). glu lives in a higher space: provisioning dynamic applications on an ensemble of machines (change often, real-time failure detection, etc…).

    glu is in the application deployment space

    First, let’s start with some definition: when I say application, I mean a piece of code that usually needs to run, and usually offers some form of api to talk to (which, at a lower level, is a socket listening on a port). Equivalent terminology is service or server. For example, a webapp server is an application. Although glu can also deal with one-off programs (run, do some computation and then stop) or infrastructure (perl, java, etc…), it is not optimized to handle these use cases and other projects are better at this task (Chef/Puppet).

    What is particular about applications in general, is that they tend to change a lot more often than infrastructure. In the age of continuous deployment, it is not uncommon sometimes to have the same application updated and deployed several times a day!

    glu has been designed to handle this use case: deploy applications to an arbitrary large set of nodes:

    • efficiently
    • with minimum/no human interaction
    • securely
    • in a reproducible manner
    glu executes a deployment
    simply click “OK”!

    glu is in the application monitoring space

    Once an application is up and running, many failures can happen from the low level hardware crashing to the application itself misbehaving. This is the nature of it, nothing is perfect, things will crash one way or another. So it is very important to monitor the state of the system in general in order to be able to react appropriately. glu has been designed to give a full view of the set of nodes on which you have deployed applications. When something goes wrong, you can know in a near real-time basis. You can then decide on the proper course of action like restarting the failed application on the node it crashed, or downgrading it to the previous version and redeploying the previous version to all the appropriate nodes. As a side note, you can also build a full monitoring solution on top of glu as explained in this blog post.

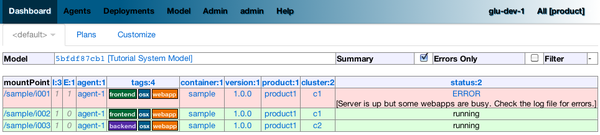
    glu detects failure

    glu is a platform

    It is very hard to build a one-size-fit-all solution. This is why glu has been designed to be a platform in order for you to build the solution that fits your environment and workflow on top of glu:

    • glu offers a REST api so that you can control glu yourself via a simple and documented api. For example, glu is not auto-reactive by design (which means that if something fails, glu will tell you about the failure, but it will not act on its own about it), but using the REST api, it is fairly easy to build a reactive solution on top of it.
    • the console (which is the main UI / REST api), is highly customizable (plugins to change the behavior of some features, css tweaks to let you change the look of it, etc…)
    • glu comes with its own package/distribution builder which lets you customize every component to suit your own needs (as simple as changing the port numbers or as complex as providing your own specializations).
    • glu does not dictate what a deployment mean to you, nor how to model your own system (clusters, groups, etc…), nor how to model your workflow (aka state machine in glu’s terminology). You are in control and you decide.

    glu in practice

    glu is not an academic exercise. glu has been built and successfully deployed at LinkedIn early 2010 prior to being released as open source. glu helps LinkedIn manage the complexity of releasing hundreds of applications/services on a 1000+ node environment (numbers from 2010). Other big names like Orbitz and Outbrain are using glu for their deployment needs.

    Over the years, glu has been refined and enhanced in order to support more use cases but the core and fundamental concepts on which glu was based originally and that I briefly introduced in this post are still what makes glu what it is!

    How to start with glu?

    If you want to take a look at glu, the best is to head to the main documentation page. I would also recommend to download glu and try the tutorial which gives you a feel of what glu is capable.