At a recent Lean project report out to stakeholders, a piece of analysis was presented which showed the quantity of metrics being captured, in various areas, at different organizational levels. IBM’s Watson had been used to generate the chart, and it told an interesting story. But that story needed some translating.
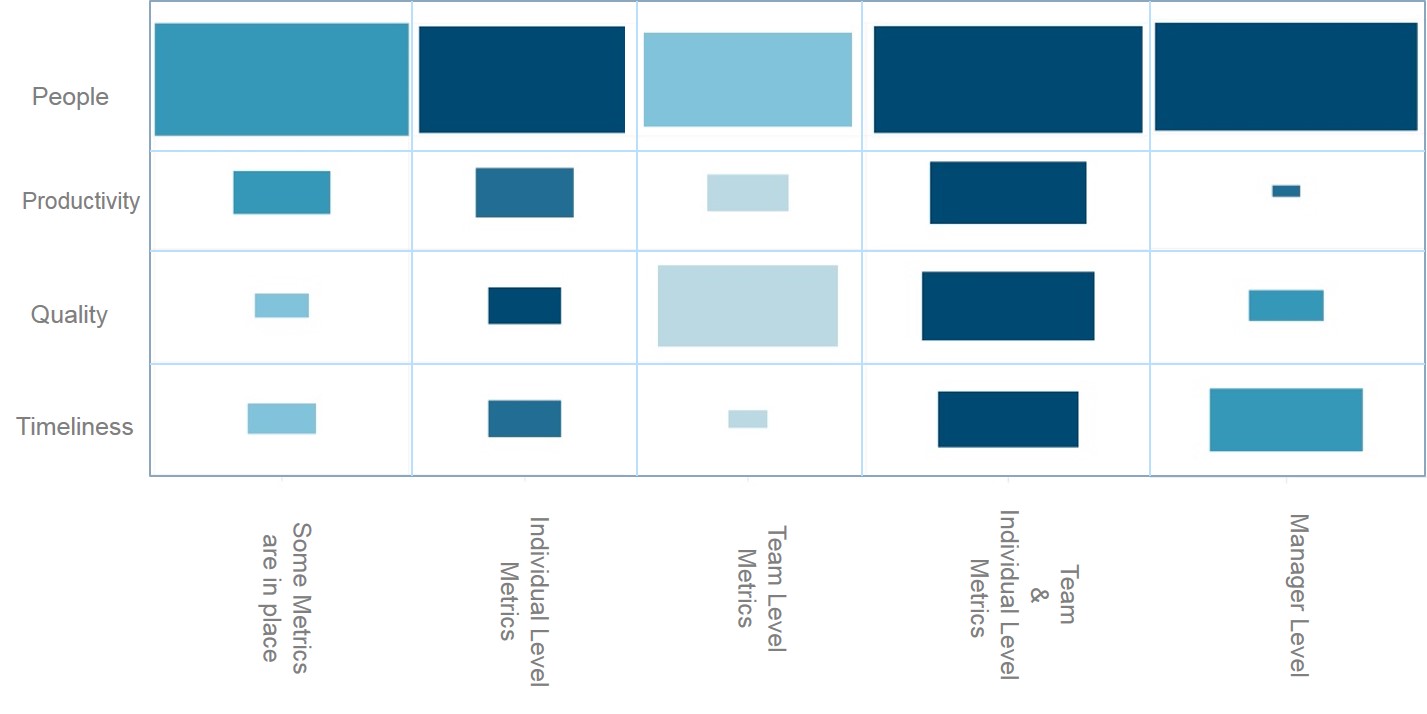
‘Look at all those metrics under ‘Managers”, said one Director, with enthusiasm. ‘Seems like they’re looking at a lot of different performance measures for their people’.
‘Yes,’ said the Lean Coach, ‘but is that a good thing in itself?’
Another Director chimed in, ‘Well, when I look at how few metrics are being captured on timeliness I wonder how anyone knows how they’re doing.’
As an IBMer, and Six Sigma Blackbelt, I’m pre-disposed towards data. Information can be power. But with too much being reported, it can be hard to see the wood from the trees. Performance metrics are intended to allow teams and leaders to improve their performance. For many of those people, reading charts and interpreting data may not be a core skill and it certainly isn’t how the organization wants them to spend their time. So those teams generating masses of performance metrics may not be doing themselves, or their leadership, a service.
The key is to identify the critical few metrics. Ideally leading indicators of performance issues, rather than lagging ones. Leaving aside areas like SLA adherence and budget management to those responsible for governing them, these are the handful of metrics I would suggest a DevOps team needs to watch on a daily basis:
- Number of bug fixes for top 20 systems
- Number of critical issues, average time to close and longest time to close – looking just at the average may mask longer running issues
- WIP: number of projects in each phase of the SDLC
- Customer feedback for top 5 systems – preferably actual user feedback; failing that whatever you can infer from app usage. Top 5 systems may change over time as you launch new functionality or as usage changes according to the business calendar.
- Percentage of projects who deliver 100% of their agreed scope
- Core application availability – actual availability to users, not SLA adherence
What do you think? What do you measure?
