Tag: application performance

  • Unlocking Accountability: How Real-Time App Monitoring Empowers Engineering Teams

    Unlocking Accountability: How Real-Time App Monitoring Empowers Engineering Teams

    In today’s fast-paced software development environment, traditional infrastructure monitoring is no longer sufficient. As engineering teams take on more responsibility for code ownership and software quality, the need for comprehensive real-time application monitoring becomes crucial. This isn’t just an addition to standard infrastructure checks; it’s a fundamental shift toward a more accountable and empowering engineering culture.

    A Case for “Real-Time Application Monitoring?”

    Infrastructure monitoring is ubiquitous, and we’ve gotten really good at monitoring the health of our servers, our containers and our data stores. APM tools have come a long way and give us insights into how pieces of our code perform from a speed and error context.

    At the same time, the business side of the house is monitoring things like traffic, leads, conversions and an important performance metric—sales. However, for most businesses, this monitoring is rarely in real-time, and visibility gaps are created in the spaces between where problems are introduced, discovered and resolved.

    Let’s look at a concrete example using an auction marketplace. Core to this business is the ability for users to place, accept and pay for accepted bids. The business probably looks at these metrics on a daily basis, at best. What if a delivered change to their application broke and removed the ability for users to conduct one of these actions?

    Placing a bid probably has a “normal” volume pattern, and a change could impact this in a positive or negative way. If the volume of bids drops after a deployment or even spikes, what happens? How quickly can that change be reported, seen and acted upon, if necessary? How quickly can they get back to “normal” before a customer reports it or before the rest of the business notices?

    If this business is limited to once-daily monitoring, how quickly can they realistically expect their engineering team to be able to identify and remediate such an issue?

    How valuable would it be to the business if their engineering team could instrument these metrics with their own real-time tooling?

    Key Metrics for Trust and Satisfaction

    Customer trust and satisfaction are critical for any software product. The most obvious indicator of customer satisfaction is churn–the retention rate of your customers. This metric, while influenced by various factors, remains a vital sign of how well we are doing. At Stoplight (acquired by SmartBear in August 2023), we focused on reducing customer bug reports. A spike in these reports prompts an immediate investigation into the root cause. It’s about understanding what changed and how to address it.

    Moreover, new customer acquisition isn’t just about retention; it’s also about word-of-mouth referrals. Satisfied customers often become your best advocates. Thus, keeping an eye on churn rates and incoming bug reports and setting realistic targets for these metrics is crucial. It’s about balancing resource allocation without striving for impractical perfection.

    Net Promoter Score (NPS) scores, although often dreaded by customers, are a critical metric. As engineers, we might dislike them, but they offer a holistic view of user satisfaction. If you’re deploying daily and consistently breaking things, expect your NPS scores to reflect that.

    We can also demonstrate real-time ROI of real-time application monitoring in a security context using login successes and failures. Tracking the volume of these activities in our engineering tools allows us to quickly identify and assess the threat of anomalous behavior. Did the rate of successful logins drop? Did we break something with a deploy (I’ve broken logins before). What if either successes or failures spike? Are we under attack? How can we mitigate it to protect our users?

    Employee Retention and Developer Satisfaction: Essential in an Era of Real-Time Monitoring

    In the realm of software development—particularly with the advent of real-time application monitoring—employee retention, especially of developers, is paramount. Their deep understanding of the nuances of our applications and their ability to respond swiftly to the insights provided by real-time monitoring are invaluable.

    Maintaining a team of satisfied, engaged developers is crucial in this context. It’s not just about reducing turnover; it’s about fostering a culture where the engineers feel invested in the continuous improvement and success of our products. When developers are genuinely satisfied with their work and their environment, it reflects in the quality of their output. They become proactive in identifying and addressing issues, often before they escalate, thanks to the real-time data at their fingertips.

    The shift toward more dynamic monitoring practices has underscored the need for a supportive, collaborative environment. A culture where developers are encouraged to share insights and take initiative leads to a more responsive and adaptable team. This environment not only supports the technical aspects of our work but also enhances the overall morale and commitment of our developers.

    Engineers will seek out organizations that adhere to better practices. Interestingly, when good practices are in place, developers are more open to being on call. They accept responsibility for their code and their peers’ code as a trade-off for the autonomy and value they can deliver through frequent, quality deployments.

    Starting Small: Embracing the Journey of Incremental Improvements

    The journey to adopting best practices in engineering, such as real-time application monitoring, often begins with small yet significant steps. Reflecting on my past experiences, particularly at a shipping marketplace, the path to continuous deployment was transformative. Initially, we had no automated tests, and the challenges were substantial. However, the commitment to deploy continuously led to an evolutionary process in our practices.

    This approach isn’t just about technology; it’s about mindset. In my earlier days, inspired by the continuous deployment practices I observed in financial institutions, I realized the power of incremental changes. We began with what we had, deploying continuously, and with each step, we uncovered new areas for improvement. It was a process of building our capabilities piece by piece–from integrating automated tests to refining our deployment strategies.

    The essence of this journey lies in its continuous nature. Much like the principles of agile and DevOps, it’s a perpetual process of evolution. You don’t reach a finish line and stop; it’s about relentlessly pushing for betterment, identifying gaps, and adapting to new challenges. It’s about creating a culture where continuous improvement is the norm, where each small step contributes to a larger goal.

    Building a Culture of Continuous Improvement and Excellence

    Adopting real-time application monitoring is more than implementing a new set of tools; it’s about fostering a culture of continuous improvement, accountability, and excellence. In my experience, this cultural shift has a profound impact on every aspect of our work. It’s about ingraining a mindset that constantly seeks to exceed our standards with each release.

    Creating this culture involves a holistic approach to our engineering practices. It’s not just about the technical side of things; it’s about enhancing the collaborative and innovative spirit of our teams. It’s important for engineering leaders to do their part to foster an environment where every team member feels empowered to contribute ideas and take initiative. The ROI of this approach can lead to significant improvements in your team’s processes, as well as a deeper sense of ownership and pride in their work.

    Moreover, this culture of continuous improvement often extends well beyond the engineering department. It can influence the entire organization, encouraging departments like sales, marketing, and customer support to adopt similar principles. By doing so, we create a unified approach to product development, customer service, and business growth.

    Conclusion

    Embracing real-time application monitoring is not just about adding another layer to our development practices; it’s about fundamentally shifting our mindset toward a culture of accountability and continuous improvement. By focusing on key metrics, understanding the psychology of developers, and starting small, we can drive significant improvements in both product quality and employee satisfaction. As engineers, we are in a unique position to influence this change, and it is imperative that we lead the charge in adopting these essential practices.

  • Vercel Adds Observability Tools to Web Application Framework

    Vercel Adds Observability Tools to Web Application Framework

    Vercel today announced it has added a suite of observability tools to its platform for building web applications using Next.js, an instance of the open source React framework based on a JavaScript library.

    Vercel CTO Malte Ubl said the Vercel Monitoring tools make it simpler for developers to troubleshoot applications without relying on a DevOps team to surface data. Instead, developers can take advantage of Vercel Monitoring tools to access metrics that track user interface and application programming interface (API) issues, he added.

    That capability is not intended to replace the need for observability tools employed by DevOps teams. Instead, the goal is to provide metrics that are specific to issues that developers encounter as an application is being built or after it has been deployed so they can be addressed.

    Developers can select from pre-made queries provided by Vercel or create their own by defining what metrics they want the Vercel Monitoring tools to track, including bandwidth and web traffic spikes and requests by bots that are indicative of a cyberattack. In total, there are more than 500 potential errors that developers can track. Logs then make it possible to drill down into errors and issues once they are identified to pinpoint the root cause of an issue.

    As more responsibility for applications shifts left toward developers, there’s a clear need for tools that provide more visibility into the applications they develop. Many of the issues that DevOps teams encounter today could have been resolved if developers had been aware of them earlier.

    The Vercel platform employs caching, routing and a React framework to optimize application performance in a way that reduces the dependency on backend infrastructure to optimize application performance. That approach puts less strain on backend infrastructure as more requests are automatically processed using a framework that spans clients and servers. In effect, developers can take advantage of frameworks such as React to treat the underlying IT infrastructure as if it were serverless whenever possible with tools that have a familiar JavaScript construct. The overall goal is to increase developer productivity at a time when many organizations are much more focused on the issue.

    As a result, DevOps teams will need to make some adjustments as more applications capable of providing richer experiences are built and deployed without relying as much on backend infrastructure. That shift has implications for everything from the amount of network bandwidth consumed to the performance of web applications. Frameworks such as Next.js also tend to increase the overall rate at which web applications can be built and deployed.

    One way or another, it’s clear that the way web applications are being built is fundamentally changing. The only issue now is determining to whether DevOps teams are prepared to absorb that level of change across an ever-increasing portfolio of applications that still need to be deployed, secured, updated and optimized.

  • 3 Steps to Jumpstart Your App Modernization Journey

    3 Steps to Jumpstart Your App Modernization Journey

    Like organizing your garage, modernizing your applications can seem daunting before you start, but you know it will pay off once done. So, instead of thinking about this project as a technical challenge, let’s look at it in the wider context of the business. Just as getting rid of old junk in your garage frees up the space you need for things you actually use, modernizing your apps helps your business run more efficiently and scale more easily. Based on my experience with many application modernization projects, here’s how developers can best approach app modernization, including what you’ll need from your team and technology, six key ways to tackle the task and how to prioritize.

    Start With a Business Assessment

    Before you can make any changes to your applications themselves, you need to lay out a plan based on your company’s needs. That means assessing every application in your portfolio, not just as individual properties but in the way they interconnect.

    Like most developers and engineers, when you have a technical background, it’s tempting to build a strategy around the most exciting technical opportunities. But the purpose of all the applications your company uses is to enhance the business. For example, your organization is likely considering an app modernization initiative to better serve customers and clients; to increase revenue or cut costs.

    That means when you approach modernization from a business perspective, you should prioritize apps based on business value. Large modernization projects can get complicated, so you won’t necessarily be able to complete this process for every app.

    When it comes to large-scale, complex applications, the effort required to modernize every piece is significant. So, it’s important to decide what applications are of the highest value and plan your modernization efforts starting there.

    There are several business-focused questions to consider, such as:

    • What are the business’ needs now and in the future?
    • Which problems are we trying to solve as an organization and as a department?
    • What capabilities does the business need to add in order to grow?
    • What does the business need to do to better support customers?

    Smaller organizations may be able to modernize every app and component. But if you’re in a large business or an enterprise, you will have to choose the apps and components that are most critical to the business goals. Of course, if you’re successful with the first crop of applications, it’s more likely you’ll get the go-ahead to move on to other apps and components.

    It’s important to stress how important this kind of assessment and planning process is. You need to get that business buy-in for that ultimate alignment and for delivering the most value for your business in the shortest amount of time.

    Choose Your Application Modernization Program

    Different applications require different modernization approaches, some of which are more labor-intensive than others. Here are six methods (the six Rs) used to modernize an app and how to assess which one is right in each case:

    • Retain: If an application is working as well as it possibly can in its current environment, leave it alone. This is rare, but it does happen.
    • Rehost: In the case of apps that already work well, you’re more likely to want to move them to a new platform than leave them completely untouched.
    • Retire: If an app no longer serves a useful purpose, is outdated or runs on technology that no longer exists, retire it.
    • Repurchase: Switching apps from perpetual licenses to software-as-a-service (SaaS), subscription-style models means less hardware maintenance, easier access to updates and cloud storage for all users.
    • Replatform: Transfer an app from a hardware-based option to the cloud, with a few small changes.
    • Refactor: The most work-intensive option—and the most interesting! This is the coding equivalent of a movie remake, in which you update the code to improve performance, availability, security and more.

    Follow App Modernization Best Practices

    All right. You’ve got leadership buy-in and you’ve categorized all your business’ apps according to the six Rs we mentioned above. Now, the real work begins. There are app modernization best practices to follow as you continue on this journey. Most importantly, remember that the effectiveness of your modernization efforts comes down to two key components: Your team and your tech. Here’s what you need from both for a successful mission.

    Deploy the Most Advanced Technology

    The underlying purpose of application modernization is to bring your apps up-to-date with the latest cloud technology. For the best results, you need to use the best available tech. There are a few elements of modern cloud technology you should consider. Serverless infrastructure is one. With serverless, you can make large-scale changes in real-time without having to maintain servers.

    Data management is another area where you should employ cutting-edge tech. You can use purpose-built databases that best suit different types of data for faster and more efficient processes.

    Autoscaling is also a key benefit of moving to the cloud. Be sure to factor in the need to scale from the start of your modernization project to avoid bottlenecks further down the line.

    Hire an Agile Team

    The most advanced tools in the world are useless if the people using them aren’t sufficiently trained or skilled. When hiring a team, look for agility. Application modernization processes are a lot of work. You need a team that moves quickly in order to hit your deadlines.

    Culture and responsibility, as well as ownership are also important. A demanding work environment requires open communication and people who will take responsibility for their part in the system. Consistency is another crucial factor. Involve the people who will be responsible for managing the apps from the start of the modernization process. This makes it easier for them to continue the work once the app is ready.

    Summary

    Getting the most out of your application modernization project requires the right tools, personnel and services. And while taking your first steps into the cloud can seem intimidating, by following tried-and-true best practices, you can stay on the right path toward a big payoff in the cloud.

  • IBM Automation Insights: Improving Observability and App Performance

    IBM Automation Insights: Improving Observability and App Performance

    Observability offers deep visibility into the internal state of complex systems in order to quickly identify and troubleshoot performance issues to keep up with customer expectations and business requirements. Observability enables better application performance monitoring (APM). So, how can DevOps teams gain full observability into modern applications? 

    On Feb. 23, experts from IBM and GitLab will come together at the IBM Automation Insights virtual event to discuss how to effectively observe, manage and maintain applications across platforms and how to improve application performance.

    The virtual event has been curated to create interactive sessions, led by DevOps experts who will deep dive on the latest innovations, conduct demos and share approaches that tackle challenges.

    IBM Automation Insights features a speaker lineup of distinguished engineers, IT leaders and executives, including:

    • Cosmo Schillaci, DevOps business leader at IBM
    • Jennifer Velasquez, Americas DevOps leader at IBM
    • Laurel Dickson-Bull, product manager at IBM
    • Kurt Dusek, senior solutions architect at GitLab
    • Jamie Coleman, software engineer at IBM

    Attendees will learn how Instana and GitLab can enable DevOps teams to accelerate CI/CD pipelines and how to build applications easily using cloud-native Java applications and microservices locally, with containers, and for OpenShift/Kubernetes.

    There will be a cross-platform panel discussion in which attendees will get a chance to interact with the speakers, ask questions on any of the strategies presented and discuss several topics, including cybersecurity, optimization for observability, vulnerability tool proliferation and more.

    For more information and to register, please visit the IBM Automation Insights website.

  • Best of 2021 – Best Practices for Application Performance Testing

    As we close out 2021, we at staging-devopsy.kinsta.cloud wanted to highlight the most popular articles of the year. Following is the eighteenth in our series of the Best of 2021.

    When done properly, software application performance testing determines if a system meets certain acceptable criteria for both responsiveness and robustness. Before you jump in to testing, though, there are some best practices to remember.

    Start by defining test plans that include load testing, stress testing, endurance testing, availability testing, configuration testing and isolation testing. Align these plans with precise metrics in terms of goals, acceptable measurements, thresholds and a plan to overcome performance issues for the best results. Make sure you can triage performance issues in your testing environment; you should analyze issues impacting application performance by examining system functionality under load, not just the indicators of poor performance on the load testing tool side. Leveraging application performance management (APM) tools, which simulate production environments, provide much deeper insights into application functionality, as well as into overall performance under stress or load.

    10 Performance Testing Best Practices

    1. Test Early and Often

    Performance testing is often an afterthought, performed in haste late in the development cycle, or only in response to user complaints. Instead, you should be proactive. Take an agile approach that uses iterative testing throughout the entire development life cycle. Specifically, provide the ability to run performance “unit” testing as part of the development process – and then repeat the same tests on a larger scale in later stages of application readiness. Use performance testing tools as part of an automated pass/fail pipeline, where code that passes moves through the pipeline and code that fails is returned to a developer.

    2. Consider Users, Not Just Servers

    Performance tests often focus solely on the performance of servers and clusters running software. Don’t forget that people use software, and performance tests also should measure the human element. For instance, measuring the performance of clustered servers may return satisfactory results, but users on a single, troubled server may experience an unsatisfactory result. Tests should take user experience into account, and user interface timing should also be captured along with server metrics.

    3. Understand Performance Test Definitions

    It’s crucial to have a common definition for the types of performance tests that should be executed against your applications, such as:

    • Single User Tests. Testing with one active user yields the best possible performance, and response times can be used for baseline measurements.
    • Load Tests. Understand the behavior of the system under average load, including the expected number of concurrent users performing a specific number of transactions within an average hour.
    • Peak Load Tests. Understand system behavior under the heaviest anticipated usage for concurrent number of users and transaction rates.
    • Endurance (Soak) Tests. Determine the longevity of components, and whether the system can sustain average to peak load over a predefined duration. Monitor memory utilization to detect potential leaks.
    • Stress Tests. Understand the upper limits of capacity within the system by purposely pushing it to its breaking point.
    • High Availability Tests. Validate how the system behaves during a failure condition while under load. There are many operational use cases that should be included, such as seamless failover of network equipment or rolling server restarts.

    5. Build a Complete Performance Model

    Measuring your application’s performance includes understanding your system’s capacity. This includes planning what the steady state will be in terms of concurrent users, simultaneous requests, average user sessions and server utilization during peak periods of the day. Additionally, you should define performance goals, such as maximum response times, system scalability, user satisfaction scores, acceptable performance metrics and maximum capacity for all of these metrics.

    6. Define Baselines for Important System Functions

    In most cases, QA systems performance don’t match production systems performance. Having baseline performance measurements for each system can give you reasonable goals for each testing environment. These baselines provide an important starting point for response time goals, especially if there are no previous metrics, without having to guess or base them on the performance of other applications.

    7. Perform Modular and System Performance Tests

    Modern applications are incorporate many individual, complex systems, including databases, application servers, web services, legacy systems and so on. All of these systems need to be performance tested individually and together. This helps expose weaknesses, highlight interdependencies and understand which systems you should isolate for further performance tuning.

    8. Measure Averages, but Include Outliers

    When testing performance, you need to know average response time, but this measurement can be misleading by itself. Be sure to include other metrics, such as 90th percentile or standard deviation, to get a better view of system performance.

    KPIs can be measured by looking at average and standard deviations. For example, set a performance goal for the average response time plus one standard deviation beyond it (see Figure 1). In many systems, this improved measurement affects the pass/fail criteria of the test, matching the actual user experience more accurately. Transactions with a high standard deviation can be tuned to reduce system response time variability and improve overall user experience.

    application

    9. Consistently Report and Analyze the Results

    Performance test design and execution are important, but test reports are, too. Reports communicate the results of your application’s behavior to everyone in your organization, especially project owners and developers. Analyzing and reporting results consistently also helps to determine future updates and fixes. Remember to consider your audience and tailor reports to each audience. Reports for developers should differ from reports sent to project owners, managers, corporate executives and even customers, if applicable.

    10. Triage Performance Issues

    Providing the results of performance tests is fine, but those results, especially when they demonstrate failure, are not enough. The next step should be to triage the code/application and system performance, and involve all parties: developers, testers and operations personnel involved. Application Monitoring Tools can provide clarity regarding the effectiveness of triage.

    Additionally, remember to avoid throwing your software “over the wall” to a separate testing organization, and ensure your QA platforms match production as closely as possible. As with any profession, your efforts are only as good as the tools you use. Be sure to include a mix of manual and automated testing across all systems.


  • Sentry Extends Application Performance Monitoring Tool

    Sentry Extends Application Performance Monitoring Tool

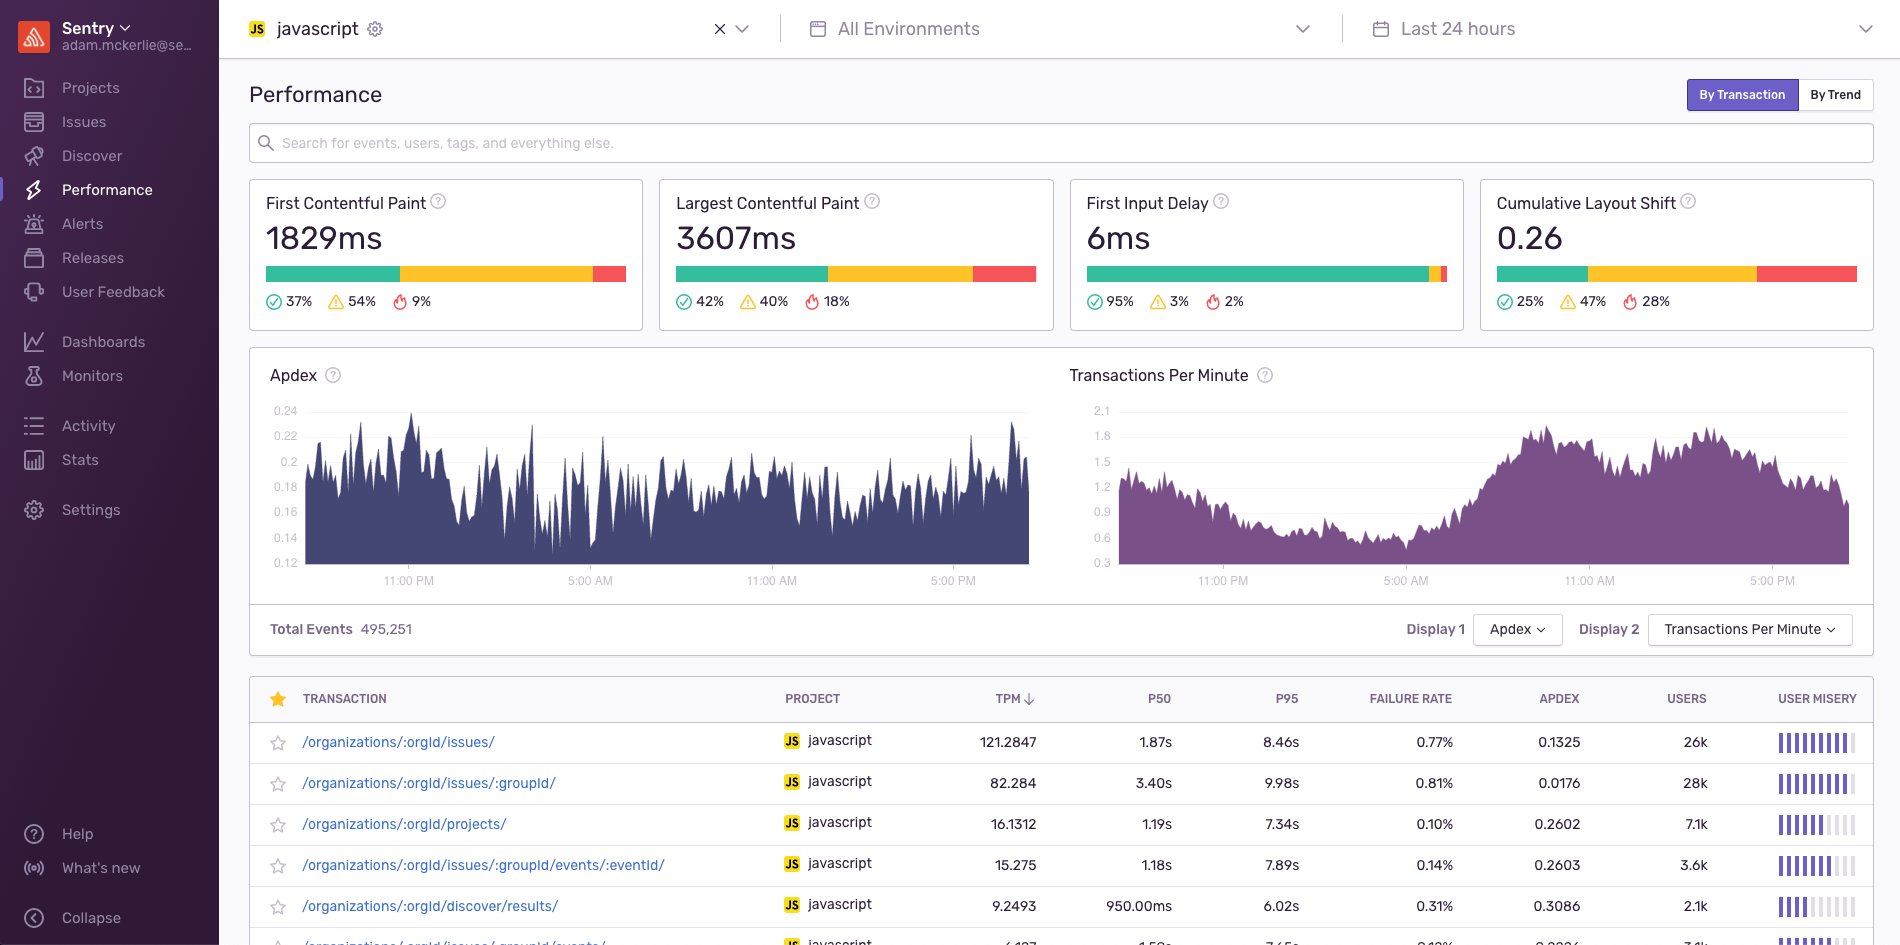
    Sentry this week announced it has added support for applications that employ serverless computing frameworks as well as the Google Web Vitals service to its application monitoring tool.

    Company CEO Milin Desai said incorporating Google Web Vitals metrics into Sentry Performance Monitoring will become crucial as Google makes good on a pledge to rank websites and applications on its search engine based on the metrics it collects via this service.

    Google Web Vitals determines how fast an application is by monitoring how fast a site presents user interface objects. By coupling Web Vitals with transaction data gathered by Sentry, it becomes possible for developers to correlate how a transaction may be adversely impacting the user experience. That data then can be employed to adjust what application programming interfaces (APIs) should be called within an application, Desai said.

    At the same time, he noted a larger percentage of developers are starting to employ serverless computing frameworks within the front end of their applications. The Sentry platform now monitors serverless computing frameworks that are employed within a PHP, Node and Ruby-based application. Most of those frameworks are being used to trigger a specific action when some type of event occurs within an application, said Desai.

    Finally, Sentry has also added a Trends view that enables developers to see the most improved and most regressed transactions that have occurred over time. That capability enables developers to more easily determine when changes to the overall IT environment are adversely impacting their applications. Armed with that data, it then becomes easier to identify what changes were made at that time.

    In general, Desai said there is not enough focus on enabling observability for application developers versus IT operations teams. Sentry Performance Monitoring is designed to enable developers to correlate specific events occurring within their code to actual end user experiences by adding five lines of code to their applications.

    Observability tools for developers will not obviate the need for observability tools for IT operations teams, but Desai noted as far as visibility into applications is concerned, most developers today are flying blind. Observability is supposed to be a core tenet of any DevOps practice. However, the level of observability actually being achieved tends to vary widely among IT organizations.

    Of course, the best place to solve any issue is going to be within the application code, whenever possible. Many developers could eliminate performance issues long before many IT operations teams realize they exist if they had more visibility into how code was executing. That issue will become all the more pressing as IT organizations deploy applications based on microservices that have many dependencies.

    The challenge IT organizations face now is determining not only which observability platforms to employ, but also what level of visibility is required for all the different roles and personas that make up that team.