
Tag: CodeStream

  • New Relic Bets on AI to Advance Observability

    New Relic Bets on AI to Advance Observability

    New Relic is preparing to extend the capabilities of its observability platform by making use of both additional machine learning algorithms and the ChatGPT generative artificial intelligence (AI) platform.

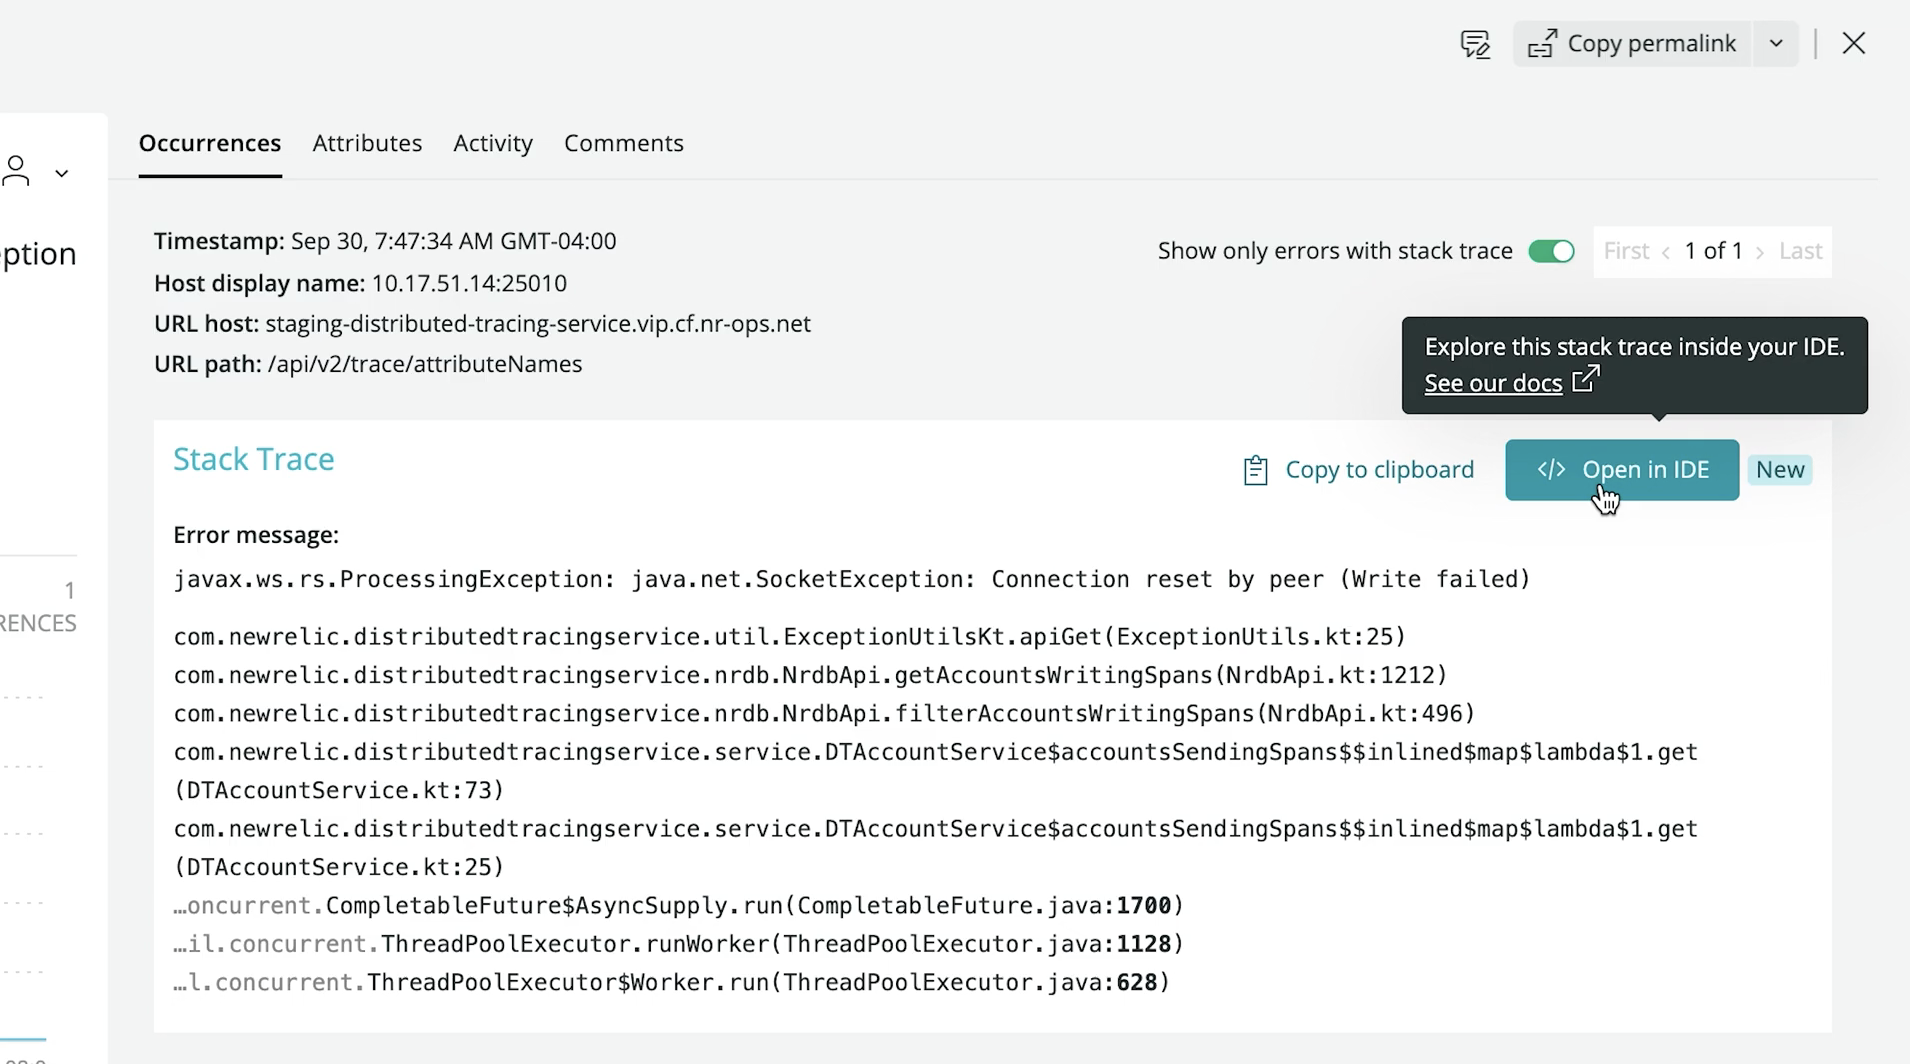
    Peter Pezaris, senior vice president for strategy and experience at New Relic, said during an interview on an episode of TechStrong TV that a prototype of an AI model created using machine learning algorithms will automatically notify developers when code in a production environment is not performing well—right within their integrated development environment (IDE). The notification will then take developers to the precise line of code identified as the root cause of the issue, he said.

    DevOps teams will need to add two lines of code to applications running in production environments to take advantage of this capability. New Relic also plans to use a similar approach to integrate with generative AI platforms such as ChatGPT to create suggestions for fixing code, he added. ChatGPT now makes it possible to create entire programs in ways that output HTML and JavaScript code, so DevOps teams should expect to be able to use the platform to create natural language queries that invoke the proprietary query language New Relic makes available for its observability platform, he noted. Conversely, ChatGPT will make it possible to explain how a piece of code functions in plain language, Pezaris added.

    Previously, New Relic employed a similar approach to integrate its observability platform with machine learning operations (MLOps) platforms used to build and deploy AI models. This was part of a larger effort to integrate MLOps and DevOps workflows, added Pezaris.

    These AI extensions to the New Relic platform are part of a larger effort to extend the reach of the New Relic One observability platform further left toward developers. Most recently, New Relic added a free CodeStream module to its observability platform to give developers access to metrics and telemetry data that will enable them to write higher-quality code faster.

    That approach eliminates the need to wait for IT operations teams to surface issues that usually don’t manifest until long after the code in question was originally developed. The overall goal is to provide development teams with frictionless access to observability data at every stage of the software development life cycle to reduce mean-time-to-detection (MTTD) and mean-time-to-resolution (MTTR) of issues.

    Organizations should also be able to reduce technical debt faster by making it easier to identify issues that, for example, adversely impact application performance.

    In general, most organizations are still in the early stages of achieving full-stack observability. A recent New Relic survey found only 27% of respondents have achieved full-stack observability, and only 5% claimed they have a mature observability practice in place. A third (33%) of respondents also said they still primarily detect outages manually or based on complaints, the survey found.

    On the plus side, the survey also found nearly three-quarters of respondents said C-suite executives in their organization are advocates of observability, and more than three-quarters of respondents (78%) saw observability as a key enabler for achieving core business goals. However, more than half (52%) of respondents said they experienced high-business-impact outages once per week or more and 29% said they take more than an hour to resolve those outages.

    The hope is, of course, that by augmenting DevOps teams with AI capabilities, the number of those outages will be dramatically reduced in the months and years ahead.

  • New Relic Acquires CodeStream to Close Observability Gap

    New Relic Acquires CodeStream to Close Observability Gap

    New Relic today revealed it has acquired CodeStream as part of an effort to make observability data more accessible to developers.

    Buddy Brewer, group vice president (GVP) and GM at New Relic said New Relic CodeStream makes application telemetry data collected via the New Relic One platform directly available within an integrated development environment (IDE), now including Microsoft VS Code. In addition, there are also integrations with Microsoft Teams and the GitHub repository.

    The goal is to close an observability gap that exists today between developers and IT operations teams that stems from a lack of developer visibility into production environments, he noted.

    Finally, New Relic is also announcing a core user pricing option for New Relic One that is aimed at developers. Starting at $49 per month, developers gain access to a core set of capabilities such as CodeStream integrations, errors inbox, logs, GraphQL application programming interfaces (APIs) and the ability to build and run custom applications on New Relic One.

    Peter Pezaris, CodeStream co-founder and CEO, now GVP and GM, strategy and developer tools at New Relic, said becoming part of New Relic will make it easier to bridge the divide that exists between most developers and IT operations teams by making it much easier for developers to see how their code is actually executing in a production environment. That capability will eliminate scenarios where code that runs just fine on a laptop executes poorly in a production environment, he added.

    Developers can also add inline code comments, trigger pull requests, request feedback and track issues directly from their IDE via integrations with a wide range of developer and communication tools. Developers also can switch from New Relic One into an IDE in a single click to navigate, triage and remediate production errors in the context of the code they wrote.

    New Relic is initially making New Relic CodeStream available for free—no credit card required—during a preview period that extends to January 12, 2022. Afterward, some of the more advanced features will require a paid user license once free tier limits are reached. Similarly, IT teams can also sign up for a free New Relic One account without entering a credit card to instrument their applications.

    As the responsibility for managing applications in production environments continues to shift left, Pezaris said it’s critical to give developers the tools they need to optimize code in a production environment.

    It’s not quite clear exactly how much responsibility for applications is shifting left toward developers; it differs from one organization to the next. Many are simply trying to reduce as much friction as possible between developers and their IT operations teams by providing more ‘connective tissue’ from New Relic that IT teams would have to otherwise write themselves, noted Pezaris.

    It may take some time to bridge the observability gap between developers and IT operations teams. Most IT operations teams are still coming to terms with what observability provides that existing IT monitoring tools don’t. Monitoring, at its core, focuses on predefined metrics to identify when a specific platform or application is performing within expectations. The metrics tracked generally focus on, for example, resource utilization. In contrast, observability combines metrics, logs and traces—a specialized form of logging—to instrument applications in a way that makes it simpler to troubleshot issues without having to rely solely on a limited set of metrics that have been pre-defined.

    In theory, at least, that level of observability should ultimately reduce the total number of incidents an IT operations team needs to fix by identifying issues long before they become an actual disruption.