Tag: DevOps research

  • The State of Digital Innovation, One Year Into the Pandemic

    The State of Digital Innovation, One Year Into the Pandemic

    It’s obvious COVID–19 accelerated digital reliance for many companies. And it’s no surprise that, according to a recent study, 89% of tech leaders believe digital experiences are critical to addressing new COVID–19 challenges. In this race toward 100% digital business, agile innovation is the new elixir of life — without it, a company may face an early retirement.

    Kong just released their 2021 Digital Innovation Benchmark, which summarizes the tech priorities of 400 IT leaders. The findings stress the importance of rapid digital innovation, open source, microservices architectures, and high quality practices for scaling today’s application ecosystems. Here are the key points technology leaders need to know to remain competitive.

    Innovate or Dissipate

    The urgency to innovate is increasing. According to the survey, 84% of respondents predict a business will go under within six years if they lag behind in digital innovation. Fifty one percent of tech leaders believe their business can only survive three years.

    If digital transformation happens too slowly, it can pose an existential threat. But there are many factors that can hinder faster digital innovation; the complexity of using multiple tech stacks, reliance on legacy IT and lack of automation. Not only are there internal woes, but external danger — 62% of respondents worry about failing to keep up with competitors who innovate faster.

    It seems the urgency has increased over the last year. In last year’s report, just 37% reported they’d be out of business in three years if they didn’t keep pace with digital innovation. That figure rose to a whopping 51% in 2021.

    COVID Amplifies Digital Drive

    Virtually no one is anticipating a decreased IT budget in light of COVID–19. On the contrary, long-term digital transformation efforts are well on target at the majority of institutions, and 75% expect to see an increase in IT/developer budgets over the next 12 months.

    Interestingly, when it comes to securing the digital-only economy, European tech may have a head start. Only 40% of European tech companies have increased their security focus, compared to 51% in the U.S. This could be due to previous investment in security and stricter regulation in European countries.

    In terms of cloud adoption, 40% of tech leaders feel COVID–19 has accelerated their move to the cloud. Nearly 40% say the pandemic has encouraged the use of microservices and cloud native architecture.

    Quality Outweighs Speed

    When gauging what matters most to tech leaders, “improving operational efficiency” is still a top priority. However, this year’s report saw a spike in respondents saying application performance and reliability, as well as application security, were moving up the priority list. Though 3 in 5 (62%) respondents said they are “extremely concerned” about competition from speedier rivals, application stability outweighs the collective drive to innovate.

    These trends are likely indicative of a notable rise in cybercrime. As I’ve covered previously, to respond to emerging threats, DevSecOps practices and new security tooling are shifting left within the development cycle, automating things like vulnerability detection. Simultaneously, roles to increase application integrity, like site reliability engineers, are in high demand.

    New Technologies and Open-Source Thrills

    As mentioned earlier, IT budgets are increasing across the board. When adopting new technologies, companies place the highest emphasis on the tech that increases efficiency. A surge in automation follows a low-code movement gaining steam. Companies consider the following key factors when introducing new tech: reducing deployment risk, increasing collaboration, and increasing development. Ninety five percent of US respondents also listed the “need to integrate with existing tools” as necessary — no surprise in today’s API-driven development landscape.

    Ninety one percent of organizations use open-source software in 2021 — this is up from 82.5% in 2020. Across the board, open-source is intrinsically embedded into most software projects. We see open-source especially used in open databases, infrastructure automation, API design and testing, CI/CD tools, Docker containers, Kubernetes and service mesh. Arguably, modern DevOps would not be possible without such open source initiatives.

    Bring it on, Microservices

    If you haven’t heard of microservices yet, we would be worried. An impressive 87% of survey participants believe that microservices-based applications are the future.

    While that sounds substantial, a path toward 100% distributed microservices architecture has not been mapped within most organizations. In 2021, only 33% of companies have transitioned entirely to a distributed architecture, whereas most (53.5%) adopt a hybrid mix of microservice and monolithic styles.

    “This is strong evidence that microservices have quickly become the de-facto approach for modern application architectures that enable digital innovation,” the report said. Though more development is required, a microservices-centric future seems obvious.

    Within organizations that have already adopted a microservices approach, the average number of microservices in production is 102. And those are primarily to increase security. Ironically, the report also found maintaining security to be the top challenge of deploying a microservices system. Other drivers for microservices adoption include integrating new tech, increasing development speed and boosting flexibility.

    Kubernetes Becomes Ubiquitous

    Kubernetes has clearly emerged as the industry standard orchestration platform. Eighty six percentof all respondents report they now use Kubernetes in production, or plan to within 12 months. This is a massive jump from VMWare’s 2020 report, which put Kubernetes use at 48%.

    However, there are challenges to implementing Kubernetes in practice. Companies cite security, complexity, performance and monitoring as top setbacks when introducing Kubernetes. To say Kubernetes has a steep learning curve may be an understatement, as abstraction layers are introduced to rectify a widening knowledge gap.

    Service Mesh Prickly for Early Installs

    Interestingly, API gateway adoption and container usage, according to the survey, are both 38%. Yet, service mesh adoption is only at 20%. This could underscore the fact that service mesh is still an emerging concept — service mesh experts say the tech isn’t ready for widespread adoption. Or, it could reflect that production use cases are rare (primarily for supporting vast microservices deployments).

    Early service mesh adopters see increased service connectivity and discovery as a top benefit of the technology. This seems logical, as service mesh aims to be a common networking framework. Other common benefits include cost reduction, meeting compliances, zero-trust security in networking and traffic observability.

    Naturally, service mesh isn’t without its thorns. Complexity in deployment and ensuring performance at scale top the list of challenges faced when deploying service mesh, slowing its adoption.

    Hybrid Multicloud

    The current status of multicloud deployment sees a mix of on-premises and multiple cloud providers, with 41% of organizations using multicloud deployment strategies. While cloud adoption rates are increasing, 31% of organizations are still running on-premises servers. The saturation of cloud tooling, and the market validity of Azure and Google Cloud Platform to take on AWS, have influenced a multicloud environment. Cloud expertise is now a hot commodity to navigate multicloud modalities — so much so that some companies have introduced a new role, The Other CFO, or Cloud Economist, to balance the cloud checkbook.

    Riding out the Virtual Wave

    The pandemic has accelerated the move toward digital experiences, and in turn, quickened the pace of enterprise technological evolution across the board. As COVID–19 effects continue, there’s no indication the virtual wave will recede anytime soon.

    To summarize the current state of digital innovation:

    • Rising digital tide: The pace to innovate is rising, and those left below the new-digital-normal water line will drown.
    • IT spend is up: Most companies have increased IT budgets moderately to support new digital norms.
    • Needs for adoption: Desires for automation, speed, security and integration rank high for adopting new tech.
    • Microservices on fire: The report describes “accelerated mainstreaming of microservices.” Microservices, and the tech that supports them, are clearly the future.
    • Kubernetes everywhere: As Kubernetes rises to ubiquity, last-mile efforts center on security and developer usability.
    • Bullish on service mesh: Service mesh sees early production uses, which will likely signal more growth in this area.

    There’s nothing unexpected in these findings; instead, they affirm what most of us already know — digital innovation is going full throttle. Check out the entire 2021 Digital Innovation Benchmark here.

  • How the World Measures DevOps Quality

    How the World Measures DevOps Quality

    With continuous everything, knowing whether each new release will ultimately enhance or undermine the overall user experience is essential. Yet, most of today’s go/no-go decision still hinge upon quality metrics designed for a different era.

    Every other aspect of application delivery has been scrutinized and optimized for DevOps. Why not re-examine quality metrics as well?

    Are classic metrics like number of automated tests, test case coverage and pass/fail rate important in the context of DevOps, where the goal is immediate insight into whether a given release candidate has an acceptable level of risk? What other metrics can help us ensure the steady stream of updates are truly fit for production?

    To provide the DevOps community an objective perspective on what quality metrics are most important for DevOps success, Tricentis commissioned Forrester to research the topic. The results are published in the 55-page report, Forrester Research on DevOps Quality Metrics that Matter: 75 Common Metrics—Ranked by Industry Experts. The report takes a deep dive into the global findings, complete with heat maps, quadrant mappings and some fun lists such as “Most Overrated,” “Hidden Gems” and “Top DevOps Differentiators.”

    One of the most common questions we received after publishing the report was: “How do the results vary across regions?” In response, we performed some additional regional analysis—and I’d like to share those results here.

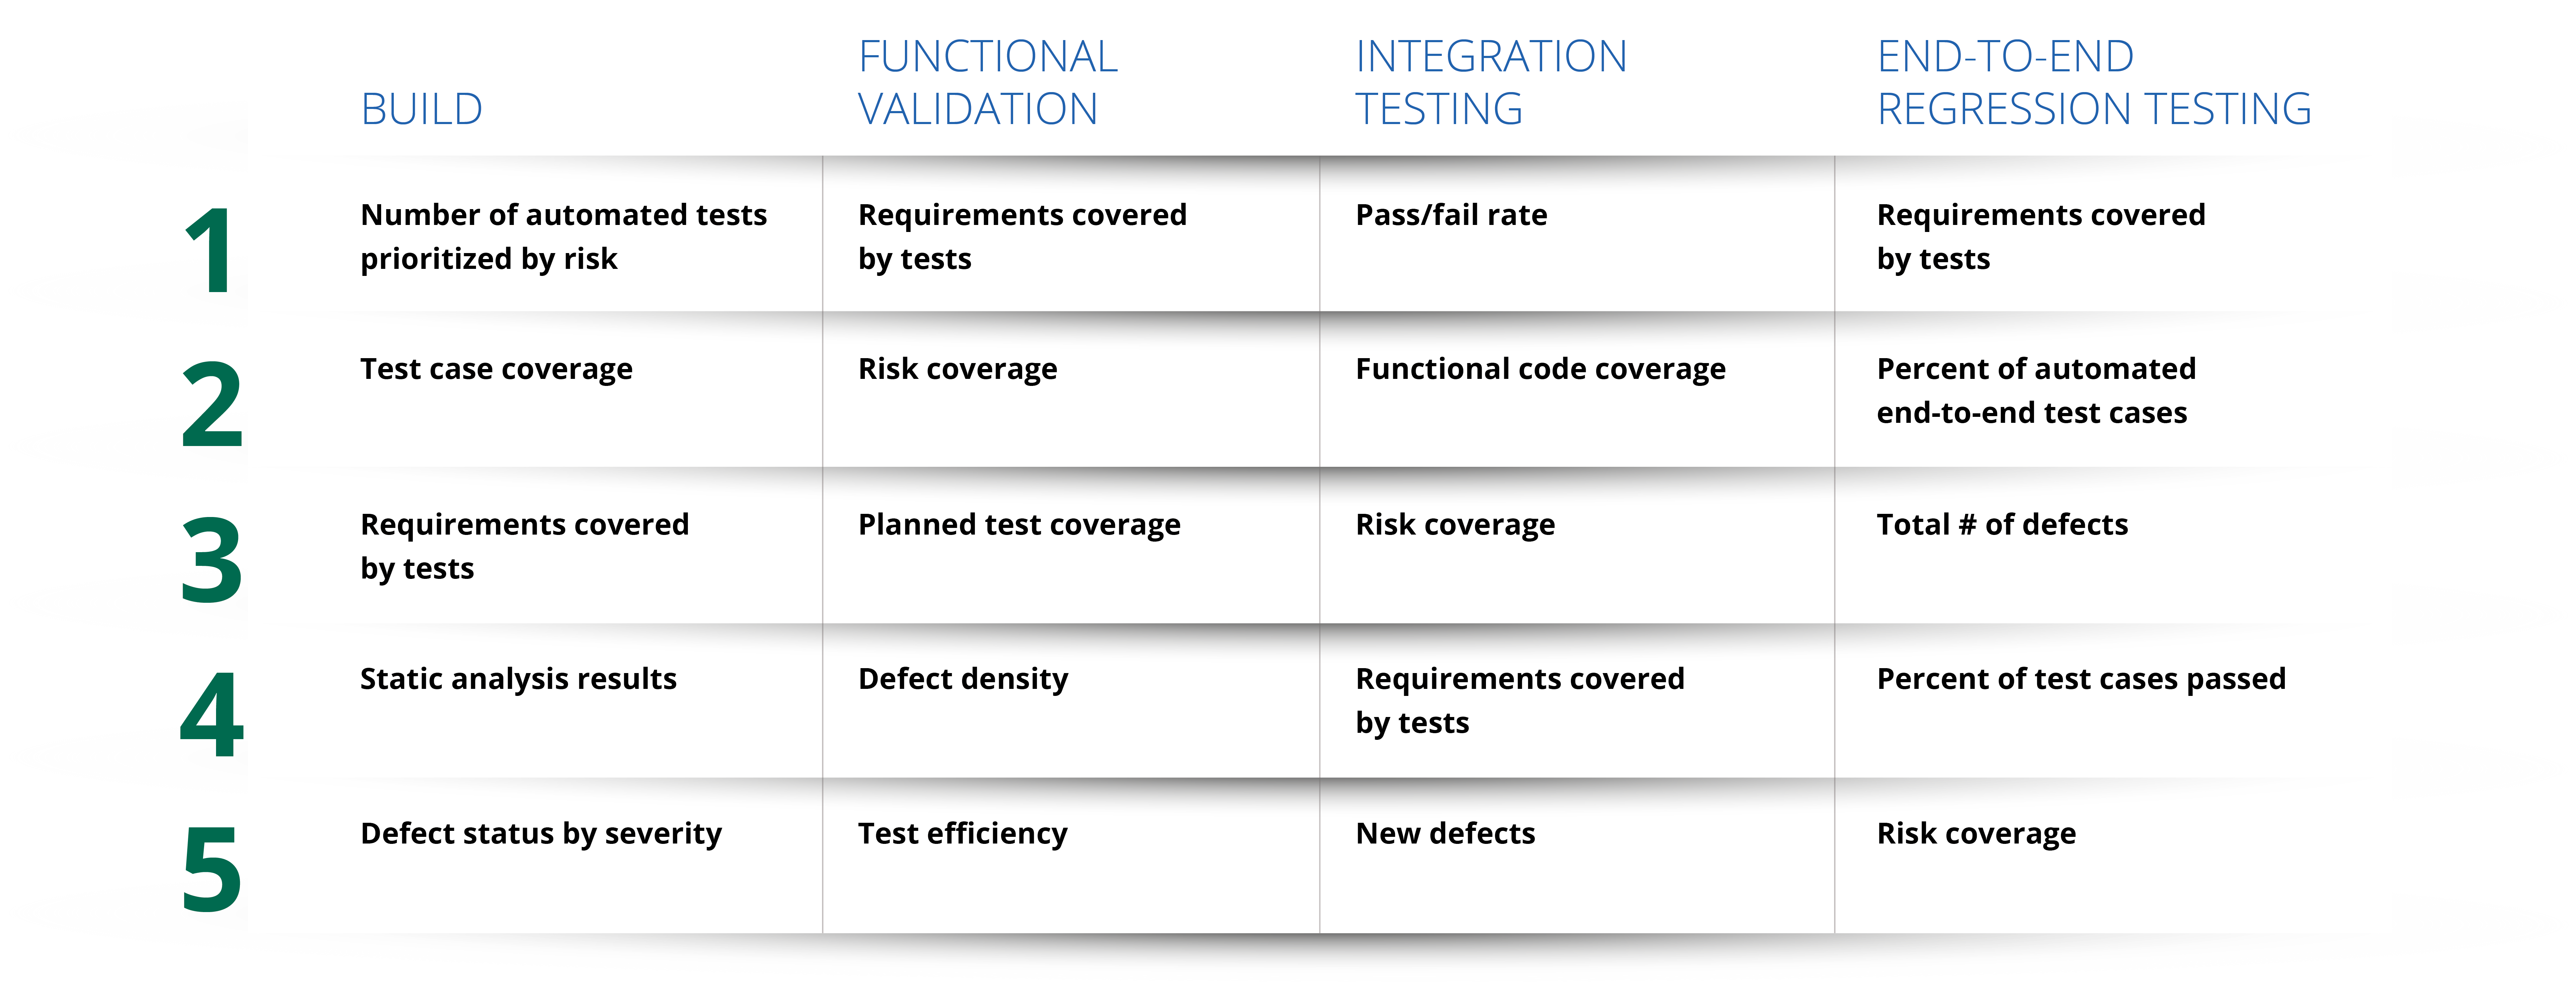
    To start, let’s take a look at the global top 20. The following metrics were ranked as the most valuable by the DevOps experts who measure them (across all regions).

    Europe DevOps Quality Metrics Trends

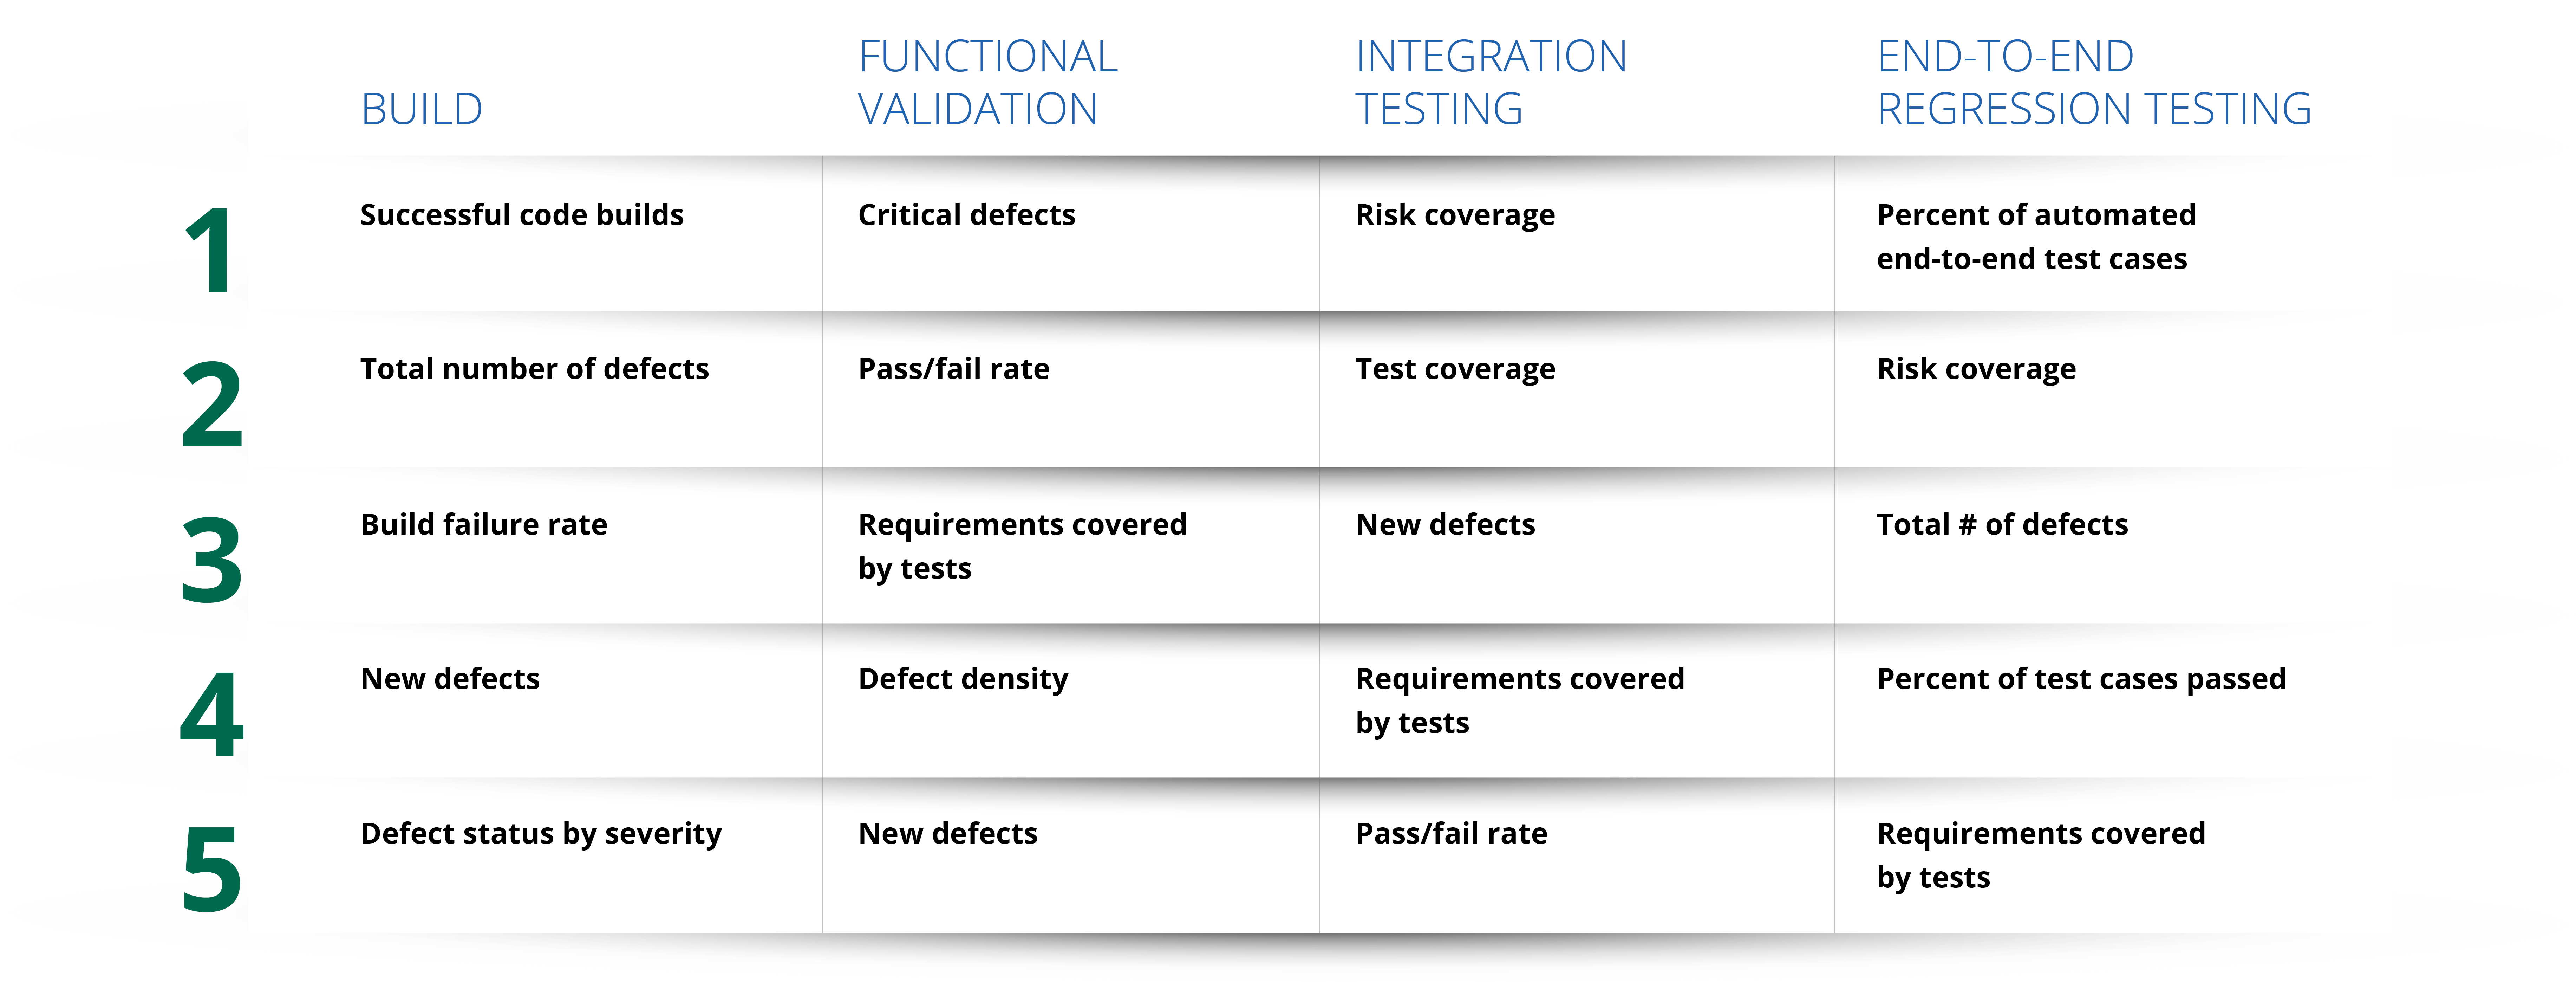
    Looking specifically at Europe, the top 20 changes as follows:

    Interesting trends in this region:

    • There is a greater commitment to measuring quality metrics. European respondents reported a higher level of DevOps quality metrics measurement across the board. For almost all metrics, the usage rate was at least 6% higher than the global average. For metrics related to time, coverage, risk, effectiveness and efficiency, the usage rate was over 14% higher. This speaks to European organizations’ commitment to scrutinizing and continuously optimizing their quality processes—especially in terms of time and resource utilization.
    • Risk and coverage metrics are valued more than in the global average. European respondents also ranked risk and coverage quality metrics a surprising 21% higher than the global average. This could be related to the fact that the respondents from this region came primarily from the financial services and insurance sector, with healthcare and government close behind. In such highly-regulated industries, measuring and mitigating risk is certainly a core concern. This finding could also indicate European organizations place a greater emphasis on protecting the corporate brand.
    • Test data preparation time seems to be a greater concern. European respondents were more likely to measure (+18%) and highly-value (+23) time spent preparing test data than their global peers. Given the restrictions GDPR placed on test data as of May 2018, it seems likely that European organizations have significantly changed their test data management processes (e.g., to masking and more synthetic test data generation), and are cautiously monitoring how the changes are impacting their overall efficiency.

    Asia Pacific DevOps Quality Metrics Trends

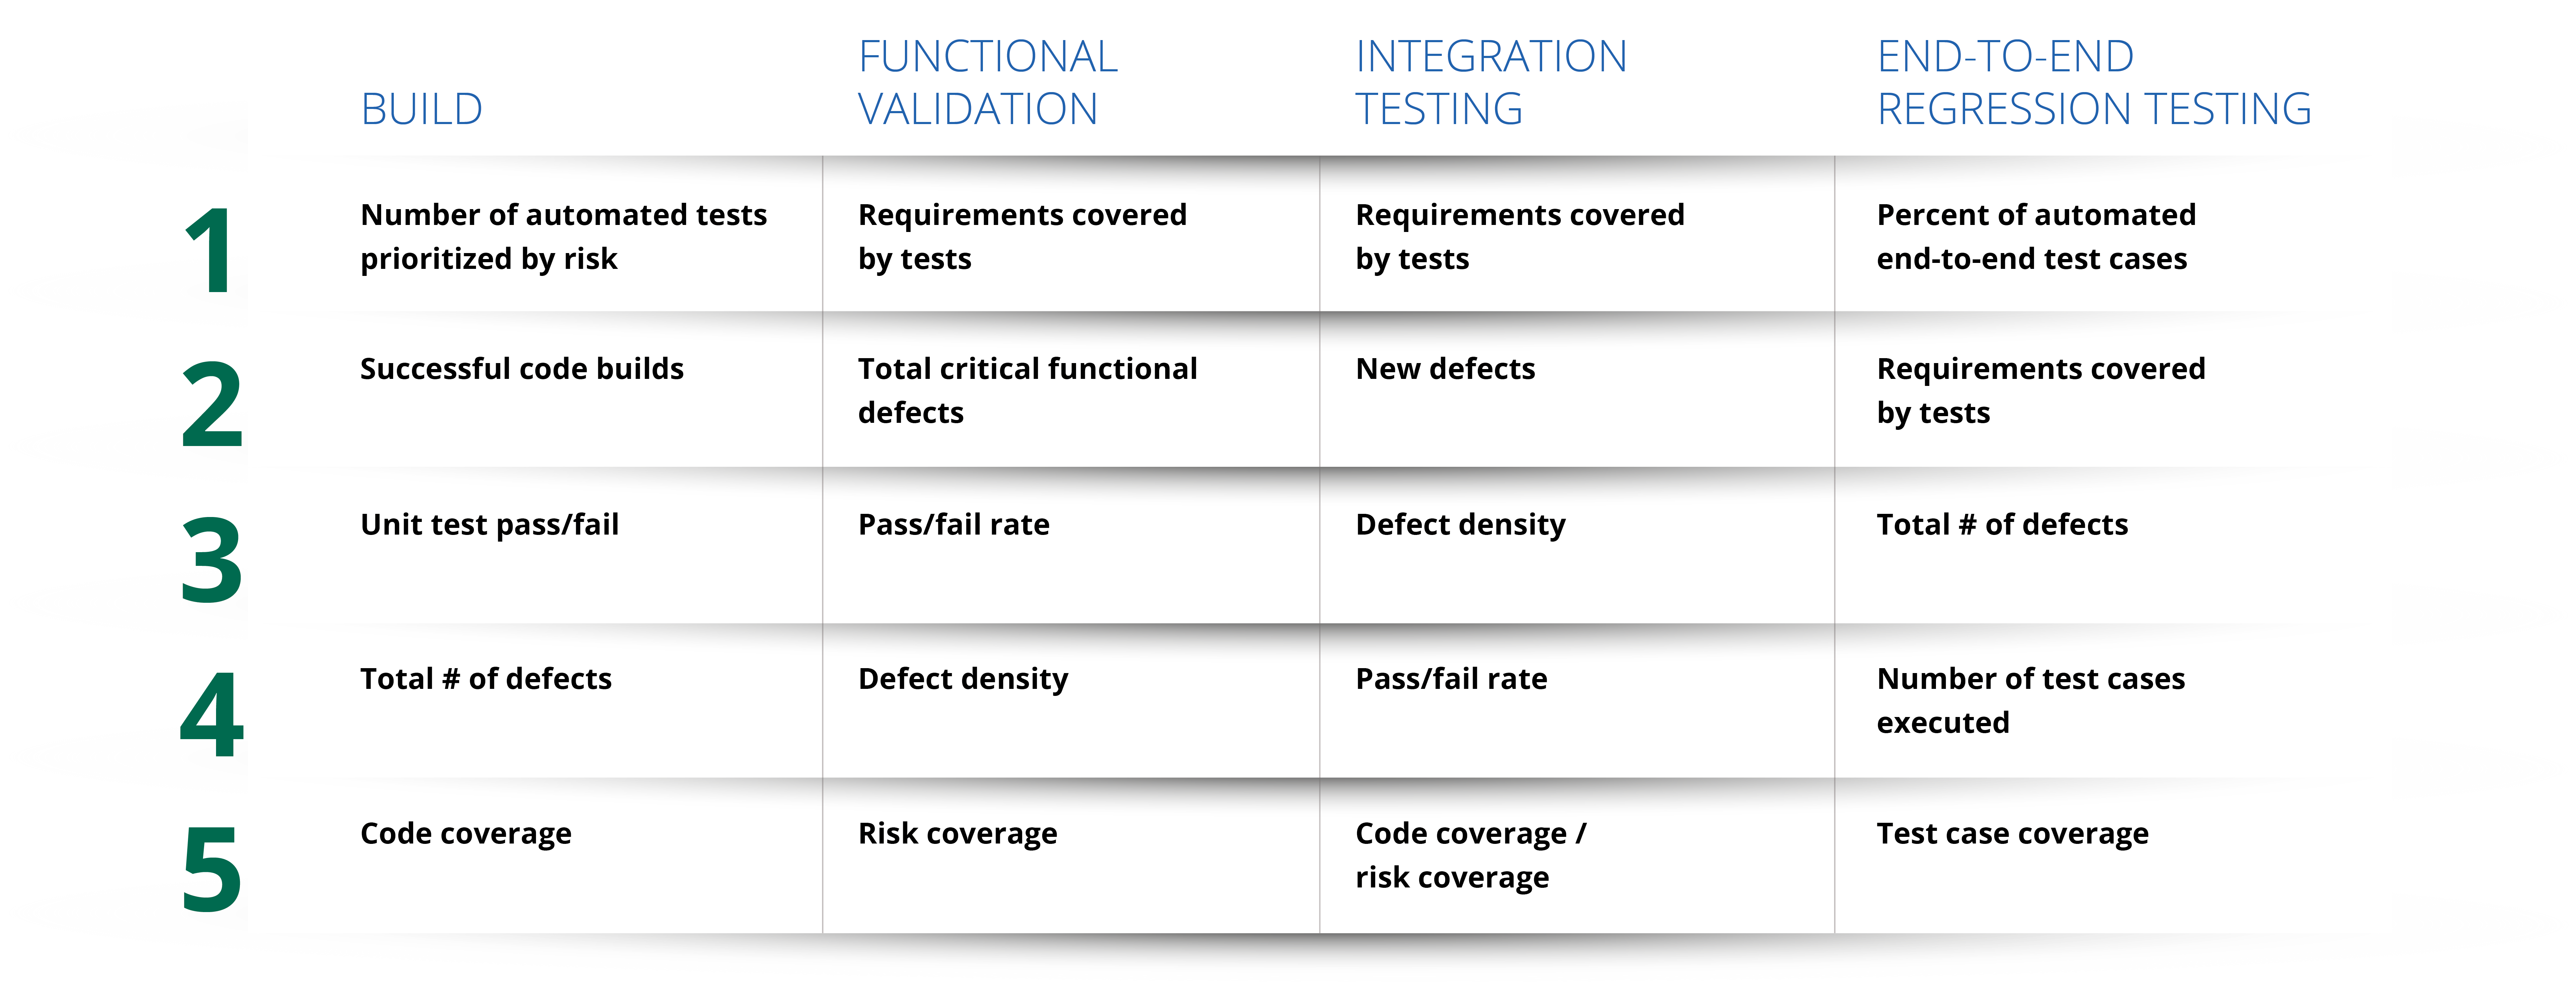
    Now, let’s shift focus to Asia Pacific. The following 20 metrics were ranked as the most valuable by the Asia Pacific DevOps experts who measure them:

    Notable trends in this region:

    • End-to-end testing metrics are valued—and measured—more than in the global average. Although Asia Pacific respondents measured fewer build and functional validation metrics than the global average, they measured (and valued) end-to-end testing metrics much more than their peers around the world. For example, percent of automated end-to-end tests was measured by 47% of the organizations (versus 36% globally) and highly-valued by 84% (versus 70% globally). Risk coverage measurement was significantly higher; it was measured by 49% (versus 34%) and highly-valued by 71% (versus 59%). This speaks to the region’s focus on digital transformation and commitment to delivering exceptional user experiences.
    • API testing metrics were also valued—and measured—more than in the global average. Asia Pacific respondents also measured and valued API testing quality metrics more than the global average. Overall, API quality metrics were measured by 16% more organizations in this region than globally. The highest valued API quality metrics were API test coverage (63% versus 39% globally) and API risk coverage (79% versus 62% globally). This prioritization of API testing is likely a side effect of the regional trend towards API-driven open banking (the majority of respondents indicated they were in the financial services and insurance sector).
    • There is a greater leader/laggard quality metrics measurement gap. Part of the study involved classifying the respondents as either DevOps leaders or DevOps laggards, based on their responses to various questions about the maturity of their processes. Although the percentage of DevOps leaders in the region was lower than the global average (18% versus 26%), the DevOps leaders from Asia Pacific generally measured quality metrics at a comparable rate to their global peers. However, the DevOps laggards in Asia Pacific generally measured quality metrics at a much lower rate than their global peers. This suggests the select set of firms that have truly prioritized DevOps initiatives have made great strides—and the laggards have a lot of catching up to do in order to remain competitive.

    Research Methodology

    Here’s a look at the process behind the research discussed above:

    1. Survey 603 global enterprise leaders responsible for their firms’ DevOps strategies.
    2. From that sample, identify the firms with mature and successful DevOps adoptions (157 met Forrester’s criteria for this distinction).
    3. Learn what quality metrics those experts actually measure, and how valuable they rate each metric that they regularly measure.
    4. Use those findings to rate and rank each metric’s usage (how often experts use the metric) and value (how highly experts value the metric).
    5. Compare the DevOps experts’ quality metric usage versus that of DevOps laggards. If there was a significant discrepancy, the metric is considered a DevOps differentiator.

    — Wayne Ariola

  • What Quality Metrics Matter Most for DevOps?

    What Quality Metrics Matter Most for DevOps?

    The way we develop and deliver software has changed dramatically in the past five years—but the metrics we use to measure quality remain largely the same. Despite seismic shifts in business expectations, development methodologies, system architectures and team structures, most organizations still rely on quality metrics that were designed for a much different era.

    Every other aspect of application delivery has been scrutinized and optimized as we transform our processes for DevOps. Why not put quality metrics under the microscope as well?

    Are metrics such as number of automated tests, test case coverage and pass/fail rate important in the context of DevOps, where the goal is immediate insight into whether a given release candidate has an acceptable level of risk? What other metrics can help us ensure that the steady stream of updates don’t undermine the very user experience we’re working so hard to enhance?

    To provide the DevOps community an objective perspective on what quality metrics are most critical for DevOps success, Tricentis commissioned Forrester to research the topic. The results are published in a new eBook, “Forrester Research on DevOps Quality Metrics that Matter: 75 Common Metrics—Ranked by Industry Experts.”

    The goal was to analyze how DevOps leaders measured and valued 75 quality metrics (selected by Forrester), then identify which metrics matter most for DevOps success. Here’s a look at the process:

    1. Survey 603 global enterprise leaders responsible for their firms’ DevOps strategies.
    2. From that sample, identify the firms with mature and successful DevOps adoptions (157 met Forrester’s criteria for this distinction).
    3. Learn what quality metrics those experts actually measure and how valuable they rate each metric they regularly measure.
    4. Use those findings to rate and rank each metric’s usage (how often experts use the metric) and value (how highly experts value the metric).
    5. Compare the DevOps experts’ quality metric usage versus that of DevOps laggards. If there was a significant discrepancy, the metric is considered a DevOps differentiator.

    The 75 DevOps quality metrics were divided into four categories:

    • Build
    • Functional validation
    • Integration testing
    • End-to-end regression testing

    For each category of quality metrics, we came up with a heat map showing usage versus value rankings. For example, here is the heat map for the Build category metrics.

    We also plotted the data for each metric into a quadrant with four sections:

    • Value Added: Metrics that are used frequently by DevOps experts and consistently rated as valuable by the organizations that measure them.
    • Hidden Gem: Metrics that are not used frequently by DevOps experts but are consistently rated as valuable by the organizations that measure them.
    • Overrated: Metrics that are used frequently by DevOps experts but not rated as valuable by the organizations that measure them.
    • Distraction: Metrics that are not used frequently by DevOps experts and not rated as valuable by the organizations that measure them.

    For example, here is the quadrant for Build category metrics:

    The eBook provides both heat maps and quadrants for all four categories, a quick look at each of the 75 metrics per-category and overall analyses, as well as a few fun lists.

    Here’s a preview:

    Hidden Gems

    The following metrics are not commonly used (even among DevOps experts), but are ranked as extremely valuable by the select teams who actually measure them:

    1. New defects (IT)
    2. Critical defects (FV)
    3. Automated tests prioritized by risk (Build)
    4. Code coverage (Build)
    5. Test cases executed (Build)
    6. Static analysis results (Build)
    7. Variance from baselines of percent of test cases passed (E2E)
    8. Release readiness (E2E)

    Top DevOps Differentiators

    DevOps experts/leaders measure the following metrics significantly more than DevOps laggards measure them:

    1. Automated tests prioritized by risk (Build)
    2. Percent of automated E2E test cases (E2E)
    3. Risk coverage (IT)
    4. Release readiness (FV, IT, E2E)
    5. Test efficiency (FV and IT)
    6. Requirements covered by tests (Build, FV, IT, E2E)
    7. Test case coverage (Build, E2E)
    8. Static analysis results (Build)
    9. Variance from baseline of percent of test cases passed (E2E)
    10. Test effectiveness (FV, IT, E2E)

    Most Used by DevOps Experts

    The following metrics are the most frequently used (overall) by DevOps experts/leaders:

    1. Test case coverage (E2E)
    2. Pass/fail rate (FV)
    3. API pass/fail rate (IT)
    4. Number of tests executed (E2E)
    5. API bug density (IT)
    6. Requirements covered by tests (FV)
    7. Requirements covered by tests (E2E)
    8. Blocked test cases (FV)
    9. Percent of automated E2E test cases (E2E)
    10. Successful code builds (build)

    Most Valued by DevOps Experts

    The following metrics are the most highly valued (overall) by DevOps experts/leaders:

    1. Requirements covered by API tests (IT)
    2. Percent of automated E2E tests (E2E)
    3. Requirements covered by tests (E2E)
    4. Requirements covered by tests (FV)
    5. Count of critical functional defects (FV)
    6. Total number of defects discovered in test (E2E)
    7. Number of test cases executed (E2E)
    8. Pass fail rate (FV)
    9. New API defects found (IT)
    10. Automated tests prioritized by risk (build)

    — Cynthia Dunlop