Tag: log data

  • Chronosphere Streamlines Management of Log Data to Reduce Costs

    Chronosphere Streamlines Management of Log Data to Reduce Costs

    Chronosphere today added additional capabilities to its log management platform that enable DevOps teams to both reduce costs and surface more actionable insights.

    Alok Bhide, head of product innovation for Chronosphere, said Chronosphere Logs 2.0 provides DevOps teams with more granular control over how log data is collected and stored. The overall goal is to make it simpler for DevOps teams to not only leverage analytics to identify which log data is actually being used but also more easily correlate it with metrics, events and traces, he added.

    Additionally, Chronosphere has added a Logs Quotas tool that enables DevOps teams to enforce budget restrictions on individual teams all the way down to specific datasets.

    Most DevOps teams are already being overwhelmed by the amount of telemetry data being collected, an issue that will only become more challenging to manage as more cloud-native and artificial intelligence (AI) applications are deployed in production environments.

    There is, of course, no shortage of observability platforms, but as IT environments become more complex, the need for tools that go well beyond simple monitoring of pre-defined metrics to troubleshoot applications has become a lot more pressing. The challenge is observability platforms collect data at levels of scale that from a cost perspective quickly add up. As a result, managing telemetry data has become a significant challenge. Unfortunately, most DevOps teams are not going to be able to hire someone to optimally manage the flow telemetry data. Instead, that needs to be a core capability of the observability platform.

    Less clear in the longer term is to what degree observability will become a task assigned to an artificial intelligence (AI) agent rather than a DevOps engineer. There is no doubt DevOps engineers will need to review the findings of an AI agent that has investigated an incident, but much of the tedious effort required to sort through metric, events, logs and traces should become increasingly automated. Each DevOps engineering team will then need to decide how comfortable they are allowing another set of AI agents to automatically remediate issues as they are uncovered, noted Bhide.

    In the meantime, organizations have never been more dependent on software than they are today, but even as the number of applications being deployed increases, the size of the DevOps teams tasked with maintaining them continues to remain relatively stagnant. In fact, in an AI era where more applications are expected to be deployed in the next few years than the entire last decade, supporting all those applications will require an ability to investigate and, if necessary, remediate anomalies within minutes of being discovered. Legacy monitoring tools were never intended to provide forensics insights in near real time.

    Of course, convincing business leaders to invest in observability platforms can be a challenge. DevOps teams need to be certain that the cost of storing massive amounts of telemetry does not outweigh the benefits. After all, no matter how many issues an observability prevents, someone in the finance team will still be closely monitoring the cost of a platform that over time only continues to grow.

  • Harnessing the Value of Log Data Analytics

    Harnessing the Value of Log Data Analytics

    Each day, the average enterprise’s cloud applications, containers, compute nodes and other components throw off millions of tiny logs. Each log is a file whose data describes an event such as a user action, service request, application task or compute error. Logs also capture messages that applications and other components send to one another.

    There’s a wealth of information and value hidden in those logs, which is why businesses are so keen on using them to address business needs like customer engagement, IT security and cloud operations. 

    The need for understanding and managing this data is so high that Markets and Markets valued the market for log analytics data at $1.9 billion in 2020. Analysts predict this to grow to $3.7 billion by 2025. It’s not just the sheer growth of data driving this market—it’s also the demand to gain business insights. 

    That’s why ChaosSearch recently conducted a survey to better understand how businesses are currently using and managing their log data. Insights were collected from practitioners at 50 medium-to-large enterprise organizations. What the survey found is that organizations see a lot of value from tapping into their log data to achieve better outcomes across both business and IT functions. That said, these practitioners face challenges handling the scale requirements and they know there are still more opportunities for them to expand the scope and discipline for log management.

    Top Use Cases

    This study confirmed that businesses are using log data in a number of ways, spanning both business and IT functions. We see that more than 90% of respondents are using log management and analytics for at least two primary use cases. It’s not surprising that the top use cases for log management are security (70%) and IT monitoring (68%), but many are prioritizing BI & analytics (46%) and business operations (28%) as well.  


    It’s interesting to look more closely at the security use cases: Investigations (45%) and insider threats (45%) top the list of SecOps uses for log data. Audits and compliance (32%), threat hunting (32%) and anomaly detection (30%) also made the list. 

    Growing Desire to Support Business Operations

    We also saw that these practitioners want to use log data to support business operations—specifically to drive better business outcomes and improve competitiveness. For example:

    1. A global industrial equipment manufacturer attached IoT devices to farm equipment to track weather, temperature, humidity, time of day, depth of planting, soil conditions, seeds planted and geo-routing on farms. This raw data is continually collected and analyzed within the central log analytics solution, thereby allowing the vendor to deliver farm productivity reporting and recommendations back to their clients.
    2. A biopharmaceutical firm tracks cell culture logs with alerts on temperature and humidity. The company uses its log analytics platform to store long-term data to run queries that help in hypothesis testing. They also conduct various long-tail analyses that reveal trends and allow scientists to make informed decisions about future experiments. 
    3. A large online retailer leverages log data from web visits and other customer activities to develop 360-degree profiles of customers and analyze the steps in the “customer journey” to identify opportunities for improved efficiency and increased revenue capture.

    Tackling Challenges of Growth and Complexity

    Even with more interest in using log data for security and business operations, the surveyed practitioners called out a range of challenges. The top three being: Complex infrastructure (48%), managing costs (42%) and managing growth (34%). They also said the lack of centralization, reporting and data quality were problems. These challenges are perhaps exacerbated by the expectation that data will continue to grow and data retention will increase. 


    There are a lot of variables that drive the volume of log data generation, like the number of users, devices, applications, IT environments and infrastructure elements. The survey found two things were universal—data growth rates are high and are a source of pain and data retention is an increasing priority. 

    Among the participants, 94% ingest at least one TB or more of data per day, with 18% in the 10TB + range. Consider this—the average daily ingest volume for these companies was 7.9 TB! 

    The problem is, despite the massive amounts of data being ingested daily, only 28% of respondents are capturing 80% of log data or more today. And 78% believe that capturing more than 80% of log data is ideal. That’s a big gap. 

    Practitioners Rate Most Important Log Management Capabilities

    We also learned that these practitioners are generally satisfied with their existing solutions, but many of them still expect to bring in a new solution for log management and analytics within the next three years. That’s because they want better scale and a cloud-native solution. 

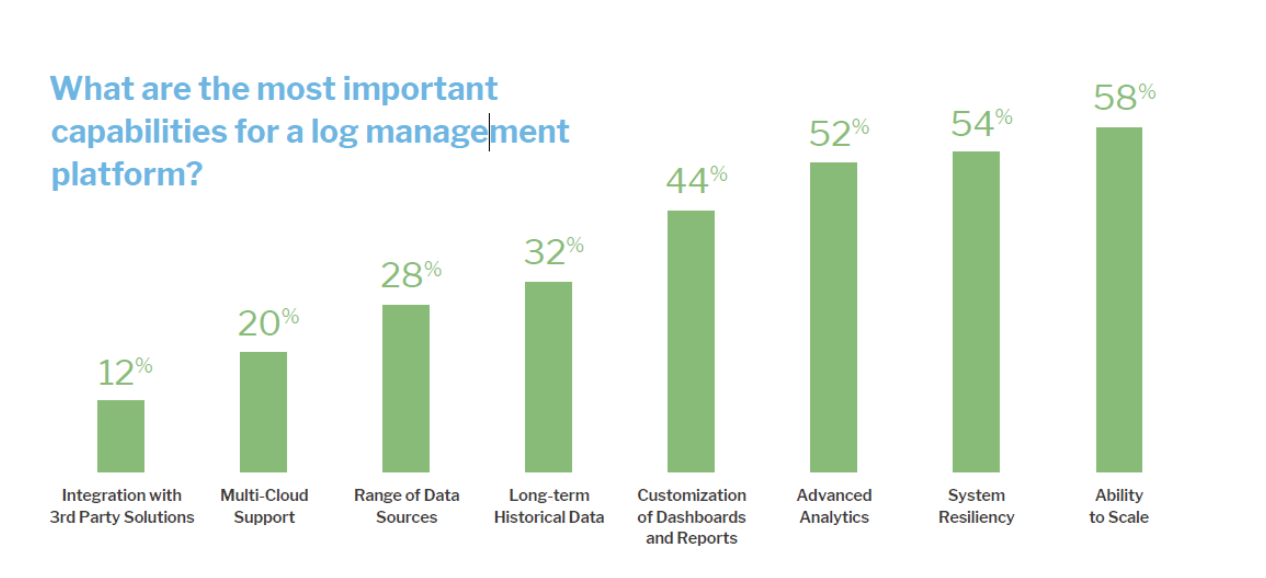
    When we asked about important capabilities for a log management platform, scalability (58%), resilience (54%) and advanced analytics (52%) topped the list. 


    Budgets Increase to Meet Demand for Log Analytics

    To address these challenges and opportunities before them, survey respondents are growing their budgets; 86% anticipate their budgets will grow by at least 20% and 36% expect an increase of 50% or more. These budgets will not only support more data capture and increase retention periods but also help them go after the growing use cases for supporting the business. In fact, 68% said they expect the number of use cases to grow in the next 12 months.

    There is no doubt: Companies who value log data and invest in capturing data will harness insights that will propel their businesses forward.

  • How Logs Can Empower Your CI/CD Delivery Pipeline

    How Logs Can Empower Your CI/CD Delivery Pipeline

    Change is the currency of software success. This need to change and grow is the basis for continuous integration and continuous delivery (CI/CD). Each year, new industries embrace this philosophy of constant change, but without the necessary data underpinning their decisions, every deployment is a risk. When you enrich your software delivery with log data coupled with best practice log management, you mitigate this risk and enable rapid, safe change in your organization.

    Logs are often the most common source of information about an application’s behavior. They provide context as well as result, opening up far more information than a simple count metric will. Despite the immense insight that they can offer, organizations regularly overlook them. Many leave their logs in files on servers, far away from the CI/CD pipeline that needs them. It doesn’t have to be this way; with some best practices, every part of your business can collect, analyze and utilize the hidden knowledge within your logs.

    Add Life to Log Data With JSON

    Logging in an unstructured format dramatically increases the complexity of detecting patterns in your logs. By logging your application output in JSON, you open up the possibility of analysis of all of your logs. This gives you a top-down view of your entire system while still maintaining readability. This empowers your CI/CD pipeline by allowing you to query and filter your logs, which then enables you to focus in on the problem and precisely diagnose any unwanted side effects of your latest change.

    Create Actionable Alerts

    If alerts are defined and channeled correctly, have context and can be interpreted easily, they will be actionable, add context and offer greater value. It is difficult to provide context when a single metric exceeds a threshold, but log lines are more sophisticated. They can include additional information to provide context and allow us to pinpoint the source of the issue fast. This is an essential capability for a company embracing CI/CD.

    Prioritize Your Logs

    Structured logs often come attached with a severity, which indicates how seriously we should investigate an event. An INFO level log signals business as usual, but an ERROR demands immediate attention. Once your logs have these tags, you can make intelligent, automated decisions that will automatically respond to unwanted changes in your system.

    Benchmark Each Version to Understand ‘Normal’

    “Normal” is a complicated idea when working in a microservices architecture. It may be safe to ignore a minor slowdown of a single service, but an unfortunate combination of events can lead to disaster. Benchmarking enables us to see these disasters well before our users. Benchmarking is the act of recording what the normal behavior of an application is. After each deployment from your CI/CD pipeline, compare your new behavior with your previous benchmark. If something is out of the ordinary, logs provide the information you need to act decisively. They provide an outstanding baseline signal for your benchmark.

    Analyzed Logs Can Level up Your CI/CD Pipeline

    Building a CI/CD pipeline is not the most difficult part. Neither is the deployment of new features. In fact, the greatest challenge facing any organization wanting to deliver their changes via a CI/CD pipeline is observability. With a best-practice approach to the preparation, curation and analysis of application and system logs, we can overcome this challenge and confidently change at a pace that propels us to the forefront of our market.

  • Log Data as a Valuable Tool in the DevOps Lifecycle (and Beyond)

    Log Data as a Valuable Tool in the DevOps Lifecycle (and Beyond)

    As many of us embrace DevOps, developers have to think beyond delivering code that is taken by “operations” to be deployed, run and monitored in production environments. DevOps instead focuses on breaking down silos within organizations and sharing the responsibility of development and operations such that developers are now more conscious of how their code will run in a production environment. They also play a critical role in the process of deploying, monitoring and operating the applications they write.

    Thus the responsibilities of developers can now span from development and testing, to deployment and monitoring, to gathering business metrics from production environments – i.e. they now follow a DevOps lifecycle rather than a development lifecycle. The focus of these responsibilities can change slightly depending on which stage an application is at in its maturity model. In this post, we first outline three high-level stages of an application’s maturity and then look at how logs can serve as a valuable tool at each of the different stages and in particular for teams following a DevOps methodology.

    The Stages of Application Maturity:

    1. Stage 1 – Initial system development and prototyping: When organizations embark on new projects, they usually have a small team iteratively develop an initial prototype before throwing the weight of a large development team behind it..This prototype is used to test any hypothesis and initial functionality; it limits risk and allows for an iterative feedback loop from early users. More and more often, prototypes are being quickly developed on cloud infrastructures where the initial development team plays the role of developing the system, selecting and managing the infrastructure, deploying the application, as well as putting in place initial monitoring for the running system. Only after an initial user group has used the system, provided feedback and helped prove a hypothesis will the system will move into a “go-live” state in the real world.
    1. Stage 2 – System going live: When an application moves from being a prototype to “going live,” an organization has made the decision that the project is worth pursuing and there is potential value in extending the system to a wider audience. This can involve investing in a larger development team, a larger infrastructure to handle real-user load, as well as marketing budgets to get the word out on this new offering. At this stage, focus can shift from initial concepts to building out more advanced and robust capabilities – ensuring service uptime, performance and reliability.
    2. Stage 3 – System generating value: If a system moves into a stage of creating value for the business, a number of new stakeholders can arrive on the scene with new requirements. Typically product managers and marketing teams will have requirements on how a new application’s features are being used, how an application’s marketing campaigns are tracking and how cohorts of users are flowing through the sales funnel. These new stakeholders are largely concerned with different business metrics and how they can be obtained from the running system.

    So where and why log data?

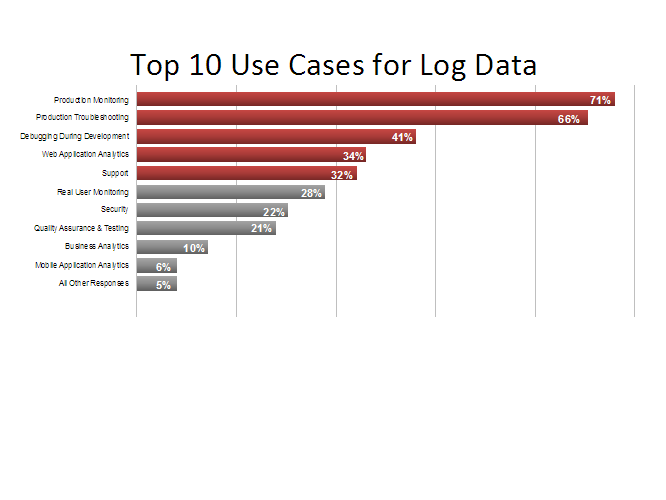
    While log data has traditionally been used by developers for debugging purposes (i.e. investigating exceptions stack traces), more recently log data is being applied for a much wider set of use cases.  A recent survey carried out across a sample of 25,000 log management users shows a breakdown of the following use cases:
    logos

    Results from a recent survey from a sample set across 25k users who were asked: “What are the top use cases for your logs?”

    As applications move across the different stages of maturity above, logs act as a valuable tool to assist with the insights required by the different stages of the DevOps lifecycle – e.g., during development activities, testing, production monitoring, and web and business analytics. In fact, logs provide a single data stream that can act as a common language across these different tasks.

    Because of this shift, it is important to look at how logs can be applied to assist with DevOps-related responsibilities during the different stages of application maturity:

    How logs are applied during application maturity stage 1

    The ability to apply agile development and testing are key during this phase such that early prototypes are iterated upon and hypothesis proved out:

    Logs as a debugging tool: Logs have always been a valuable debugging tool and continue to be so. They can capture events at different severity levels from every layer of the software stack (operating systems, web servers, databases, your software) and from across all devices (mobile devices, servers, routers, firewalls). During development, verbose logging can be enabled to give incredibly detailed information on the system as it executes. Today’s log management technologies are particularly useful as they allow you to utilize the benefits of verbose logging to easily cut through the noise and identify key events when exceptions occur. They also all allow for fast searching of key events in an extremely large volume of log data.

    Logs for system load and performance testing: Before a system goes live, system load and performance testing is often performed to give a level of confidence that real-world loads can be handled by the application. Load testing tools will often measure system response times to make sure that the system is performing well even under heavy loads. However, log data should also be analyzed during such tests to make sure high levels of exceptions are not being thrown and that the system is behaving “under the hood” as expected.

    How logs are applied during application maturity stage 2

    Production monitoring and troubleshooting can be a key focus during this stage of a system’s maturity given that any downtime can be particularly costly from a monetary and reputational perspective once a system goes live.

    Log for production monitoring: Production monitoring is fast becoming a leading use case for log data. Real-time processing capabilities of log management solutions now mean that log events can be parsed in real time, and important metrics can be extracted and visualized in high-level monitoring dashboards. Furthermore, real-time alerting can be applied to give notifications when important system events occur or particular thresholds are breached.

    Logs for production troubleshooting: Logs no longer simply contain exceptions and stack traces but are instead a blend of information from a range of different sources that can be correlated to allow for quick troubleshooting. This is especially important when there are issues in production. For example, logs will regularly now contain: server resource usage information, application performance metrics, feature usage information, exceptions and errors. This blend of information, which was traditionally only available by utilizing a number of other tools, is now available in a single location via a standard log management solution.

    How logs are applied during application maturity stage 3

    When an application begins to create value, product and marketing stakeholders will want to focus on usage and business metrics. While this information may go beyond the typical DevOps lifecycle, it is becoming more and more common for developers following a DevOps methodology to be tasked with gathering such information.

    Logs for web analytics: Analyzing website trends is not something typically associated with someone in a DevOps role and is usually the mainstay of marketing folks. However, developers are often engaged to collect this data for different parts of the organization. Logs provide a lightweight way to understand who is accessing an application, how often and from where. For starters, a lot of this information is already contained in web server logs without any additional instrumentation required. Furthermore, logs can give not only an aggregate view of web trends, but also allow the drill down to a per-user view to analyze behaviors at an individual user or account level.

    Logs for business metrics: Today’s log management technologies allow you to extract field-level values and can aggregate them and roll them up into high-level metrics dashboards. Thus,,logs can be used to not only understand a systems performance and usage trends, but also to aggregate business metrics such as signups per day, number of transactions, the value of those transactions, etc. However, the real benefit of using logs for metrics dashboards, in my opinion, is that they maintain the evidence. In other words, they allow you to easily validate any trends or changes in your system or business’ behavior. This has traditionally been a painful task, as it often involves engineering cycles/checking database tables, etc. Now, logs allow you to immediately drill down from a high-level view to the log-level to quickly view and understand the individual events that may have led to a spike in a key performance indicator.

    After spending many years talking to thousands of log management users, I am continuing to see logs become more and more critical to the different stages of an application’s maturity. The DevOps movement has greatly assisted with this because the same team or individual responsible for initial prototype development may also be responsible for production monitoring or gathering business metrics for that matter.  The value of logs is now being recognized early in the DevOps lifecycle, and the power of log data is quickly expanding across a range of different functions.

    This article is by Trevor Parsons, PhD, Co-founder and Chief Scientist, Logentries