Kubernetes and Docker are two of the most commonly heard buzzwords in modern DevOps conversations. Docker is a tool that enables you to containerize and run your applications, and Kubernetes provides you with a platform to orchestrate or manage these containers—since managing thousands of containers manually using the Docker CLI would be a practical nightmare.
However, simply running thousands of containers and managing them through Kubernetes is not enough. You have to observe and analyze them properly to ensure that your services are up and running optimally. This process is called Site Reliability Engineering (SRE), a term initiated and popularized by Google. Observability and analysis are a major element of SRE. It can be subdivided into the following three areas:
- Monitoring allows you to extract numerical metrics from your applications and resources that can later be visualized and analyzed to present the current state of your resources. Once the metrics are extracted, they can be used to set up alert rules, facilitate profiling and debugging, and make better SRE decisions.
- Logging enables developers to debug their containers in case of a failure. Containers are short-lived, and so are logs. Kubernetes and Docker do provide a native way of browsing container logs, but it is very limited in its functionality. As a result, a centralized log plane is a must in any container-oriented environment.
- Tracing allows you to debug services running on a network and follow a request trail until the source of a problem can be determined. In a microservices architecture, when multiple services/containers send requests to each other to perform one business task, a proper tracing solution is necessary.
This article will list and describe the most effective open source tools for monitoring and analyzing services running as containers.
Prometheus
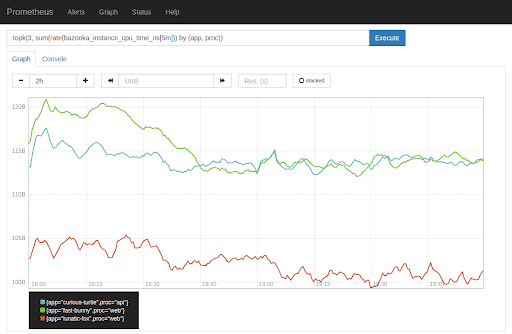
Prometheus is the first tool that comes to mind when discussing open source monitoring solutions. It is very popular in the development community, and it is a graduate of the CNCF project, which focuses on the monitoring side of SRE. Originally created and open sourced by SoundCloud, Prometheus simplifies the process of pulling numerical metrics based on a time series from a given metrics endpoint. It was built to monitor highly dynamic container environments.
Prometheus is subdivided into three elements: Prometheus server, Alertmanager and exporters. Exporters are stand-alone, independent processes/containers that can be run on your target resource to generate and export metrics via a metrics API. The Prometheus server then takes care of service discovery as well as pulling metrics from the exporters to be stored in the Prometheus DB and later used for visualization or alerting. Alertmanager is responsible for setting up alert rules, analyzing the data in the Prometheus DB and sending alert messages to multiple receivers if a certain rule is triggered. There are a huge number of exporters, listed here, which are both officially supported by Prometheus and maintained by the community.
Prometheus has become the industry standard for monitoring cloud-native architectures. While it is known for its simplicity with service discovery, its ease of use, its alerting capacity and its integration with Kubernetes, its polling architecture is not ideal. Currently, the metrics endpoint has to be reachable by the Prometheus server. However, there is a pushgateway implemented in Prometheus that enables metric pushing rather than polling. Another downside of Prometheus is that it doesn’t scale well. This problem can be fixed in the Thanos adaptation of Prometheus.


Related tools and technologies: Grafana, Cortex, Thanos, Prometheus Exporters, Alert Manager, Istio, Prometheus Operator.
Grafana
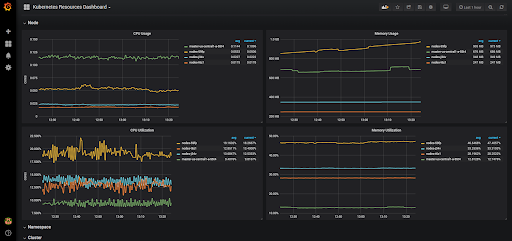
Grafana is an open source metric analytics and visualization suite. It allows you to create custom dashboards using data taken from multiple sources, such as Prometheus, Elasticsearch, MySQL, Postgres and Redis. Furthermore, Grafana has its own alerting system and a role-based access control (RBAC) system for software. As a data visualization tool, Grafana is famous among Prometheus users for enabling them to effectively visualize the metrics stored in Prometheus. There’s a wide array of official and community-built custom dashboards for various data sources in Grafana, allowing users to easily set up dashboards (found at this link) and get on with monitoring. Grafana offers another associated product called Loki, which aggregates logs in Kubernetes and integrates well with the Grafana UI.
Related tools and technologies: Loki, Prometheus.
Elastic Stack
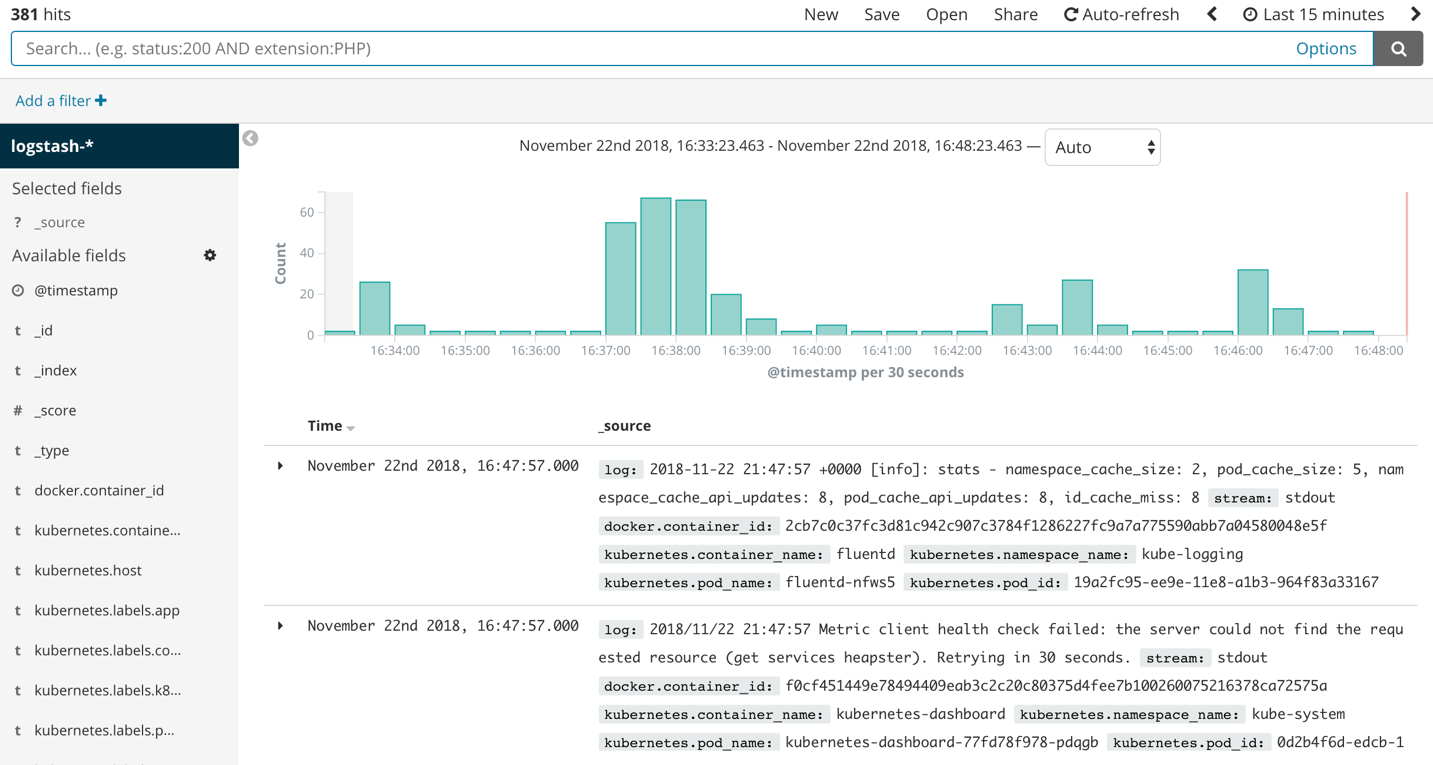
Elastic Stack is a group of open source products from Elastic designed to help users search, analyze, and visualize data from any type of source, in any format, in real time. This product was previously recognized as the ELK stack, where each letter of the acronym stood for one of the company’s main products: Elasticsearch, Logstash and Kibana. Elastic Stack provides both monitoring and logging solutions with the help of its big data database, Elasticsearch.
In order to aggregate logs, people tend to use Elasticsearch for storage, Logstash or Fluentd for log streaming, and Kibana for visualization. Fluentd is not part of the Elastic Stack, but it is widely used with Kubernetes to stream logs in place of Logstash, the tool provided by Elastic Stack. Similarly, Metricbeat is used to scrape metrics and set up visualizations on Kibana. The enterprise version of Elastic Stack ships with X-Pack, a set of additional tools that enables reporting, alerting and role-based access control (RBAC), among other features. By default, the Elastic Stack GUI, Kibana, does not support RBAC. You have to use the previously mentioned enterprise version of Elastic Stack to enable it.
Related tools and technologies: X-pack, Metricbeat, Logstash, Kibana.
Sensu Go
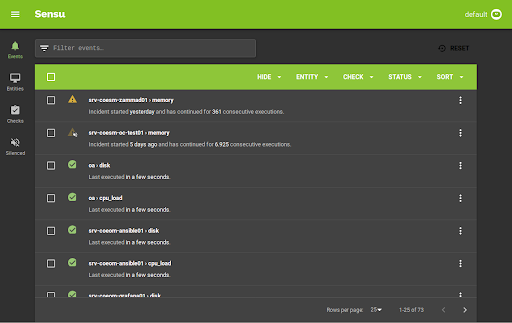
Sensu Go is a telemetry and service health checking solution for multi-cloud monitoring at scale. It allows you to gain visibility into servers, containers, services, applications, functions and connected devices across any public or private cloud. Sensu can be run side-by-side with Prometheus to get the best out of both solutions, or it can be run natively without Prometheus. Sensu works best alongside Prometheus, since exporting application level metrics to Prometheus requires loading the Prometheus SDK to your application codebase and exposing a metrics endpoint. The endpoint is then scraped and stored in the Prometheus Server. This may sound like a lot of work—and, sometimes, it is. Sensu avoids this complexity by using a sidecar concept. A Sensu agent is deployed alongside your application. The agent constantly collects and exposes metrics to the Prometheus server without your having to change the application codebase.
Sensu works without Prometheus too. It can operate natively in Kubernetes, where it has its own server to store and visualize metric data exposed by the previously mentioned Sensu agent.
Related tools and technologies: Prometheus.
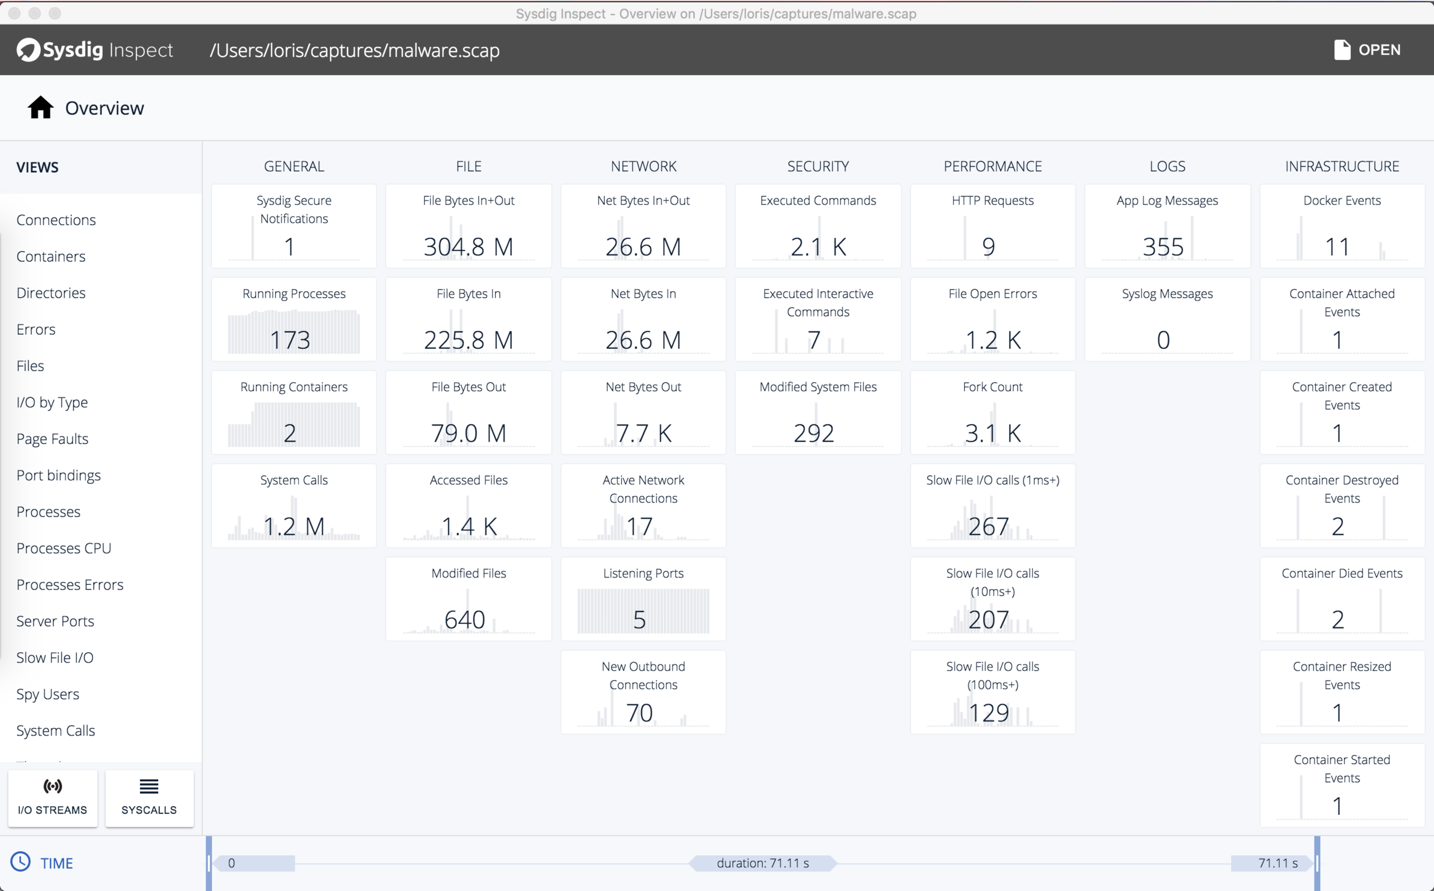
Sysdig Inspect
Sysdig has two open source products: Sysdig Inspect and Falco. Here, we’ll focus on Inspect, which monitors and captures the container processes running in your system and allows you to drill into those processes for post-incident forensics. This enables you to analyze your application performance, troubleshoot errors and monitor any processors that could be misbehaving. Furthermore, if your system is breached, Sysdig allows you to understand how the breach occurred and what data was taken in the process. Sysdig Inspect is a very powerful tool that focuses on the performance tuning and security investigation of your system.
Related tools and technologies: Grafana, Sysdig, Sysdig Falco.
Jaeger
Jaeger is an end-to-end distributed tracing solution that was open sourced by Uber Engineering. It allows you to monitor and troubleshoot transactions in complex distributed systems. In modern microservice architectures, the majority of operational problems fall under the umbrellas of networking and observability. When a service failure occurs, you have no idea how the requests have gone from service to service over the network to complete a single business transaction. This makes debugging extremely difficult. Currently incubating under CNCF, Jaeger uses tracing to enable root cause analysis, performance and latency optimization, and distributed transaction monitoring. Jaeger works out of the box with Istio, a popular service mesh implementation open sourced by Google.
Related tools and technologies: Prometheus, Jaeger, Zipkin, Istio.

Conclusion
These tools are widely used in the tech industry, and they all have their benefits. Most of these solutions, however, require skilled implementation and ongoing manual maintenance that can be a burden for DevOps teams and a distraction from the business. There’s no one solution that can cater to all of your requirements, since each tool focuses on one or two specific aspects of observability and analysis. By mixing these tools together, you can derive a unique solution for your individual business needs.
For ease of comparison, the chart below outlines the features offered by each of the tools discussed in this article.

