Category: Application Performance Management/Monitoring

  • Report Surfaces DevOps Challenges for Mobile Applications

    Report Surfaces DevOps Challenges for Mobile Applications

    An assessment of 1,600 DevOps teams involved in building and deploying mobile applications found that 62% were adversely impacted by manual processes that slowed the rate at which these applications were deployed and updated.

    Based on the Mobile DevOps Assessment (MODAS) created by Bitrise, a provider of a continuous integration/continuous delivery (CI/CD) platform for building and deploying mobile applications, the metric measured the creation, testing, deployment, monitoring and collaboration phases of building and deploying applications.

    The survey also found (44%) of respondents reported their release approval process is mostly or entirely manual, with only 9% having fully automated application releases. Only 22% of teams said they’ve been able to complete internal release processes in less than an hour.

    The survey also found that nearly two-thirds of organizations (66%) have deployed applications that can’t be opened in two seconds or less, which is widely considered the accepted level of performance required.

    In addition, three-quarters of organizations (75%) required more than two days to address bug fixes. Only 21% of teams said that they had implemented some form of app performance monitoring to keep track of bugs, the report found.

    Daniel Balla, chief strategy officer for Bitrise, said MODAS applies many of the concepts from the DevOps Research and Assessment (DORA) metrics that Google now oversees. Those metrics, however, are not specifically designed to assess mobile application development initiatives, he noted.

    It’s not clear what percentage of applications DevOps teams are building today are deployed on mobile devices. But given the emphasis on digital business transformation initiatives, many of these applications are increasingly mission-critical to organizations. The general expectation among mobile application end users is that apps will be regularly updated with new functionality. However, if release processes are largely manual, regularly improving the user experience can become problematic. In addition to the increased likelihood that mistakes will be made, manual processes are often the reason why a vulnerability was introduced into an application environment.

    DevOps teams will also need to also consider the level of scale that will be required to support mobile app development, noted Balla. Many of the tools that developers rely on today to build applications were not necessarily designed to enable developers to build and deploy mobile applications at scale, he added.

    Finally, most enterprise applications need to run on multiple devices, so the tools used to create these applications can’t focus on applications that can only run on one platform, said Balla.

    Regardless of the approach to building and deploying mobile applications, the amount of focus on them within most organizations is high; any issues that arise are likely to be noticed by the highest echelons of an organization. That level of attention can easily put pressure on DevOps teams that frequently work on multiple projects. The challenge and the opportunity now is to create a set of DevOps workflows optimized for mobile applications that almost by definition require much more frequent updates than any other type of application.

  • PagerDuty Signals Commitment to Adding Generative AI Capabilities

    PagerDuty Signals Commitment to Adding Generative AI Capabilities

    PagerDuty has signaled its intention to add generative artificial intelligence (AI) capabilities to its cloud platform for managing IT operations via integrations with large language model (LLM) providers that it will disclose at a future date.

    These capabilities will make it possible to invoke natural language via PagerDuty Operations Cloud to automatically generate status updates, create drafts of incident postmortem reports and even co-author workflows in any programming language to automate remediation of an issue.

    Damon Edwards, senior director of product for PagerDuty, said as AI continues to evolve, the goal will be to minimize the need for human involvement as much as possible. That doesn’t mean there won’t be a need for humans to be involved, but it does mean that many rote tasks associated with managing an IT incident can be automated, he added.

    For example, the reports that are run to determine the root cause every time there is an incident can be automated, noted Edwards. In addition, summarizations of status reports or postmortems after incidents were resolved can be made readily available to any member of an IT team on demand, he added.

    Those capabilities will also make it easier to onboard new members to an incident management team as required, said Edwards. Today, it’s difficult to add new members to a team after an incident has unfolded because it takes time to bring them up to speed, he noted.

    In addition, generative AI also makes it easier to capture a lot of the tribal knowledge within an IT organization that would otherwise disappear when staff either leave the company or shift roles, said Edwards.

    The generative AI additions to the PagerDuty platform extend an artificial intelligence for IT operations (AIOps) capability that PagerDuty made available this spring. The PagerDuty AIOps platform leverages the data model embedded in its incident management software to reduce the amount of time required for an AI platform to learn how an IT environment operates and begin surfacing valid recommendations to optimize workflows.

    It’s not clear at what pace AI will be adopted within enterprise IT organizations, but it is rapidly becoming pervasive. Each DevOps team will need to decide the degree to which they can rely on AI to manage IT processes, but as IT processes become more complex, there is a clear need for AI to navigate all the dependencies that exist in an IT environment. As more routine tasks are automated, however, there will also inevitably be a realignment of roles and responsibilities within an IT organization. The overall goal is not so much to eliminate IT staff as much as it is to enable them to manage IT environments at a much higher level of scale.

    In the meantime, DevOps teams need to plan for not only what is possible using generative AI today but also tomorrow. After all, there’s not a lot of point in training someone to take on a new task if that task is automated a few months from now.

  • Chronosphere Adds Professional Services to Jumpstart Observability

    Chronosphere Adds Professional Services to Jumpstart Observability

    Chronosphere has added a professional services capability through which it will provide the resources and expertise needed to deploy and manage its observability platform.

    Ian Smith, field CTO for Chronosphere, said the Chronosphere Quick Start program will make it easier for organizations to transition away from legacy monitoring tools that only track a set of pre-defined metrics and embrace an observability platform that enables DevOps teams to surface issues before an IT environment is disrupted.

    The scope of the services provided spans everything from data ingestion to providing training so that management of the Chronosphere observability platform can eventually be handed over to an internal DevOps team.

    The professional services team will also guide DevOps teams through setting up data control mechanisms and retention polices in addition to crafting dashboards to monitor specific processes.

    Finally, there’s also a self-paced online learning platform, dubbed Chronosphere University, that provides a comprehensive curriculum to help DevOps teams navigate fundamentals, advanced features and best practices.

    It’s still early days as far as the adoption of observability platforms is concerned. But it’s apparent that as application environments become more complex, the plethora of monitoring tools that DevOps teams rely on will need to be streamlined. Observability platforms promise to unify logs, metrics and traces in a way that makes it simpler to launch queries to identify the root cause of an issue.

    The rate at which DevOps teams will embrace observability will naturally vary, but the biggest technical obstacles are deploying and configuring the platform, loading data and managing the cost of storing all the data that is collected.

    In addition, DevOps teams also need to understand what queries to launch to investigate specific issues. Many DevOps teams lack the expertise required to frame those queries today, but it’s expected that machine learning algorithms and other forms of artificial intelligence (AI) will automatically identify issues that might lead to disruption.

    In the meantime, DevOps teams should be evaluating where it makes sense to continue to rely on monitoring tools. In many instances, an observability platform might obviate the need for that tool, but there may also be plenty of instances where a simple monitoring tool is sufficient for the task at hand.

    One way or another, however, more advanced observability capabilities will be needed as application environments continue to become more complex in the cloud-native era. Application environments now consist of a mix of monolithic and microservices-based applications that gain more dependencies with each passing day. An application may not be as prone to crash as it once was, but determining the root cause of a performance issue can still take weeks given all the dependencies that exist between various services.

    Regardless of approach, observability has always been a core tenet of DevOps. As organizations’ DevOps maturity increases, the greater the appreciation for it becomes. The challenge has been that observability is one of many DevOps things that are easier said than done.

  • Logz.io Taps AI to Surface Incident Response Recommendations

    Logz.io Taps AI to Surface Incident Response Recommendations

    Logz.io this week added a supervised machine learning capability to its observability platform that reduces mean-time-to-remediation by surfacing recommendations for resolving incidents.

    Asaf Yigal, vice president of product for Logz.io, said the Alert Recommendation capability added to the Logz.io Open360 platform uses artificial intelligence (AI) to model the steps a DevOps team needs to complete to resolve an incident.

    The goal is to reduce the amount of time required to resolve incidents at a time when IT environments are becoming increasingly complex, he added.

    In fact, a recent Logz.io survey found 75% of respondents said it currently takes them hours to resolve production issues, with only 14% satisfied with their current mean-time-to-resolution (MTTR). A total of 41% specifically cited monitoring and observability of Kubernetes environments as a primary challenge.

    Alert Recommendation is the latest in a series of investments in AI that Logz.io has made. Previously, Logz.io integrated the ChatGPT generative artificial intelligence (AI) platform to surface links to related information and best practices for resolving IT issues.

    In general, AI tools should make it possible to manage IT at a level of scale that eliminates many of the low-level data engineering and analytics tasks that previously required manual effort from a DevOps engineering team. If, for example, the observability platform is generating recommendations to address issues, there may be less of a need to create runbooks that DevOps teams typically create to address a wide range of known issues.

    Along with making it simpler to discern the root cause of an issue, AI also makes it possible for less experienced members of a DevOps team to resolve an issue using guidance generated by the observability platform, noted Yidal.

    In effect, AI technologies are reducing the cognitive load required to be an effective member of a DevOps team, he added.

    One way or another, it’s not so much a question of whether AI will be applied to DevOps as much as it is to the degree. Many of the manual tasks that often conspire to create DevOps bottlenecks should be significantly reduced in the months ahead as more advances are made. The challenge now is determining how best to reallocate DevOps expertise in anticipation of those advances.

    Of course, there’s always going to be some sense of trepidation when it comes to AI. However, many of the tasks that are about to become automated tend to be tedious. Many DevOps professionals would just as soon see those tasks become automated in the expectation that more time will become available to take on more complex challenges.

    Regardless of the motivation, the way IT is managed is about to change. There may be plenty of instances where AI does not live up to its initial hype, but as AI models are exposed to more data, they will become more accurate. That doesn’t mean, however, there won’t always be a need for a DevOps engineer to ensure those algorithms are behaving as expected.

  • Why You Need a Multi-Cloud and Multi-Region Deployment Strategy

    Why You Need a Multi-Cloud and Multi-Region Deployment Strategy

    As I began writing this article, I encountered some technical challenges in my attempt to provision three cloud providers in three separate regions to simulate multi-cloud and multi-region deployments.

    I couldn’t get one of the regions to behave as I expected when provisioning the environment. As it turned out, the region (and by association, cloud) was down due to a cut undersea cable, and it would take several weeks until the outage was mitigated.

    Fortunately, there are plenty of clouds in the sky to choose from, but this experience emphasized the importance of multi-cloud redundancy, especially in a production environment.

    This article examines the benefits of adopting a multi-region and multi-cloud deployment strategy for better resiliency, regulatory compliance and optimal user experience.

    Resilient Reasons to Choose Multi-Cloud and Multi-Region Architectures

    The first reason to choose a multi-cloud or multi-region environment is for data resilience. When our data is in a single region or on a single cluster, there is a good chance that you will experience data failure. You need a mitigation strategy if you want to keep the data lights on 24/7. These strategies fall into two buckets: Multi-region and multi-cloud.

    We first need to define the differences between multi-cloud and multi-region. The architectures are simply the implementation details of how we plan for one versus the other. However, depending on your database provider, those details can represent a significant time investment, which we’ll look at later.

    Multi-Region

    With multi-region, we typically deploy our applications to globally distributed regions. However, regional deploys are subjected to physical faults. Inclement weather, political unrest, acts of foreign or domestic terrorism and other physical variables have all led to regional outages in the past.

    Regardless of the cloud, the regions are exposed to similar physical faults. Instead of losing your data, we can switch to another region to handle the workload. Even though much as our industry hates latency, it is always preferred over loss.

    Deploying to multiple regions allows for failover handling. If the Sydney region goes down, Singapore may still be online. It would be a globally bad day if the same physical faults simultaneously impacted Frankfurt, Sydney and Seattle, for example.

    Multi-Cloud

    Physical faults are only one of the problems that public and private clouds encounter. User error, poorly configured networks and even banal errors can have substantial consequences that impact entire clouds, either from the provider or the user.

    In these circumstances, regional failover won’t help you. An expired certificate, accidental deletion or disabling the wrong port will take you offline, regardless of whether you’re in Seattle or Sydney. If that happens, someone somewhere is most definitely awake and is likely very unhappy.

    Choosing a multi-cloud configuration protects you from these types of faults so that if Google, for example, has interruptions, AWS is still online—or IBM, Deutsche Telekom, OVH or Hetzner.

    The Correct Answer: Deploy Both!

    Multi-region is a go-to method to mitigate against mostly physical faults. Multi-node clusters in each of those regions handle general data corruption or failures on a more granular level.

    Multi-cloud is a go-to method to mitigate configuration or software-level faults, which are not that uncommon.

    The correct answer is to blend the two, working within operational cost constraints and general survivable requirements from regulatory and business objective use cases. For example, I do want access to my heart-rate data from two years ago, but the order of browsing across Amazon shopping is less important.

    Regulatory Reasons for Multi-Region Architecture

    Apart from data resiliency, most companies serving a global market are subject to a number of geopolitical influences, as well. Most users will be familiar with the GDPR regulations ensuring European data stays on European soil. Further regulations require the ability for government oversight to request data at will from service providers, which requires its own set of reasonable isolation from those not in those jurisdictions.

    Using a multi-region database provider allows companies to ship single binaries of software without creating isolated applications for different countries—a practice that was the norm not too many years ago.

    Performant Reasons for Multi-Region Architecture

    Co-locating data and access provides the optimal pathway for getting a user’s data to the end destination. It goes without saying, but the less copper your data has to traverse, the faster the experience will be for your users. Retention and regulation aside, in many cases, you need to mitigate latency caused by region separation.

    It’s not just the individual user’s data. Imagine a sales enablement platform where an account executive needs to manage all of APAC or EMEA. If these accounts are optimally stored for reads on geo boundaries, you can remove seconds of delay between page navigations for your account manager. We all know how much account executives like to click!

    Choosing a DB Provider With Multi-Region and Multi-Cloud

    At this point, you should be convinced of the benefits of multi-region and multi-cloud deployments. But at what cost? Creating replication, failover, logging and synchronization mechanisms is a big, expensive ask. Even with deployment tooling, coordinating all the pieces for multi-region deploys is still a significant operational lift, let alone multi-cloud, where variables in APIs come into play.

    Choosing a single provider that deploys across regions and clouds means you get to benefit from their collective experience while reducing a significant burden.

    Having a database provider offer one-click multi-region deploys is the way to go, but you still need to handle the data access layer. The role-based access, federation and other settings that enable your developers still need to be distributed along with the underlying data sources.

    You need a provider that makes it simple to deploy the same configuration for horizontally scaled instances, leaving you to pick your geo router of choice to distribute the request to the nearest point of presence.

    Closing

    Multi-cloud and multi-region deployments provide significant redundancy, scalability and flexibility. Not only does this enable faster access times and improved reliability, but also provides the flexibility required to adapt to disruptions or unpredictable increases in traffic.

    Deploying multi-cloud and multi-region is no small feat–but the peace of mind and security it provides make it worth the effort.

  • Cloud Drift Detection With Policy-as-Code

    Cloud Drift Detection With Policy-as-Code

    Cloud configurations can change and change often. Introducing new technologies, releasing new features and supporting new business requirements entail a constant flow of configuration changes in web application development.

    However, drift occurs regardless of how well-designed your IaC implementation is. The term “drift” is used to denote a state in which the actual state of your infrastructure deviates from the configuration.

    This article examines cloud drift detection, why it occurs and how to remediate it.

    Understanding the Problem

    Cloud configurations are prone to change and can change frequently. Businesses often use infrastructure-as-code (IaC) to manage cloud provisioning changes. IaC makes it easier and more reliable for organizations to manage and facilitate changes to the cloud deployment process.

    However, inconsistencies in your IaC deployment process can lead to uncertainty about how and where your resources are provisioned, controlled and protected, resulting in lower productivity. No matter how robust your IaC implementation, drift can creep in.

    Changes to infrastructure that are made independently of the code responsible for provisioning can lead to considerable drift, and if not adequately monitored, can lead to significant security concerns.

    What is Drift?

    In the context of infrastructure and application management, drift refers to the system state in which the actual configuration and state of the system deviate from the intended or expected configuration and state.

    Drift can be caused by software updates, manual changes and incorrect configurations. Drift management is an essential aspect of infrastructure and application management. By detecting and correcting drift, organizations can ensure that their systems remain stable, secure and compliant with their policies and industry standards.

    Configuration Drift: Definition, Causes and Examples

    Configuration drift can creep in over time despite consistently building and configuring your servers. It refers to the state of the system when configuration changes are not in sync with the value previously set.

    For example, configuration drift can occur when you are yet to document the changes made to the production environment. This results in the production and staging environments getting out of sync.

    Some of the other causes of configuration drift are configuration changes because of applying patches and updating network equipment, the addition of new resources to the network and lack of clarity about the desired state of the system.

    You can leverage configuration drift management tools such as Netwrix and Aqua to detect configuration drift.

    Infrastructure Drift: Definition, Causes and Examples

    Infrastructure drift refers to a phenomenon in which the actual state of the infrastructure differs from its desired state because the defined configuration, settings or properties of the infrastructure and the actual state of the provisioned resources differ.

    Infrastructure drift may result from manual changes, updates outside of configuration management processes, conflicting IaC code, changes in network configurations, changes due to security settings and configuration differences during system upgrades and maintenance.

    To detect infrastructure drift, you can take advantage of infrastructure drift detection tools such as Terraform, CloudQuery and driftctl.

    Infrastructure Drift and Configuration Drift: How do they compare?

    Both configuration and infrastructure drift can lead to security vulnerabilities, compliance issues and operational challenges. Although infrastructure drift and configuration drift are related, they aren’t the same.

    Infrastructure drift refers to inconsistencies or discrepancies between the intended or desired state of the infrastructure and the actual state of the resources provided. Configuration drift refers to inconsistencies or discrepancies between the current configuration of a component or system and the intended or desired configuration.

    Infrastructure drift encompasses everything from physical components to virtual components to networks, storage and computing resources. Configuration drift, on the other hand, focuses on individual components or systems within the infrastructure and their configuration settings.

    What is Drift Detection?

    Drift detection in the context of cloud infrastructures typically compares the actual state of resources deployed in the cloud environment with the defined state described in IaC templates.

    Typically, this is automated by tools, scripts or services that analyze and compare configurations, resource states or event logs. These tools are adept at issuing notifications or alerts when discrepancies are detected.

    By detecting discrepancies, organizations can identify and resolve inconsistencies, security vulnerabilities and compliance violations. Consequently, the risks related to security breaches are reduced and remediation actions become easier to implement.

    Why Policy-as-Code for Cloud Drift Detection?

    Policy-as-code provides several benefits when used for cloud drift detection:

    • Early detection of drift: Policy-as-code helps detect drift early detection by comparing the current state of the cloud environment with the desired state defined in the policies. This helps identify problems and solve issues before they escalate to a catastrophic level.
    • Automated enforcement: Policy-as-code enables automated enforcement of policies, ensuring that the cloud environment complies with the defined rules and requirements. This helps reduce the potential risks associated with human errors.
    • Faster remediation: Policy-as-code enables faster remediation by automatically detecting drift and taking the necessary remediation actions such as rolling back changes, updating configurations or notifying relevant teams. This facilitates faster response times and reduces the risks associated with security breaches and downtime.
    • Enforce best practices, policies and guidelines: With policy-as-code, best practices, policies and security guidelines can be implemented automatically, reducing security and compliance risks.

    Steps for Drift Detection Using Policy-as-Code

    Here are the steps that you need to follow to detect and fix drift in your infrastructure:

    1. Define your policies: You should first define the policies that should be used to describe the desired state or the baseline of your cloud environment and cover security and compliance aspects of your cloud environment.
    2. Codify and deploy policies: Then these policies should be codified and stored in the version control system. The next step should be to deploy the policies to your cloud environment using a policy engine.
    3. Identify configuration changes: Once your policies have been deployed, the next step should be to identify any new resources that may introduce risks and compare them to the baseline you’ve defined.
    4. Evaluate and remediate: You should evaluate the state of the environment against the defined policies to detect any drift. As soon as any drift is detected, you should take corrective actions to remediate the issues by rolling back changes, updating configurations or notifying the relevant team members.
    5. Review policies: To ensure that the policies are up-to-date and relevant, it is imperative that you review them often and make changes to policies as needed.
    6. Update and deploy: The last step should be to update the code files and then deploy the solution yet again.

    Build a Successful Drift Detection Strategy

    Maintaining your infrastructure at the desired state, ensuring compliance and mitigating risks associated with configuration drifts requires a successful drift detection strategy. Here are key strategies you can adopt to build a successful drift detection strategy.

    Understand When Drift Becomes a Risk

    Drift can profoundly impact a system’s stability, security and compliance. When your server configuration deviates from its intended configuration, it might stop working or become vulnerable to security threats.

    Most importantly, this might be a significant threat to security if you don’t have proper monitoring in place. To prevent infrastructure drift and update your security tools, it is important to evaluate and communicate your adoption of IaC.

    Detecting Drift: Detecting drift Between IaC and the Cloud

    To mitigate the risks associated with drift, configurations that have been changed in real-time must be identified and reset. You can achieve this programmatically and continuously by comparing configuration changes between IaaS and IaC. Programmatically identifying the configuration changes, i.e., detecting the changes to the configuration using code, is the best strategy to reduce drift-related risks.

    From Drift Detection to Drift Remediation: Responding to drift

    By detecting drift, you’ve won half the battle–you should now devise strategies to remediate it. By keeping an eye on configuration drift and responding to it promptly, you ensure the consistency and reliability of your infrastructure, minimize security risks and keep your system in a consistent state.
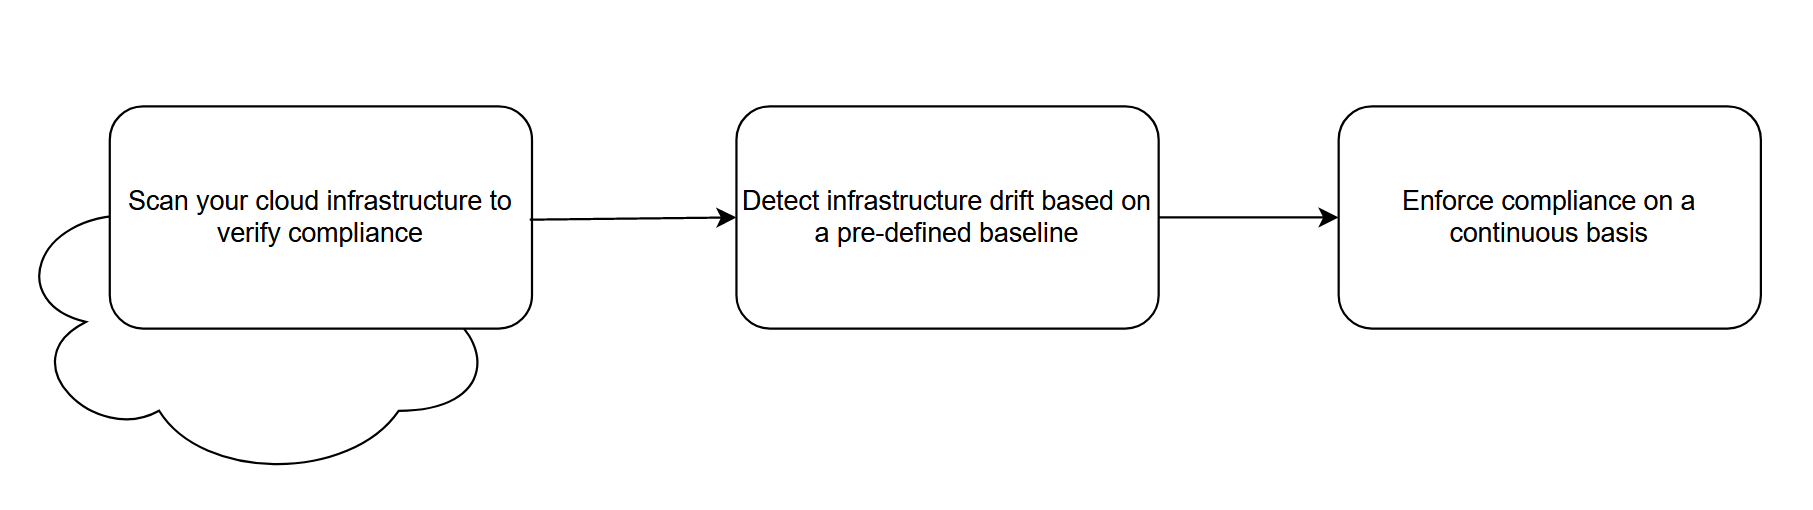
    Figure 1: Detect and Remediate Drift in the Cloud

    It’s important to have effective configuration drift response procedures in place to ensure the stability and security of your environment and also keep it effective for change management and control. You can respond to drift in the following ways:

    • Develop mechanisms to detect and report configuration drift
    • Understand the underlying causes of drift
    • Documenting the drift, including affected resources, configuration deviations and impacts
    • Resolve the configuration drift and return the system to the desired state
    • Following change management processes and obtaining approvals prior to implementing changes
    • Monitor the system to ensure drift has been resolved and the configuration remains stable

    Key Strategies for Detecting Drifts Between IaC and the Cloud

    There are a few strategies that can be adopted for detecting drift.

    Detect Configuration Changes That may Introduce Risks

    To identify configuration changes that can introduce risks, you should monitor and analyze changes proactively. Here are some of the key strategies to do so:

    • Create a baseline configuration for your system.
    • Review the system logs regularly for any suspicious or unexpected configuration changes.
    • To capture detailed information about configuration changes, comprehensive logging is helpful.
    • Implement a change management process for managing configuration changes.
    • Take advantage of automated configuration management tools such as Chef, Puppet, Ansible, etc.
    • Leverage threat intelligence to ensure that you are always up to speed on the most recent vulnerabilities, security threats and attack trends.
    • Conduct training to increase awareness about configuration changes’ potential consequences and risks.

    Establish Baselines and Safely Auto-Remediate Drift

    Establishing baselines and safely auto-remediating drift involves setting a reference point for the desired state of your infrastructure and automatically adjusting any detected drift back into compliance with the baseline.

    You can maintain the desired state of your infrastructure, reduce manual effort and quickly resolve configuration drift by establishing baselines and implementing security processes for automatic remediation.

    This minimizes the impact of drift on your systems while improving your environment’s security, compliance and stability.

    Track all Configuration Changes in Your Cloud Environment

    Tracking all configuration changes to your cloud environment is critical to maintaining visibility, accountability and security. It can help you improve visibility, detect unauthorized or unintended changes and maintain compliance and accountability.

    This way, you can proactively manage your cloud infrastructure, identify potential security risks and ensure its integrity and stability.

    Below are the key strategies for tracking cloud configuration changes at a glance:

    • Ensure detailed logging for all cloud components, including infrastructure, applications and security
    • Track API calls and activities within your cloud environment with cloud monitoring and auditing
    • Set up alerts and notifications for critical deviations from established baselines
    • Implement configuration changes through formal change management processes
    • Manage cloud configuration with tools such as AWS Config and Azure Automation

    Managing Drift in Production

    To effectively manage drift in production, it is crucial to consistently observe the configuration and state of production systems, keeping them in line with the policies that outline the desired state.

    Here are a few guidelines to help you reduce production drift:

    • Specify the required state: Define the intended state of the production environment as a set of policies using declarative compliance tools.
    • Monitor continuously: To determine any deviations, use a monitoring tool to monitor the production environment or compare the system’s present state to the desired state to identify any deviations.
    • Identify the root cause: If drift is detected, it is crucial to identify its root cause. You can do this by examining the logs, analyzing system performance or observing the configuration alterations over time.
    • Rectify the drift: After determining the issue’s root, you should address it to align its compliance with the intended state. To do this, you may need to examine logs, examine configuration changes, and analyze system performance.
    • Automate the remediation process: To ensure that drift is automatically and quickly rectified, you should automate the remediation process. To achieve this, you can leverage a declarative compliance tool that can help you automatically implement the changes to bring the system back into conformity with the intended state.
    • Review and update policies: You should review and revise your policies to ensure they are still relevant and useful and stay updated. To achieve this, you may need to adjust the policies to reflect new compliance requirements or shift your business requirements.

    Summary

    By identifying drift in cloud environments, organizations can use policy-as-code to ensure that their cloud infrastructure is safe, compliant and secure. In this way, they can ensure compliance with industry best practices, regulatory standards and internal policies. This reduces the risks associated with configuration deviations and enables enterprises to maintain a secure and reliable cloud environment.


  • Checkmarx Brings Generative AI to SAST and IaC Security Tools

    Checkmarx Brings Generative AI to SAST and IaC Security Tools

    Under an early access program, Checkmarx today made available query builder and guided automation tools that take advantage of OpenAI’s generative artificial intelligence (AI) technologies to make it simpler for developers to resolve application security issues.

    AI Guided Remediation surfaces actionable remediation recommendations for vulnerability issues such as misconfigurations directly from within integrated development environments (IDEs).

    Meanwhile, AI Query Builder makes it possible to use natural language text to create a query for both the Checkmarx static application security testing (SAST) and the infrastructure-as-code (IaC) security tool that creates rules for scanning code. Those rules can be easily fine-tuned or modified and queries for other use cases can easily be added.

    In addition to reducing the amount of time it takes to create a query by 65%, that approach also dramatically reduces the number of false positive alerts that arise based on rules created by a security administrator.

    Checkmarx CEO Sandeep Johri said these additions to the Checkmarx One Application Security Platform are aimed at improving the application security experience for developers. Most developers don’t want to be inundated by alerts that lack any real context, nor do they want to be bothered with remediation details.

    It’s not likely developers will be interested in how AI could help them write more secure code from the start, but the faster a reliable fix is surfaced, the sooner developers can return to writing code, noted Johri.

    In the longer term, Checkmarx will add support for multiple large language models (LLMs) beyond those provided by OpenAI to provide other AI capabilities that are based on more domain security knowledge, said Johri.

    However, despite these advances, vulnerability remediation will not become fully automated using AI any time soon, he added. Instead, it will become much simpler to identify code that has either inadvertently or deliberately introduced a vulnerability, said Johri.

    In fact, generative AI tools such as GitHub Copilot can themselves introduce vulnerabilities into code. As a general-purpose AI platform, the recommendations surfaced are based on a mix of instances of clean and flawed code, Johri noted. There will also be instances where cybercriminals attempt to subvert an LLM that creates code by injecting snippets loaded with malware into the samples used to train a generative AI model.

    On the plus side, however, generative AI tools should narrow the divide that currently exists between application developers and cybersecurity teams as more issues are discovered and remediated before applications are deployed in a production environment. The challenge has aways been surfacing application security issues at the time developers are writing code rather than sending them a list of vulnerabilities to address weeks (sometimes even months) after a developer has moved on to another project.

    Naturally, there is a lot of trepidation when it comes to all things generative AI; one area of certainty is that the benefits far outweigh the risks—especially when it comes to developing secure-by-default applications.

  • Is Your Monitoring Strategy Scalable?

    Is Your Monitoring Strategy Scalable?

    Every company is trying to get better insights into its operational effectiveness, and they are running into the same problem: Scale. So what does a scalable monitoring strategy look like and how can you safeguard against the most significant issue in observability?

    What is a Scalable Monitoring Strategy?

    We’ll begin by identifying the two things most impacted by scale: Cost and performance. Cost can be broken down into storage and computation. It is obvious that to hold more data, more storage is needed, but what about compute power? This is important because queries need to search through more data—and thus, use more compute power—to return a result.

    This creates a trade-off between performance and cost-effectiveness. It becomes more and more challenging to have queries that resolve instantly as the dataset increases, so engineers will often simply tolerate a performance decline. This further impacts usability and the general usefulness of the system. If it takes 10 seconds to resolve every query, you’ve just cut down your data discovery efficiency by a factor of 10.

    Scaling Means Performance and Cost-Effectiveness

    To scale a monitoring strategy, a wise architect needs to break this standoff between performance and cost and approach the problem like a data scientist. A scalable monitoring strategy starts with a simple question: What is the use case for this data?

    Some data is only ever ingested because it might be needed. It spends its entire lifetime undisturbed and is eventually compressed or deleted. On the other hand, some data is queried every minute of every day and is integral. Knowing how data is used means an engineer can decide the value of that data.

    In the battle to create a scalable monitoring strategy, there’s a three-step approach.

    Step One: Track Data Usage

    Which data is ingested and never queried? Which data never spends any time at rest? Build a map of how often data is consumed so that any strategic choices are informed by the use case.

    It is most common to group data into three different use cases:

    Frequent Access – Data that is constantly queried and needs to be available at a moment’s notice.

    Monitoring – Data that drives dashboards or trains machine learning models but which is largely useless after it has been processed.

    Compliance – Data that is held in case it is needed, but it is only queried sometimes. For example, audit logs.

    Step Two: Optimize Storage and Consumption

    Once the use case of data—whether it’s logs, metrics or traces—is understood, the next stage is to optimize. This means creating different storage and query solutions for the different usages we’ve seen above.

    Frequent Access – Rapid queries that can be optimized and tuned. OpenSearch is a good option, although management overhead can be painful, especially at scale.

    Monitoring – This is largely about transforming data. For example, ingesting logs, converting them into metrics and deleting the original log. This is very powerful because metrics take up far less space than logs and can be stored much more cost-effectively.

    Compliance – Low-cost storage like Amazon S3 is a good option, but this data must still be accessible, even if simply by reindexing.

    How Easy is it to Build These Capabilities?

    It is trivial to create an OpenSearch cluster, but it’s challenging to manage it at scale. Likewise, it’s simple to convert logs to metrics, but doing so in a performant way at scale is complex. Holding onto compliance logs as they scale near infinitely can be difficult, and reindexing this data is a non-trivial operation when dealing with large data volumes.

    However, the key takeaway from this analysis should be that these are capabilities that any organization should have if they intend to scale their monitoring solutions. If they can be attained through a SaaS vendor, then this is a serious option to consider because it enables companies to immediately take advantage of this capability without the upfront, unpredictable and often ongoing cost of in-house engineering.

  • The Metrics Disconnect Between Developers and IT Leaders

    The Metrics Disconnect Between Developers and IT Leaders

    A survey of 350 software developers found a majority (91%) of respondents are unhappy with the actual metrics leadership teams are measuring.

    The survey, conducted by Atomik Research on behalf of Uplevel, an enterprise intelligence platform provider, found the top metrics developers say should be tracked include hours worked (52%), work allocation (49%) and the amount of time they have to focus on writing code (46%).

    Unfortunately, the survey also revealed more than half of respondents (56%) reported that the CTOs that lead software development efforts make significant strategic decisions without realizing the negative impact on their team. They also often move people around on projects or tasks without knowing the full implications (51%) and overwork developers (44%).

    Just under a third (30%) noted their engineering leaders rely solely on gut feelings to measure the effectiveness of their teams, while a third of respondents observed most engineering roadblocks go unnoticed by leadership.

    Additionally, 96% noted that not knowing what their own leadership team is working on is detrimental to the larger team.

    Christina Forney, vice president of product management for Uplevel, said many CTOs clearly need to be more engaged. Developers don’t mind being measured, but they clearly want to be evaluated based on metrics that matter, she added.

    Managing software development teams has become a lot more challenging in an era where many developers are working remotely. IT leaders can no longer manage by walking around as easily as they once did, said Forney. Aligning workflows across a highly distributed team of developers is a challenge no matter how many communications platforms are used.

    Surprisingly, the Uplevel survey found more than half of respondents (54%) said they feel more productive in the office. More than a third (35%) also said they preferred some form of synchronous communication to engage with other members of their team versus 27% that preferred some form of asynchronous communication. A total of 38% said they preferred a mix.

    It’s no secret that despite long-standing commitments to automation, there are still a lot of manual processes in DevOps workflows that create bottlenecks. In an uncertain economy, however, there’s a lot more focus on developer productivity, so eliminating DevOps bottlenecks has become a major priority. The challenge is those bottlenecks are not as apparent to senior IT leaders, many of whom may have simply become inured to them over time.

    Regardless of how bottlenecks occurred, DevOps teams would be well-advised to reevaluate the metrics they track. Mean-time-to-recovery (MTTR), for example, is not as important a metric to the business as the amount of quality code that finds its way into a production environment.

    In theory, all the data required to track more meaningful metrics that could improve productivity already exists in the tools and platforms DevOps teams use to build and deploy an application. The challenge has been finding a way to automatically surface that data without adding yet another bottleneck to a DevOps workflow.