Category: Application Performance Management/Monitoring

  • State of Developer Experience Report Finds Growing API Reliance

    State of Developer Experience Report Finds Growing API Reliance

    Web APIs continue to grow in interest among developer users. APIs can empower new customer experiences and help engineers avoid rebuilding common functions. The technology is also powering microservices and headless architectures that we’ve seen gain more traction in recent years as enterprises become more composable.

    On the provider side, a web API strategy can enable co-creation in partner ecosystems and even open new revenue opportunities for the business. Yet, like any software-as-a-service (SaaS), APIs require great developer experiences to create quick onboarding journeys and easy ongoing maintenance.

    Nylas recently released its inaugural State of Developer Experience Report, detailing the key trends, technologies and priorities that are molding the modern developer experience. The study found increasing reliance on APIs and hopes to increase investment in API-driven technologies. I also met with Isaac Nassimi, SVP of product, Nylas, to explore the reasons behind some of these findings and to get his perspective on the API economy at large.

    Rising Importance of APIs

    As I’ve covered before, the number of APIs in the market has ballooned as more development teams have come to rely upon APIs to power new application functions. The largest companies, those with 10,000 or more employees, have more than 250 internal APIs, according to Rapid’s 2022 State of APIs report.

    Similarly, the Nylas study underlined the growing reliance on APIs. A full 98% of developers said they view APIs as a key contributor to helping them and their team get their work done. And 86% of developers said they expected their use of APIs to increase in 2023.

    According to Nassimi, APIs are something that’s become more and more prevalent over time. For example, in 1998, setting up a web server was pretty cumbersome. But nowadays, a junior developer can accomplish the task (and much more) with a few lines of code, he said. APIs abstract complexity and help leverage external infrastructure so you aren’t constantly reinventing the wheel. “They add more functionality and help outsource labor, thought and cognitive load,” explained Nassimi.

    APIs Bring Developer Experience Benefits

    Another possible reason to shift toward APIs is to handle escalating tool usage. Almost half (48%) of developers said they are either always or often overwhelmed by the number of tools they use daily. Simultaneously, 98% of developers said APIs would lessen the number of workplace tools they use daily. The study indicates that investment in APIs can increase automation and reduce the manual headaches of crafting new features by hand.

    For example, Nassimi describes creating a video transcoding service from scratch in a previous company. The entire engineering team had to dedicate months and months to the process, using muscles they hadn’t ever exercised. After much effort, they ditched their work and ended up just using an API. “It was a really good feeling to delete 200 lines of code,” said Nassimi. “If you do that five times, you reduce all these esoteric things you have to learn how to do in your company by an order of magnitude.”

    In addition to reducing headaches, APIs can also enable speed. For example, it can take over a year for three senior engineers to build an email or calendar integration without the help of an API, the report found. With an API, this integration timeline can be minuscule, said Nassimi. As a result, 95% of all respondents said they would like to see their company invest more heavily in APIs within the next year.

    Developer Experience Improvements

    Developers find speed to be the number one benefit when working with APIs. And to grant this speed, API providers must create a streamlined developer experience (DX). The speed of implementation can make the difference between a good DX and one that is not so good, and a significant contributor to this speed is familiarity. One DX hangup is that the API you use must function like the code you use in your own environment, said Nassimi.

    Although solid documentation and naming conventions should exist in the background, Nassimi shared that forcing developers to learn terminology about the thing the technology is abstracting is a lousy developer experience. Instead, installing SDKs in the unique language of choice, like TypeScript bindings, and using autocompletes to understand the SDK can grant a much better experience.

    Workflow automation and AI can also enhance developer experience, as it frees up time for engineers to be more productive. In fact, two out of three developers would like their company to invest in AI for workflow automation and to curate better user and customer experiences. And 72% of developers said they or their organization are currently using AI for data analytics and making sense of their data.

    However, when it comes to generative AI like ChatGPT and Bard, developers are less enthused—only 14% of developers reported it as a useful area that their companies should invest in over the next year. Although the headlines proclaim that generative AI will disrupt most aspects of modern work, the technology is still new and can produce errors and introduce potential security repercussions.

    Looking Through the Micro Lens

    Developers integrating with APIs will have various backgrounds and priorities. And although speed is an important consideration, providers should also understand where their workloads lie and what particular features they should be driving, said Nassimi. “You want to show off all endpoints and features, but if you narrow down to show users what they need to get started, you will close more deals,” he said.

    For more details, you can download a copy of Nylas’ State of Developer Experience 2023 behind an email gate here.

  • Spotify Adds More Plugins for Backstage Developer Portal

    Spotify Adds More Plugins for Backstage Developer Portal

    Spotify this week added additional plugins for its open source Backstage platform that is used to build developer portals. The new plugins make it simpler to address role-based access and access Insights, a tool from Spotify that tracks Backstage usage trends.

    In addition, Spotify is also enhancing a Soundcheck plugin for Backstage that is used to visualize and track development of software components. Forthcoming capabilities include a no-code interface that makes it possible to programmatically create checks of code without writing any code.

    DevOps teams will also be able to view, export and understand how teams and components are doing compared to established best practices and monitor trends, graphs and historical views, and receive notifications when levels change.

    Finally, Spotify is committing to adding additional integrations with third-party tools and platforms such as Snyk, Sonarqube and the open source Argo continuous delivery (CD) platform.

    There are now five plugins available via a Spotify Plugins for Backstage subscription service, and Spotify said more are planned.

    Meg Watson, a group product manager at Spotify, said Backstage has been gaining traction in cloud-native application environments that are especially challenging to develop using multiple tools. Because of Backstage, developers are not only more productive but turnover has also been reduced because developers are provided with a better experience, she noted.

    There’s a lot more focus than ever on developer productivity, which Backstage addresses by creating a catalog of blueprints that developers can readily consume rather than requiring them to build these capabilities themselves multiple times over. The goal is to create scaffolds that developers can consistently reuse across multiple application development projects.

    Backstage was donated to the Cloud Native Computing Foundation (CNCF) and is now being advanced by contributions from multiple vendors. Much of that focus is on lowering the barrier of adoption for the platform, said Watson. Specifically, Spotify is working on a QuickStart for Backstage edition of the platform that is simpler to install, she said.

    In general, Spotify is trying to strike a balance between centralizing the management of DevOps workflows and the need to enable developers to define workflows that are natural to them versus ones that have been imposed on them, added Watson.

    It’s not clear to what degree Backstage will help fuel the adoption of a shift toward platform engineering to centralize the management of DevOps tools and platforms. The concept of a portal through which developers can self-service their own needs may not be new, but as an open source project, Backstage has made it simpler for many organizations to achieve that goal.

    Just about every DevOps team is now being asked to find ways to help improve developer productivity at a time when many organizations are trying to do more with fewer resources. Regardless of the motivation, however, it’s apparent that DevOps workflows are continuing to evolve and mature.

    In the meantime, DevOps teams would be well-advised to eliminate as many bottlenecks as possible before they negatively impact developer productivity.

  • Grafana Labs Reins in Cost of Storing Observability Data

    Grafana Labs Reins in Cost of Storing Observability Data

    Grafana Labs today made available an ability to customize what observability data is collected via its managed cloud service. This capability can help reduce storage costs in addition to enhancing the dashboard Grafana provides to make it simpler to track metrics usage.

    Wayne Jin, vice president of product marketing for Grafana Labs, said both capabilities would make it easier for DevOps teams to track and ultimately reduce the cost of storing the time-series data collected via its cloud platform.

    As more DevOps teams use an observability platform to continuously collect metrics like traces and log data, they are discovering that the cost of storing all that high-cardinality data can easily spin out of control.

    Grafana Labs is now making available an Adaptive Metrics capability that enables DevOps teams to fine-tune what data is collected and stored. However, in the event of an issue, DevOps teams can also turn back on all data the platform can collect to aid an investigation of the root cause of disruption, noted Jin.

    The Cardinality Management dashboards Grafana Labs made available last year for paid tiers of its cloud service are now being made available to users of the free tier of service as well, Jin said. This will further help reduce storage costs by making it easier to identify metrics that are being collected but not used by anyone on the DevOps team, he added.

    The Adaptive Metrics aggregation engine can then be applied to transform these metrics at ingestion into lower cardinality versions. Unused or partially used labels are stripped from incoming metrics, reducing the total count of time-series data collected. Adaptive Metrics also recommends aggregations based on an organization’s historic usage patterns, and DevOps teams can choose which aggregation rules to apply. Dashboards, alerts and historic queries are guaranteed to continue to work as they did before aggregation, with no rewrites needed.

    Based on results reported by early users, Grafana Labs reported that Grafana Cloud Adaptive Metrics could eliminate an estimated 20-50% of the time-series data collected with no perceived impact on observability.

    The Grafana Cloud service relies on an instance of open source Grafana Mimir to store data collected in a format originally defined for the open source Prometheus monitoring tool. While Prometheus is widely employed in Kubernetes environments, it’s also starting to gain traction as a monitoring platform in legacy monolithic environments. The amount of data being collected via that platform over time is steadily increasing. The Grafana Labs approach makes it possible for DevOps teams to reduce that data whenever there is no usage that needs to be investigated, for example.

    It’s still early days as far as adoption of observability is concerned, but in uncertain economic times, there’s generally a lot more sensitivity to the total cost of IT. Many organizations are especially focused on reducing the cost of storing data in the cloud to rein in monthly spending on cloud services. Regardless of the motivation, collecting and storing data that isn’t needed is never the best use of cloud storage resources that, from a cost perspective, are just as finite in the cloud.

  • Consider Performance, Growth & Budget When Buying Data Analytics

    Consider Performance, Growth & Budget When Buying Data Analytics

    So, your business needs to invest in data analytics technology to improve efficiencies, competitive advantage or business outcomes. There are a ton of things to consider, but underlying each decision are three driving factors:

    • Performance – The need to meet service level agreements.
    • Growth – The need to accommodate success, as well as deal with inevitable industry changes.
    • Budget – The need to do both of the above while keeping costs low enough to not erode the profit gain from analytics.

    These three forces underpin nearly every technology selection decision, but what frequently isn’t noticed is how much these three drivers interact.

    1. Concurrency and Growth

    Test both for current levels of concurrency and the level you hope to achieve in the next few years as the organization grows.

    When evaluating benchmarks between vendors, consider that benchmarks are designed to make that company’s software look good. For example, if they are good at concurrency, you will see various levels of concurrency represented in the benchmark. If the benchmark shows only one workload at a time, or maybe ten, you can safely assume that concurrency is probably not something that technology is good at. Similarly, if the benchmark is done at 10 TB scale, the vendor probably isn’t that good at high-scale analytics.

    When bringing vendors in for a proof-of-concept, one mistake I’ve seen (more times than I can count) is testing the capabilities of the software with only one user at a time. People do not line up politely to use analytics one at a time.

    In addition to current levels of concurrency, over time, hopefully, the organization will grow, and the number of both internal analytics users and external customers will increase. Testing for the number of users you have now may not uncover problems that will invariably reveal themselves when a lot of people hit the system at once. The last thing your organization needs is to turn away customers because they’re overloading your systems.

    2. Performance & Price

    Evaluate price/performance, not performance alone.

    Everyone understands the importance of performance. Not one user has ever gone to a data architect or engineer and requested for their analytics to “please execute more slowly.” But performance isn’t simply how fast the analytical software can process queries, how fast the data pipelines can move data or how fast the response is between data input and reaction output. There’s also a monetary aspect of performance to bear in mind.

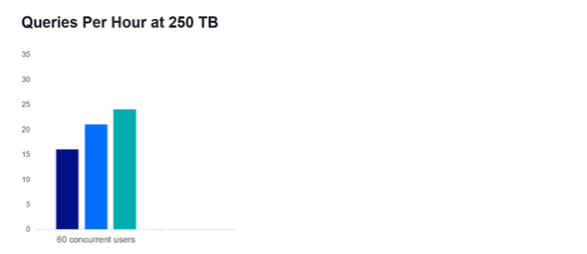
    In a recent benchmark, three data management and analytics stacks were compared with 60 simulated concurrent users/workloads. The difference in queries per hour on 250 TB of data was minor, perhaps 16 queries per hour for the slowest and 23 queries per hour for the fastest.

    (Mcknight Benchmark – SaaS Data Analytics Platform Comparison – vendor names removed)

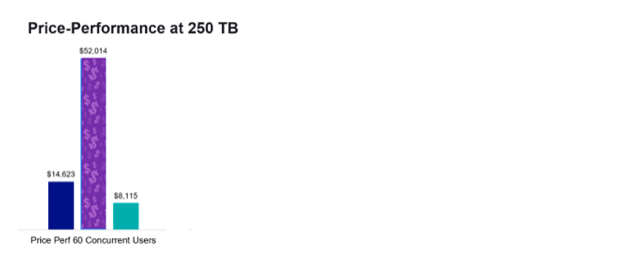
    It looks like performance is just not that big a consideration for this technology. But there is no such thing as an unlimited budget. Let’s look at how much it would cost to get this level of performance out of each stack.

    (Mcknight Benchmark – SaaS Data Analytics Platform Comparison – vendor names removed)

    Price-performance is a far more useful metric of value to the organization. How much the software can do is irrelevant if the budget limits how much the business can afford to do with it.

    3. Software Efficiency

    Consider how much efficiency and control you’re willing to trade for ease-of-use.

    When you analyze data in the cloud, you’re not just paying for software, you’re also paying for hardware, a.k.a. cloud compute instances. Bundling the two costs in one bill makes things easier. But it also means that cloud providers make more money the more instances, or compute nodes, you use. You trade ease-of-use in billing for a higher price. And they no longer have a financial incentive to provide efficient software.

    Similarly, to make a cloud-based analytics software scale up in performance and concurrency with zero effort on your part, the software has to use only defaults for all settings internally. It can scale only by throwing more compute at the problem; compute that you’re paying for every time you use it. You’re trading control of the software–tuning, scaling guidelines, shut down conditions, etc.–for ease-of-use, again for a higher price.

    Throwing more compute at a problem isn’t always the best solution. Recently, I saw a POC where the customer implementation included 278 EC2 nodes on Amazon cloud. The organization didn’t initiate the POC because of inefficiency. They were having performance problems, even with that much compute power. A competing product was able to run on only nine EC2 nodes with the same workload and better performance. The company was paying 25 times as much for the compute hardware because it was convenient.

    Be aware of the tradeoffs.

    4. Affordable Scalability

    Paying for only what you use can become impractical when you use more and more.

    The volume of data that is being created, consumed and captured is growing exponentially. By 2025, it is estimated that nearly 30% of data being generated will be real-time. Instead of pulling data in batches, data will be pulled in continuously. Queries will be responded to in seconds, not hours, or in milliseconds, not seconds.

    Going to the cloud can make tremendous sense when a company or a workload in that company is new. But studies show that as businesses scale and growth slows, the pressure the cloud puts on business margins eventually outweighs its benefits. This is why most enterprises today are considering repatriating some or all of their workloads off the cloud.

    5. Flexibility for Change

    Make certain your stack will continue to work even as conditions change, and you won’t have to rebuild from scratch to do the same thing in a different location.

    When you’re building a long-term architectural strategy, you want to ensure you cover as many bases as possible because, the fact is, you really don’t know what the future holds. Ten years ago, maybe you had a Hadoop on-premises strategy or a data warehouse appliance. Today, you may have a cloud-focused strategy. Tomorrow, maybe you’ll move some or all of those workloads back on-premises due to performance, security, costs, regulations or other reasons.

    This is why you want flexibility that doesn’t mandate a “cloud-only” or an “on-premises-only” or a “this-cloud-only” architecture and which doesn’t integrate with only the same vendors’ software. You want an architecture that can work equally well both on the cloud as well as on-premises, hybrid or multi-cloud, providing the flexibility of going where business needs are best met.

    Containerization offers possibly the highest level of flexibility in deployment, but it can also add to deployment complexity, so again, be aware of what you’re trading. If the software you choose is platform-agnostic—not tied to any particular location, ecosystem or deployment model—then that will make future choices a lot more flexible.

    Regardless of what analytics you choose, what you decide to build or what use cases you have to meet, striving for balance in performance, growth and budget will create a strong data architecture, now and for the future:

      1. The analytics architecture is high-performance: it should meet SLAs, get things done on time and meet or exceed expectations and requirements.
      2. The analytics architecture is resilient to growth and change; even if there is rapid growth or sudden or extreme changes, it’s future-ready.
      3. The analytics architecture should control costs and live within an allocated budget.

    Keep these guidelines in mind when choosing an analytics provider. The decisions you make today will have direct ramifications on the growth, profitability and success of the business tomorrow.

  • Observability Costs are too Damn High

    Observability Costs are too Damn High

    Today, any business that deploys software faces an obscene amount of expenses. It has to pay for cloud hosting, assuming of course that it’s among the 92% of companies that use the cloud. It needs trustworthy networks to connect its apps to its employees and customers. It probably pays for a suite of cybersecurity software in a bid to stay ahead of the ever-growing list of cybersecurity threats. All of these costs, which are unavoidable for any company that wants to host modern software, add up to higher overall IT bills.

    But there’s a source of excess spending that has grown tremendously in recent years: Observability. If a company deploys software, they also need to monitor and observe that software to ensure that it meets performance and availability requirements. In recent years, the cost of observability has skyrocketed.

    In fact, according to Charity Majors of Honeycomb, the total cost of observability at an organization today is equivalent to up to 30% of total infrastructure spending. That’s a truly astounding figure, if you think about it. For every dollar spent on the infrastructure that powers applications, 30 cents ends up paying just for the tools and services needed to make sure the apps running on that infrastructure are doing what they’re supposed to.

    On top of this, spending on observability tools has become very unpredictable, meaning companies have no idea what they are going to be paying next week, next month or next year to get the insights they need to manage their applications and infrastructure. In this sense, observability is worse than taxes. With taxes, at least you know ahead of time what you’re going to have to pay in most cases.

    Getting Observability Spending Under Control

    Observability costs won’t go down on their own,  but there are practical steps that organizations can take to get observability spending under control–and they can do it without sacrificing the critical visibility they need to manage complex systems.

    To prove the point, we’ll discuss the reasons why observability has become so expensive. It’s partly about technology, but it also has to do with who gets to make decisions about adopting observability tools and how cultural inertia inside organizations impedes the ability of practitioners to migrate to more cost-efficient observability solutions.

    Then, we’ll talk about actionable strategies for getting observability costs under control. By taking advantage of some new tools and strategies, observability spending can be reined in while also–and this is the best part–actually increasing the organization’s ability to observe and manage complex systems.

    Why Observability Costs so Much

    There’s no one simple reason why observability costs for the typical organization today have increased. Instead, several factors have conspired to bloat observability bills.

    Drowning in Data

    One issue is the sheer volume of observability data that organizations have to collect.

    That’s partly because businesses deploy so many individual applications–207 on average, according to Okta–each of which generates observability data, to say nothing of the infrastructure on which the apps are hosted. But it’s even more so because of the fact that cloud-native architectures have vastly increased the number of application components and services that we need to observe.

    Instead of having one monolithic app and one host server to monitor, today, companies might have two dozen microservices, a Kubernetes orchestration plane, a bunch of nodes and perhaps an underlying IaaS platform, all of which they have to observe just to keep a single app running healthily. That adds up to tremendously more observability data than businesses had to manage in the past.

    Viewed from one perspective, having more observability data is a good thing. The more data there is, and the more granularity that can be associated with particular parts of the stack, the more insights DevOps teams can glean, at least in theory. But the problem is that, in many cases, only a small fraction–perhaps as little as 1%–of the data that is collected and ingested into observability tools is actually ever used to detect or troubleshoot performance issues.

    Granted, part of the reason we collect so much data but use so little is that it’s impossible to know ahead of time which observability data we’ll actually need. But that’s not an excuse for paying for data that never serves a useful purpose. If we’re going to spend so much on observability data, we might as well use more of it while also finding ways to pay less for it.

    Inefficient Data Collection

    The problem of ever-growing data volumes is compounded by the challenge of inefficient data collectors, which translate to higher infrastructure costs.

    Here’s why: The traditional way to deploy observability tools is to rely on agent-based data collectors that run essentially as standalone applications alongside the applications they are monitoring. As a result, the observability agents suck up a non-insignificant amount of CPU and memory, which require more infrastructure resources to support them and, thus, higher costs.

    Hence, one of the grand ironies of our times: To figure out whether their applications are consuming resources efficiently, businesses deploy observability software that actually decreases resource efficiency, while also bloating costs.

    Complex Pricing Models

    The pricing models of the typical observability tool are, in a word, complex. Most vendors charge in part based on how much observability data is ingested into their tools (this is usually the biggest contributor to overall cost), but they might also charge based on how many agents are deployed, how many users the tool has within the organization, and which features are wanted to access. The costs might also vary depending on where the data is chosen to be stored, how long of a retention period, how often it needs to be accessed  and so on.

    Complex pricing makes it hard in many cases for organizations to cost-optimize their observability spending. Determining exactly which features and usage tiers are needed can be a tough job, and companies might easily end up overspending as a result (after all, who wants to risk underspending and ending up with observability gaps that lead to critical failures?). Plus, unlike, public cloud services, there are no cost-optimization tools designed to help businesses “rightsize” their observability tool deployments or architectures.

    Organizational Inertia

    Historically, most observability and APM solutions were designed first and foremost for developers. To use them, developers had to instrument observability into applications. Then, it fell on the operations or DevOps team to connect the apps to APM tools and figure out what to do with the observability data they generated.

    There’s nothing wrong with involving developers in the observability process. However, the pitfall of the developer-centric approach to APM and observability that organizations have tended to follow is that developers typically don’t actually know very much about what the operations team needs to observe. After all, developers build apps; they don’t monitor or troubleshoot them. The result of this is that developers design apps to generate all sorts of observability data that may or may not be useful (which is why, again, organizations end up paying for a whole bunch of data they don’t actually use).

    This might not be much of an issue if it were easy for the operations team to come in and say, “Hey, we’re collecting all this data and it’s dumb. Let’s be more strategic.” But sadly, it’s not. Organizations being organizations, effecting change is not easy, especially if the change means getting people to adopt new tools or practices. So, businesses end up stuck with observability solutions that may have worked well in the past, but that are not efficient by modern standards, due simply to organizational inertia.

    Cost Unpredictability

    As mentioned, the problem with observability costs today is not only that they’re too damn high. It’s also that they’re too damn unpredictable.

    Observability vendors don’t hide their costs, so those are easy enough to predict. But those costs, again, are based largely on how much data is ingested into the observability tool. And how many engineers do you know who can predict with any kind of accuracy how many logs and metrics their applications will generate from one day to the next?

    Most can’t because data volume is tied to application demand, and that’s inherently unpredictable. After all, if we knew exactly how many requests our applications were going to receive from one moment to the next, we probably wouldn’t really need observability at all. But we don’t, and part of the core purpose of observability tools is to ensure that we can detect the issues that arise due to unexpected software usage patterns.

    I am not exactly criticizing observability vendors here, but rather pointing out that their pricing models capitalize on a fundamental limitation of modern applications: The amount of observability data they’ll produce is unpredictable in most cases, which can lead to wild fluctuations in observability spending.

    Keeping Observability Costs in Check

    Just as there’s no one single cause of high or unpredictable observability costs, there’s no one trick that can rein the spending in. But there are several strategies that, used in unison, will bring observability costs under control:

    Analyze Data at the Source

    The more data is moved in order to observe it, the more it will end up costing. By the same token, the more data analyzed at its source, the lower the cost will be.

    This is why, for instance, Kubernetes observability will cost much less if the data is collected and analyzed right inside nodes, instead of shipping it out to an observability platform first. Not only will the results be faster (because there is no need to wait for the data to move) but data that isn’t critical will be able to be ignored , which reduces how much data is ingested into the observability tools and cuts down on overall costs.

    Keep Data at the Source

    In a similar vein, not all data needs to leave its source at all. There might be datathat needs to be kept handy in case it is needed later, but  can not be analyzed right now. Instead of moving it into external storage, which will cost more, it should be kept right where it originated – inside the nodes. It’s there if needed, but there is no need to  payi extra for it.

    Add Efficiency With eBPF

    I mentioned before the grand irony in which organizations end up wasting infrastructure resources to deploy observability tools: There’s a pretty simple solution for that. It’s called eBPF, and it’s an ultra-efficient way to collect observability data. Unlike conventional observability and APM software, eBPF data collectors run directly inside the operating system kernel instead of running as user space applications. That leads to much lower levels of CPU and memory consumption. With eBPF, there is  all the observability needed, without sacrificing resources in the process.

    Affordable Observability

    The cost of deploying software these days is going up overall, but observability costs can actually go in the opposite direction. Thanks to new observability tools and techniques, it’s possible to collect all of the data neeeded, without allocating a tremendous portion of the overall IT budget to it.

    So, say goodbye to bloated budgets, and say hello to affordable observability.

  • Black Box SLIs

    Black Box SLIs

    This article is a preview of a talk by Stephan Lips for SLOconf 2023, on May 15 – 18. To watch this talk and many more like it, register for free at sloconf.com.

    SLOs are fast becoming the industry standard to measure reliability and help teams decide when to prioritize it. The first step in adopting a service level objective (SLO) culture is to identify the metrics that matter without drowning in noise and alert fatigue. This article explores how to apply the black box concept to aggregate granular metrics into service level indicators (SLIs) that focus on the user experience as an indicator of system reliability.

    To SLI or Not to SLI

    In general terms, SLOs define targets for the proper level of reliability of a given product, such as a service or a website. SLOs are applied to or informed by SLIs. An SLI is a measurement determined over a metric, or a piece of data, representing some property of a service. And this is where we, as engineers, can get lost in the details, since the perpetual proximity to the systems we build and support often leads us to think of system reliability in technical terms or metrics (e.g., response time, error rate, throughput). While these are certainly valuable metrics, the user experience may be compromised even if the error rate is zero and the duration is well within SLOs. Consider, for example, the response data. Even if well-formed, it may not be current, or flat-out wrong. An error-free and quick response is of no value to a user that expects current and correct data. Error rate and response time remain valuable metrics and SLIs, but focusing exclusively on them would leave higher-level issues undetected.

    We could add freshness and correctness SLIs, but by doing so, we increase the number of signals we monitor. And with each signal—or SLI and associated SLO and error budget—we increase alert frequency and make reliability reports unnecessarily complex. In other words, adding SLIs may address a particular aspect of system reliability, but it also introduces additional complexities.

    Tales of Black and White Boxes

    So, let’s take a step back and borrow a concept from a related discipline: Quality engineering—in particular, software testing. Tests commonly fall into one of two categories: Black box tests or white box tests.

    In systems theory, the black box is an abstraction representing a class of concrete open systems that can be viewed solely in terms of its stimuli inputs and output reactions, without any knowledge of its internal workings. A given input is expected to result in a particular output, without any consideration for the processing steps. Common examples include end-to-end tests.

    White box tests, on the contrary, are designed with knowledge of, and to test, internal structures and workings of an application. Common examples include unit and integration tests.

    User Journey as Black Box

    Now that we understand the concept of black box versus white box tests, let’s apply it to our SLIs. As mentioned above, a good SLI considers the entire user journey. Conceptually, a user journey aligns with the black box paradigm: For a given input, a particular output is expected. For example, requests to our API (the “input”) result in responses that provide fresh data to clients within a given time frame (the “output,” including success criteria). There are several aspects worth mentioning with this SLI:

    ● The SLI is applied at a system level
    ● The SLI aggregates lower-level metrics implicitly and explicitly
    ● The SLI is binary; it is either true or false.

    These aspects combine to inform an SLI that represents the user experience (system level), via measuring many indicators by measuring only a few and supporting pass/fail attribution to an SLO target (by being binary). In other words, the user journey is measured as a black box SLI.

    White Box to Black Box: An Example

    Let’s consider a concrete example. A user requests a new account for a website. After the request is processed successfully, the user receives a confirmation email with an activation link. The user follows the link to activate the new account and log in. This workflow is visualized in the following sequence diagram.

    Of particular interest are the account creation and user notification via email steps. Both steps occur asynchronously. In particular, the event processing engine where the request for account creation is queued offers several opportunities for insightful SLIs: Queue length, average processing time, etc. Those SLIs, however, fall into the white box category: They contribute to the user experience, yet are opaque to the user (black box). The user journey begins with the initial request for account creation (input) and ends with the email containing the activation link (output). Rephrasing the example from earlier—a user-focused (black box) SLI could be a request for a new account (the ‘input’) that results in sending an email with a valid activation link within 1 minute (the ‘output’, incl. success criteria). This single high-level SLI aggregates several lower-level metrics; it measures many things by measuring only a few.

    Let’s switch to the engineering mindset mentioned in the introduction and assume the processing queue is stuck. The high-level black box SLI does not capture queue-specific metrics, suggesting a more granular SLI specific to queue size may be needed. However, white box metrics like this will affect the error budget burn of the aggregate SLO associated with the high-level black box SLI. Monitoring and observability tools will allow engineers to diagnose and troubleshoot particular issues, such as a stuck queue, while understanding the impact on system reliability (via the higher level, black box SLO’s error budget and burn rate). The solution to the stuck processing queue used in this example is not an SLI dedicated to the queue, but reliability-focused work to diagnose and correct the root cause of the queue getting stuck.

    Summary

    This article introduces an SLI thought model that uses a common paradigm from quality engineering. This thought model offers a different way to think about SLIs. It supports implementing the fundamental objective of SLIs and the associated reliability stack they inform: Ensure a positive and reliable user experience by measuring reliability and providing quantitative support for decisions on prioritizing development efforts. Only a happy user is a continuous user.

  • mabl Adds Load Testing Tool to Test Automation Suite

    mabl Adds Load Testing Tool to Test Automation Suite

    mabl today added a load testing capability to its portfolio of application testing tools that it makes available via a software-as-a-service (SaaS) platform.

    That capability promises to make it simpler to streamline testing within a DevOps workflow by making available load testing tools that measure application peformance alongside existing mabl tools accessible via a test automation platform.

    Dan Belcher, mabl CEO, said the goal is to make it simpler for developers to run functional and non-functional tests as early as possible within the software development life cycle.

    It’s not clear how much responsibility for testing is shifting left toward developers, but as it becomes simpler to run these tests it is more likely they will be run, noted Belcher. One of the core issues that plagues application development today is the inadequate level of testing. That issue is largely because it takes too much time to create and run relevant tests, he added.

    mabl streamlines that process using a test automation platform based on a low-code tool that makes it simpler to create and manage the testing process. Those tests can be configured to run independently or be integrated with a DevOps pipeline, noted Belcher.

    Shifting testing further left toward developers doesn’t eliminate the need for a dedicated team of testers, but it should reduce the number of routine errors being made. That reduction should free those development teams to focus more of their time and effort on more complex quality assurance (QA) issues, said Belcher.

    Of course, more testing processes will become automated as artificial intelligence (AI) continues to evolve, so most organizations will soon find themselves revamping those processes. In theory, SaaS platforms that aggregate testing data should be in a better position to apply AI models to testing. That’s critical because the pace at which even more complex applications are being built and deployed shows no sign of slowing down.

    In the meantime, DevOps teams should assume they will soon be held more accountable for security issues that arise after an application is deployed. It may be a while, but the number of legislative initiatives focused specifically on application security has increased; it’s only a matter of time before laws that hold organizations liable for security are going to be passed. At the same time, the level of tolerance application software consumers have for issues that arise because some trivial mistake led to, for example, a SQL injection attack, is dropping. The expectation is that application testing is soon going to be a lot more thorough than it has historically been.

    The issue, of course, is that too many development teams tend to view security requirements as obstacles to be overcome rather than as intrinsic elements of the QA process that is supposed to ensure expectations are consistently met and exceeded.

    At this juncture it’s clear that application testing is going to improve. The only thing left to determine now is how much friction will be experienced on the way to achieving that goal.

  • Honeycomb Taps ChatGPT to Simplify Observability

    Honeycomb Taps ChatGPT to Simplify Observability

    Honeycomb today added a Query Assistant to its observability platform that uses OpenAI’s ChatGPT generative artificial intelligence (AI) platform to launch queries via a natural language interface rather than having to master a query language.

    That capability complements an existing tool based on machine learning algorithms, dubbed BubbleUP, that DevOps teams already use to debug code.

    Honeycomb CTO Charity Majors said both tools make the Honeycomb observability platform more accessible to IT teams that are tasked with managing complex application environments. Those teams are not going to be able to accomplish that goal without relying more heavily on AI to determine the root causes of an issue.

    Generative AI augments DevOps teams by making it possible to build a relevant, modifiable query that they can continuously iterate as IT staff investigate an issue. This approach means teams don’t necessarily need a deep understanding of code behavior and the underlying infrastructure it depends on, noted Majors.

    That’s critical, because not every IT professional immediately knows what query to launch. One of the challenges with adopting any observability platform is they require a a DevOps team member to frame a query to generate a result. If multiple queries are required, coding them in a query language becomes a cumbersome task.

    As AI continues to improve, algorithms should be able to automatically surface more issues. But given all the dependencies that exist in modern application environments, there will still be a need for a DevOps specialist to ensure application availability and optimize performance, at least for the foreseeable future.

    In general, generative AI represents a significant leap forward compared to AI for IT operations (AIOps) platforms that, in comparison, are not nearly as useful, noted Majors.

    It’s still early days as far as measuring the impact AI will have on DevOps workflows. But the AI genie is already out of the proverbial bottle. Many of the low-level tasks that tend to make DevOps jobs tedious will soon be automated. As a result, job roles within DevOps teams will need to evolve.

    Less clear is what impact the rise of generative AI might have on the adoption of observability platforms. While there is no shortage of observability platforms, adoption has been limited by the number of DevOps professionals that could master a specific query language created for that observability platform. The ability to rely on a natural language interface instead reduces the need to use a proprietary query tool.

    In the longer term, the simpler it becomes to use DevOps best practices, the more widely they will be adopted. AI platforms should enable more organizations to embrace DevOps in a way that reduces the level of cognitive load currently required.

    In the meantime, there’s no doubt that current DevOps professionals are cautiously watching the rise of generative AI, much like everyone else. The difference is that most DevOps professionals are not going to want to work for organizations that don’t provide access to AI-infused tools and platforms that make their jobs easier.

  • New Relic Report Surfaces Spike in Amazon JDK Usage

    New Relic Report Surfaces Spike in Amazon JDK Usage

    An analysis of the Java applications observed by New Relic showed nearly one-third of organizations (31%) are using the Amazon Java development kit (JDK) compared to 28% using the Oracle JDK as more Java applications are built and deployed in the cloud.

    The report also found the number of Java applications running in containers is remaining steady year-over-year at 70%.

    Overall, the report published last week found more than 56% of applications are now using Java 11 in production, followed by Java 8 at nearly 33%. However, more than 9% of applications are now based on Java 17, representing a 430% growth rate.

    Jemiah Sius, director of developer relations for New Relic, said it’s clear that Java 17 is starting to gain traction in production environments. This is happening at a faster rate than previous releases of the venerable programming language as more cloud-native applications based on containers are being built and deployed, noted Sius.

    Regardless of the version of Java, it doesn’t appear developers are moving away from Java as they build cloud-native applications, noted Sius. Rather than requiring developers to learn a new programming language, it’s simply been more cost-effective to enable them to continue building applications using a programming language they already know.

    Java, meanwhile, has been experiencing a renaissance after more organizations began contributing to projects once the core platform became available under open source licenses. In fact, the Java community is now adopting many concepts pioneered in other programming languages to enable organizations to, for example, drive digital business transformation initiatives that are dependent on legacy applications being modernized. As a result, most organizations will continue to deploy Java applications everywhere from the network edge to the cloud.

    New Relic, of course, is betting that as more cloud-native applications are deployed, the need for an observability platform that addresses the needs of developers and IT operations teams alike will become more apparent.

    In general, most organizations are still in the early stages of achieving full-stack observability. A recent New Relic survey found only 27% of respondents have achieved full-stack observability and only 5% claimed they have a mature observability practice in place. A third (33%) of respondents also said they still primarily detect outages manually or based on complaints, the survey found.

    On the plus side, the survey also found nearly three-quarters of respondents said C-suite executives in their organization are advocates of observability and more than three-quarters of respondents (78%) saw observability as a key enabler for achieving core business goals. However, more than half (52%) of respondents said they experienced high-business-impact outages once per week or more and 29% said they take more than an hour to resolve those outages.

    The expectation is that that augmenting DevOps teams with observability tools and platforms that are increasingly being infused with artificial intelligence (AI) will reduce outages, even as cloud-native applications make IT environments even more complex than they already are. The issue is, however, those application environments are becoming more complex at a rate that is far exceeding the pace at which observability platforms are currently being adopted.

  • Mezmo Adds Free Community Plan for Managing Observability Data

    Mezmo Adds Free Community Plan for Managing Observability Data

    Mezmo this week added a free trial and a community plan for the Mezmo Telemetry Pipeline service to make it simpler for DevOps teams to store and manage the large amounts of telemetry data they are collecting.

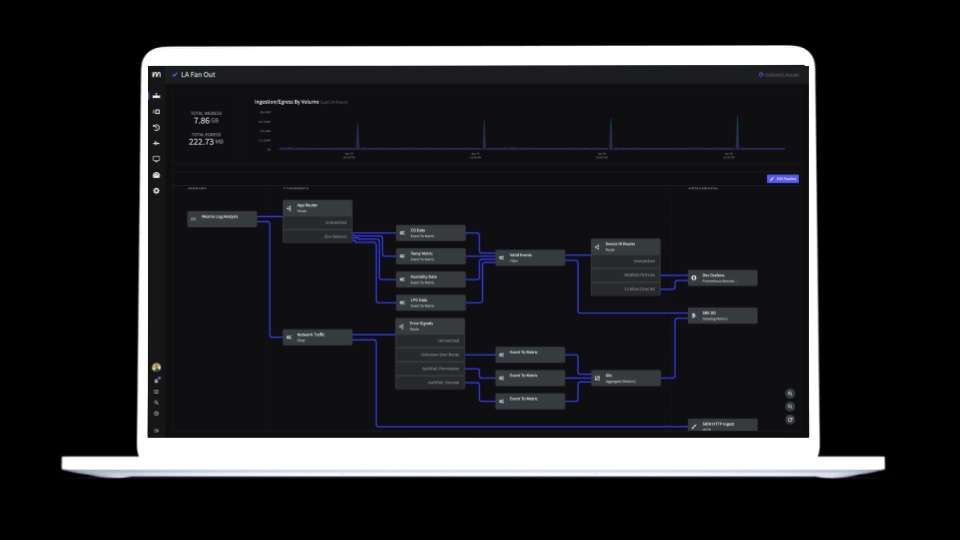
    Mezmo CEO Tucker Callaway said as more DevOps teams embrace observability to minimize disruptions to application environments, they are struggling to manage the explosion of data being created. The Mezmo platform makes it possible to apply data engineering best practices to manage that data using a set of drag-and-drop visual tools, he added. A set of data transformation tools also makes it simpler to extract metrics embedded in the logs, summarize events and metrics and then forward those metrics to downstream platforms for analysis.

    The free edition of the platform makes it possible for organizations to begin to apply those capabilities without any upfront costs required, noted Callaway.

    It’s not clear to what degree DevOps teams may need to add data engineering to manage all the telemetry data being collected. It’s already apparent that the cost of storing and managing all that data is becoming a significant issue as more applications are instrumented. In fact, it’s nearly impossible to manage cloud-native applications without being able to observe interactions between the microservices used to construct them.

    Log management has always been a challenge, but with the addition of traces, the amount of telemetry data being collected to surface metrics has increased. The Mezmo platform makes it possible to set a daily or monthly hard limit on the volume of logs stored or, alternatively, set soft daily or monthly quotas that can apply throttling logic to ensure mission-critical log data will continue to flow.

    DevOps teams can also make use of soft limits to reallocate storage resources from one team to another based on how much log data might be generated for a specific amount of time.

    Reducing storage costs has naturally become a higher priority during challenging economic times, so there’s a lot more pressure for DevOps teams to be more efficient. Finance teams are reducing costs by, for example, applying quotas to the amount of storage resources being made available to individual DevOps teams. The days when cloud storage resources were made available indiscriminately are over.

    It’s not clear how quickly DevOps teams are embracing observability, but it is certain that relying on predefined metrics to monitor IT environments is no longer sufficient. DevOps teams need to be able to query telemetry data to, for example, identify bottlenecks that are often created by dependencies between microservices. The issue is striking a balance between the amount of data being collected and the cost of storing it all.

    Regardless of approach, observability is rapidly becoming a requirement for DevOps teams to succeed. In fact, there is already no shortage of observability platforms to choose from. The issue is that not every observability platform provider is equally concerned about the cost of storing all the data being collected.