Category: Application Performance Management/Monitoring

  • ClickUp Adds Project Management Templates to Invoke ChatGPT

    ClickUp Adds Project Management Templates to Invoke ChatGPT

    ClickUp is adding templates and collaboration tools to make it easier to access generative artificial intelligence platforms such as ChatGPT from within its project management application.

    Haris Butt, head of product design for ClickUp, said ClickUp AI now includes pre-built department-specific prompts that any product managers, developers or designers can easily access rather than having to develop prompt engineering skills to engage a generative AI platform more effectively.

    The templates, for example, make it simpler to produce summaries of project timelines in addition to the ability to automatically generate a whiteboard that lists tasks that need to be finished to complete a project.

    In the longer term, ClickUp is also moving toward developing its own large language model (LLM) using its own data to provide a generative AI experience specifically optimized for project management, added Butt.

    ClickUp is embedding AI into project management applications as part of an effort to eliminate drudgery, added Butt. One of the primary issues that makes project management challenging is that navigating workflows can be challenging, especially for stakeholders that might not be as well versed in, for example, how a Gantt chart flows.

    It’s still early days as far as generative AI is concerned, but it’s already apparent that a wide range of templates are being developed to make it simpler to invoke these platforms. The need for project managers to become well-versed in all the nuances of prompt engineering techniques to optimize generative AI queries is likely to be limited.

    In fact, the general expectation is that every application will eventually include templates for invoking generative AI capabilities. Less clear is the impact that should have on productivity. In the case of DevOps teams, however, many tedious project management tasks should become increasingly automated.

    Generative AI will, of course, soon be employed across the entire DevOps workflow. Many of the tasks that have historically conspired to make DevOps processes tedious will be automated. In fact, many application developers are already using AI to test and review code. DevOps teams that have historically advocated ruthless approaches to automation are likely to be at the forefront of AI adoption.

    There are, of course, concerns about the accuracy of generative AI platforms such as ChatGPT that have been trained using data that hasn’t always been verified. As a result, it’s possible that some of the results being surfaced by these platforms should be reviewed by humans before being acted on. However, LLMs trained on narrower ranges of validated data will soon become commonplace. As those AI advances are made, the accuracy of generative AI platforms that are optimized for specific use cases will increase.

    In the meantime, DevOps teams should be more concerned about being left behind than about how generative AI impacts their employment prospects. There is no doubt generative AI will transform DevOps workflows along with a wide range of processes. The issue now is determining where DevOps teams can add value—and where machines can’t—in an era where IT environments are becoming more complex with each passing day.

  • Device42 Brings Power and Carbon Emission Tracking to IT Asset Management

    Device42 Brings Power and Carbon Emission Tracking to IT Asset Management

    Device42 today made available a power and CO2 Summary Dashboard to its agentless platform that employs machine learning algorithms to discover and track IT assets.

    Raj Jalan, Device42 CEO, said the dashboard makes it possible for IT teams to combine the tracking of assets and associated dependencies with a capability that enables them to reduce power consumption costs and levels of carbon emissions.

    It’s not clear yet how carbon emission tracking will be integrating into IT management frameworks, but as sustainability becomes a more pressing issue, it’s only a matter of time before IT teams will be required to monitor power consumption and associated carbon emissions more closely, said Jalan.

    The Device42 dashboard simplifies that task by identifying carbon emissions by location, business unit, vendor or application. Armed with that data, it then becomes possible to consolidate servers and applications or move workloads to more efficient platforms, added Jalan.

    Arguably, the biggest challenge when it comes to managing IT infrastructure is the number of organizations that are still using spreadsheets to do so. The Device42 approach to discovery and assessment uses the application programming interfaces (APIs) exposed by cloud services providers and IT vendors. Once mapped, it then becomes possible for IT teams to use a search function to uncover, for example, dependencies between multiple services.

    In theory, it should be possible for DevOps teams to also programmatically implement policies based on the Device 42 data to move workloads in way that reduce IT infrastructure costs. Over the years, many organizations have lost track of how workloads have been deployed in, for example, cloud computing environments—only to discover a surprise expense at the end of the month.

    In fact, one of the hottest segments of IT these days is the emergence of financial operations (FinOps) as a discipline to control cloud computing costs. Fundamentally, FinOps is the discipline that promotes a shared responsibility for an organization’s cloud computing infrastructure and costs. Rather than having disparate procurement teams working in silos to identify and approve costs, business, financial and IT leaders establish policies and best practices for usage that are programmatically enforced.

    It’s still early days as far as the adoption of FinOps is concerned, but adding that capability first requires a deep appreciation for what IT assets are being used to run which workloads. From there, it then becomes possible to not only optimize usage but also reduce both electricity costs and carbon emissions.

    Of course, the tracking of carbon emissions right now is a bigger issue in Europe and elsewhere than it is in the U.S. However, a global framework for trading carbon credits is now impacting IT teams as organizations look to minimize their carbon footprints. Sustainability has become an economic issue.

    In the meantime, DevOps teams should expect that soon, power consumption and carbon emissions will be added to the list of metrics they are measured on.

  • Implementing SLOs-as-Code: A Case Study

    Implementing SLOs-as-Code: A Case Study

    This article was co-authored by Stephan Lips, Devin Cunningham and Justin Hoang of Procore and is a preview of their talk for SLOconf 2023 on May 15-18, 2023. To watch this talk and many more like it, register for free at sloconf.com.

    By managing service level objectives (SLOs) as code, we can co-locate SLO definitions and ownership with the product code and team. This supports horizontal scaling of SLO ownership while establishing a single source of truth and adding transparency, integrating with the code management process, and creating an audit trail for SLOs.

    When you measure the reliability of hundreds or even thousands of products and services across an enterprise, ownership of SLOs should not reside with a single team. There are a few aspects that make scaling SLO ownership horizontally across teams much more efficient: A standardized SLO management platform, process architecture and automation across the enterprise. Managing SLOs-as-code alongside product code is a step towards 360° product ownership and enables us to automate SLO updates via continuous integration.

    Objectives and Architecture

    The larger objective behind the SLOs-as-code approach is to move towards 360° product ownership. At Procore, teams own their product’s code and processes, including aspects like testing, performance, reliability, automated deployment pipelines and deployment configurations. Adding SLO ownership to a team’s portfolio will also help improve product reliability.

    Implementing SLOs-as-code involves three architectural components, which will be discussed in detail in their own respective sections. In summary, these components are:

    • SLO objects and definitions: Standardized SLOs and related resources facilitate centralized management and automation.
    • Automation: SLOs as code are our single and reproducible source of truth, which we automate via Continuous Integration.
    • A common platform: Nobl9 is the SLO management platform upon which SLOs, related resources, and automation are built. It aggregates the various data streams that power SLIs.

    SLO Objects and Definitions

    Procore’s Observability team has designed our SLO-as-code approach to scale with Procore’s growing number of teams and services. Choosing YAML as the source of truth allows Procore a scalable approach for the company through centralized automation. Following the examples put forth by openslo.com and embracing a ubiquitous language like YAML helps avoid adding the complexities of Terraform for development teams and is easier to embed in every team’s directories. We used a GitOps approach to infrastructure-as-code (IaC) to create and maintain our Nobl9 resources.

    The Nobl9 resources can be defined as YAML configuration (config) files. In particular, one can declaratively define a resource’s properties (in the config file) and have a tool read and process that into a live and running resource. It’s important to draw a distinction between the resource and its configuration, as we’ll be discussing both throughout this article. All resources, from projects (the primary grouping of resources in Nobl9) to SLOs, can be defined through YAML.

    Figure 2. A simple visualization of Nobl9 object relationships. A Project is a top-level object. Projects contain Services, SLOs are attached to Services, and SLOs can trigger alerts via project-scoped Alert Policies. Finally, Role Bindings define who has access to the Project contents.

    Procore adopted a hybrid approach to organizing our Nobl9 configuration so that the observability team can review systemic changes while teams still own changes to their service SLOs. A separate central repository is the source of truth for all other Nobl9 configurations, such as Project and Alert Policy definitions. As projects have a one-to-many relationship with their services, it would quickly become a game of “guess where” if the project configuration were defined within one of its service repositories. The central repository is owned by the observability team and allows us to manage permissions through pull request reviews submitted by product teams for their non-SLO Nobl9 resources. Once requests are merged, our automation applies the changes. The SLO definitions are co-located with the service’s code. Teams self-regulate these resources to maintain their SLOs internally.

    Automation

    Automating the creation and modification of Nobl9 resources is essential to Procore — it makes iterating on the deployment process quick and painless for our engineering teams. Automation removes human error and possible complications that usually come along with manually applying config files via CLI tools.

    With that in mind, the observability team created a CI job/workflow that our engineering teams copy into their project repo during their SLOs-as-code onboarding. Procore’s CI job uses the Nobl9 sloctl docker image, so we do not have to install the sloctl CLI tool in our CI containers. We configured this job to only apply the configs that have been added or updated, which helps to future-proof our pipeline as we scale the number of our SLO configs.

    Figure 3: SLOs-as-code Automation Workflow

    This requires the following steps in the workflow:

    1. An engineer creates or modifies a config and commits the changes to GitHub.
    2. The engineer opens a PR, gets reviews and merges their changes into the main branch.
    3. CI picks up the changes in GitHub and kicks off the following steps:
      1. Using git diff and regex pattern matching, we figure out what configs have been added or changed from the most recent merge to main:

    #!/bin/bash
    ADDED_OR_CHANGED_CONFIGS=$(git diff –name-only –diff-filter=d HEAD^ HEAD | { grep -E “^${NOBL9_RESOURCE_DIR}\/.*\.y[a]?ml$” || :; })

    2. We loop over the added/changed configs and run sloctl apply using the nobl9/sloctl docker image, which updates our resources in Nobl9:

    #!/bin/bash
    for file in “$ADDED_OR_CHANGED_CONFIGS”
    do
      docker run nobl9/sloctl:v0.0.80 apply -f “$file”
    done

    3. We use the same workflow in our centralized IaC repo that manages our projects, services, role-binding and alert policy configs.

    Common Platform

    Our platform requires another key feature for SLOs-as-code to work: We need to be able to consolidate different observability data sources and telemetry streams that power SLIs. This platform needs to support standardized data formats to define SLOs and related entities, such as alert policies for different conditions and trends, while allowing for the management of these formats via automation. We evaluated three vendors that offered SLO solutions, and only Nobl9 met all our requirements, which extended beyond the SLOs-as-code topic of this article.

    Observations

    Adopting SLOs-as-code can be impeded by three particular barriers of entry: New tooling (Nobl9 platform), data and format (SLO configs and resources) and process. To drive adoption, we have designed a self-service model supported by an open-door consulting practice. While this is an ongoing learning process for all involved, we are seeing early signs of success of an approach that uses:

    • Detailed, step-by-step instructions, including code snippets and templates.
    • Screencast tutorials supplementing the instructions.
    • Initial face-to-face, white-glove meetings to explain concepts and provide demos. The personal experience and conversation in our experience created considerable enthusiasm and goodwill among our teams. It proved to be a much better approach than just pointing them to documentation.
    • Fast feedback cycles with onboarding teams to improve instructions.

    Quite frequently, teams stated their primary challenges were not the technical aspects of SLOs-as-code discussed in this article, but how to design and improve on meaningful SLOs. We addressed this by authoring articles like Black Box SLIs and other internal resources for guidance. While posts can be a useful tool, we found that working with teams and discussing how their product impacts the user experience was more beneficial to modeling their SLOs using observability data.

    Last but not least, we are integrating with our embedded SRE (ESRE) team to help onboard more services. When a product team engages with ESRE on their deployment strategy and configuration, ESRE also discusses onboarding to SLOs-as-code and basic SLOs, such as error rate or duration.

  • InfluxData Makes Processing Observability Data at Scale More Efficient

    InfluxData Makes Processing Observability Data at Scale More Efficient

    InfluxData today made available an update to its open source time series database that can now analyze metric, event and trace data in a single datastore with unlimited cardinality in terms of how they are aggregated.

    The company is now making available a single-tenant instance of InfluxDB as a managed service alongside its already-existing multi-tenant cloud service that is based on a serverless architecture.

    Finally, InfluxData also announced that later this year it will make available InfluxDB 3.0 Clustered and InfluxDB 3.0 Edge to provide a curated version of the database that organizations can deploy themselves where they best see fit.

    InfluxData CEO Evan Kaplan said InfluxDB has been developed to support a wide range of emerging applications that require access to time series data, including the observability platforms core to DevOps workflows that require visibility into metrics, events and trace data.

    Over the past three years, InfluxDB has been revamped to run on a columnar engine, dubbed IOx, that leverages the open source Apache Arrow memory format and written in the Rust programming language. Kaplan said that approach makes it possible to continuously ingest, transform and analyze hundreds of millions of time series data points per second without limitations.

    At the same time, InfluxDB takes advantage of high compression object storage to reduce the total cost of storing all that data. It also provides interoperability with Open Data Architecture (ODA) to integrate with data lakes based on open source platforms such as DataFusion, Flight SQL and Parquet that are being advanced by the Apache Software Foundation.

    The arrival of version 3.0 of InfluxDB comes as many DevOps teams are starting to struggle with the amount of observability data being generated. DevOps teams want to be able to move beyond monitoring a set of pre-defined metrics and query data in a way that enables them to surface anomalies indicative of a potential issue before there is a major disruption to an application service.

    One of the major challenges today is the tradeoff between how much data is collected and analyzed versus the cost of processing and storing it. InfluxDB provides a mechanism for analyzing high cardinality data involving metrics, events and traces cost-effectively.

    Observability is, of course, only one of several use cases for a time series database capable of processing data in near-real-time. As organizations embrace digital business transformation initiatives, they need to be able to process data in near-real-time at the point where it is being created and consumed. Those applications won’t necessarily replace existing applications based on batch-oriented processing but, over time, they create two distinct classes of applications that process data in fundamentally different ways. The challenge, as always, will be defining the DevOps workflows required to manage applications running on multiple distinct types of architectures.

  • You’re Already a Distributed Developer

    You’re Already a Distributed Developer

    For many coders, the idea of distributed systems development might seem like a dark art. They think of high-performance computing wizards crafting mysterious spells with job schedulers to work magic with hundreds of connected nodes in massively-parallel systems. Or large, distributed content delivery networks that balance resources to deliver content across the world no matter how high the demand. The folks doing those jobs have often worked in specialist distributed computing environments for years. But the complex problems they face at a massive scale aren’t so different from those that you deal with every day. In short, you’re a distributed developer too. It’s just that no one bothered to tell you.

    Everything is Distributed

    The world is a lot more distributed today than it used to be. Back in the day, code would talk directly to one mainframe or microcomputer, generally on the same LAN. Your PDP-11 and your batch order processing software had an intimate, exclusive kind of relationship.

    Computing environments began to change with the advent of open computing in the late eighties. It ushered in the era of multiple computers working together other over a network. The concept continued to evolve beyond PCs. Now phones, servers and smart kettles all expect an easy way to talk to each other.

    Today, distributed operation is so ubiquitous that people barely see it happening. When you type anything into a browser, it fires off dozens of queries to different backend systems owned by different organizations. These systems generally run on different infrastructure.

    Even a small application that makes a database query is a distributed system. The application often talks to a system—or even multiple systems—halfway around the world.

    Many apps these days are compositions of multiple API calls to different online services. When a developer gathers weather data from a service provider and feeds it into a cloud-based online geographical information system that decides how much to irrigate crops in Iowa tomorrow, what is that if not a distributed query?

    Software is becoming more distributed over time. As software became more complex, developers have long wanted to carve it up into smaller pieces. This began in earnest with the software component movement around CORBA in the mid-to-late nineties, gravitating to XML web services in the early noughts and then to RESTful APIs. All of these involved forms of remote procedure call to increasingly granular services.

    In the last decade, this atomization of monolithic software has become the norm rather than the exception. Container-based architectures ushered in the use of microservices for better development agility and maintenance. Most developers that started their careers in the last five years or so will have been forced to think about how these services communicate from the outset. Distributed design patterns are a fact of everyday life.

    And it’s Still Difficult

    While your distributed applications might not be as complex as those facing HPC and hyperscale services, they still come with some challenges that increase as systems become more granular. What happens if a remote API takes longer than expected to deliver a result because it is overloaded, meaning that API queries to different systems arrive in a different sequence than expected? How should you react if a network or system outage or an expired access key prevents an API from responding at all?

    Problems like these arise unexpectedly, meaning that you have to get more creative with code from the outset. Good developers do more than master object-relational mapping and send queries. They program defensively to ensure that their programs retry steps when a failure somewhere else delays that job or stops it altogether.

    There are different design patterns to handle most common distributed programming scenarios today, even though you might not think of them as such. For example, developers have been building load-balancing code into their applications for decades, distributing requests between different servers to maintain performance.

    Anyone who has tried to maintain transaction integrity when writing to multiple databases will also have dabbled in two-phase commit design, which ensures that all of the databases get updated (or that none of them do).

    The more experienced you get, the more complex and esoteric these patterns become. At some point, many developers move beyond basic CRUD models in their applications to handle more complexity when reading and writing data. For example, they might read data from a website in one format but collapse multiple records into one when writing data to the website’s back-end store. That means writing code that creates different types of read and write queries. That pattern, called command and query responsibility segregation (CQRS), is also a form of distributed programming.

    Then, there’s the Saga pattern, which people use to maintain application state across long-running processes comprising multiple transactions. This pattern relies on an event bus along with messaging and queuing code to handle services with unpredictable delays in response times. It ensures that the overall process transaction finishes in an acceptable state or rolls back.

    As you venture into more sophisticated patterns that hold transactions together while maintaining performance, you’ll find your code becoming more complex and, therefore, application development becoming more difficult. Such is the life of a distributed developer, even if you didn’t realize that you were one until now.

    Gaining this knowledge and experience as a developer is important, but once learned the hard way, you don’t have to keep doing it manually. There are technology solutions that manage some of these complex distributed patterns for you. As the volume of plumbing code to support distributed design patterns increases, so does the need to offload it. In an industry increasingly built on abstraction, it’s time to turn distributed systems management into a separate service and unburden your code.

    And—if you’re looking for an example platform specifically designed to address this issue—check out Temporal, a completely open-source (MIT license) microservice orchestration platform which enables developers to build scalable applications without sacrificing productivity or reliability.


  • The Fallacy of Continuous Integration, Delivery and Testing

    The Fallacy of Continuous Integration, Delivery and Testing

    We know that continuous integration and continuous delivery (CI/CD) have become a DevOps best practice. And many have learned that by adding continuous testing (CT), they can create a virtuous loop, ensuring perpetual code quality and security. They’re not wrong.  Yes, testing continuously is good practice, but some incorrectly equate the concept of continuous with monitoring, thinking they’re able to see everything that could eventually affect a customer’s experience (CX) with their software application. That’s a fallacy. Many of the most glaring blind spots that wreak havoc on CX exist outside the environment that CI/CD/CT is able to “see.” CI/CD/CT, even when supported by application performance monitoring (APM), doesn’t and cannot monitor for and alert to blind spots across the internet stack. And there are many. Only internet performance monitoring (IPM) can take CI/CD/CT as input streams and shift to continuous resilience as a measurable outcome.

    How CI/CD/CT Typically Works

    As customer requirements evolve, software development teams write code that triggers a new software build. In the continuous model, each new build moves to a runtime environment for integration and quality assurance and, ultimately, is deployed to end users across public or hybrid clouds. This is an application-specific view of the world.

    Since quality assurance is part of the typical continuous process, monitoring is an assumed benefit or outcome. This assumption might be because many now complement their CI/CD/CT processes with APM. What is achieved with APM in this approach is testing, not monitoring. While testing provides a better picture of performance at the application level, it doesn’t provide full visibility into the blind spots that exist between the application layer and the end user.

    APM Isn’t Enough

    While APM tools focus on code—including everything that negatively affects an application such as database wait times and inefficient code—IPM focuses on the internet, which has become your network. IPM monitors what impacts your customers, workforce or application (API) experiences across the internet.

    While APM and IPM may seem similar, they are nothing alike. They may share common tools, such as using synthetic agents, but the difference is in what they monitor and how. In this age of highly distributed applications, that difference means everything.

    Where APM can “simulate” what a user may see from cloud location to cloud location, which can confirm application performance, this simulation isn’t true or comprehensive monitoring because it is blind to network-related problems with end-user experience, which are vast. Customers and employees each have a unique internet performance fingerprint and access applications from myriad devices across multiple locations and network infrastructures, not through the individual cloud locations that APM synthetics simulate.

    IPM approaches synthetic testing more holistically, replicating multiple user journeys across a much more complex Internet infrastructure to proactively flag performance issues before they impact end users. This true monitoring takes place 24/7, not as point-in-time tests.

    Forensics vs. Monitoring

    With APM and similar observability solutions that embrace real user monitoring (RUM), it’s important to focus on what monitoring really means. APM passively collects data that is a proxy for user experience, enabling postmortem assessment of causes and possible fixes, but after the fact. Observability looks at logs, metrics and traces and provides an assessment of whether users are having a good experience or why they did not. Neither solution by itself will prevent poor experience, and many fixes won’t take place until a postmortem analysis feeds the next iteration. The poor experience has already done its damage, and the costs are already sunk.

    With thousands of potential blind spots across the globe that can slow or disrupt applications, from ISPs and wireless carriers to CDNs, it’s not hard to grasp the increasing and differentiated importance of IPM. Where the combination of CI/CD/CT with APM can proactively prevent deployment of poor code that would affect user experience, only IPM is continuously replicating – even more valuable than monitoring–millions of experiences across a dynamic multi-node network where the unexpected is now expected.

    Internet Resilience Vs. Retrospection

    Businesses today understand the importance of resilience: It’s a board-level concept. Any business that has lost market share and market cap during sustained downtime or poor user experience understands what’s at stake: Millions if not billions of dollars. IPM is squarely focused on “internet resilience,” and its pillars are availability, reachability, performance and reliability. For businesses reliant on the cloud and employers operating with highly distributed workforces, retrospection alone is a risky proposition. Now that the internet is the new corporate network, internet resilience is a new organizational mantra.

    The Takeaway

    Whether your organization embraces CI/CD/CT already or is rethinking its approach to DevOps, this article should give you pause. Your job–perhaps as part of a larger team–is to catch performance issues and potential disruptions with your application before client impact is realized. Without IPM, only part of that job is being done.

    Why is this so important? Even conservative estimates put the cost of an outage at $6,700 per minute (Gartner) and the “cost of slow,” where something causes an application to perform poorly and it goes unnoticed, is likely significantly higher because it happens all the time. The fallacy isn’t that there’s value in CI/CD/CT–there is. The fallacy is that you’re in control of the entire CX of your internet-deployed products without monitoring the internet stack and ensuring internet resilience. Only by adding IPM can you have this assurance.

  • Optimizing SaaS With Automation and Zero-Touch IT

    Optimizing SaaS With Automation and Zero-Touch IT

    For the first time in 10 years, businesses have slowed their frenetic pace of SaaS adoption. Based on recent BetterCloud research, the average enterprise today uses 130 SaaS applications. While that represents an 18% increase from last year, it’s worth noting that it’s the slowest annual growth rate since we began tracking SaaS usage in 2012—and it will likely continue to trend downward. Let’s examine why.

    The pace of companies adopting new SaaS applications has been fast and furious in the last couple of years. But this trend created a number of challenges. One, SaaS sprawl burdened many employees who had to learn and constantly switch between new apps. Two, the spike in the number of applications brought about serious governance and security challenges for IT. Lastly, it created waste; many applications were never fully deployed, rolled out and adopted by users.

    Fast forward to today; these challenges are compounded by the current macroeconomic headwinds that are driving greater scrutiny on SaaS spend. And the decelerated growth in SaaS adoption is just an early sign. We’re entering into a more deliberate phase of SaaS adoption and optimization as an industry.

    In the coming years, we are going to see the total number of applications used in organizations plateau. The priority in 2023 and beyond will be to better integrate, manage, govern and extract maximum value from the applications that are in place today. We are going to see more organizations continue to embrace automation with the goal of achieving zero-touch IT — the peak point at which the number of manual “touchpoints” by IT support is as close to zero as possible.

    2023 IT Mandate: Automation

    Automation of processes is hardly a new concept, and IT pros believe it will be a big part of their future. In our research, an overwhelming 86% see automation as critical to overcoming SaaS operations (SaaSOps) and security challenges.

    Many have started their journey and are already reporting efficiencies. Of those we surveyed, 71% already automated at least one help desk process, like onboarding or password resets. Additionally, 43% already have a dedicated SaaSOps automation role or team, and another 23% plan to establish one.

    But if the ultimate goal is to reach peak automation, there’s still much work to do.

    Zero-Touch IT: Managing SaaS Sprawl

    At most organizations, many workflows can be automated, replacing all their manual IT touchpoints. Many in the industry call this approach to automation “zero-touch IT” and agree that it’s a top priority. Our findings show 72% believe zero-touch automation is the future of SaaSOps, and 69% are working toward it.

    While it may seem daunting, the journey to achieving zero-touch IT is not out of reach. It does require investment in time, technology and people, however. And once you get there the efficiencies will be apparent. Let’s break these benefits down by category.

    Zero-touch IT helps companies manage their software applications much more effectively. IT groups have historically gotten bogged down in the manual execution of tasks that are complicated and tedious, despite being basic and common. Two processes cited as top concerns for IT professionals, onboarding new employees and offboarding departing employees, are concrete examples.

    But managing the user life cycle of an employee doesn’t just start at onboarding and stop at offboarding. Many changes take place during an employee’s time at the organization—promotions, changes in departments, password resets, new project assignments, etc. And every single time an event like this occurs, some type of action, like giving or revoking access to new files, elevating access rights or taking security steps to prevent unauthorized access is required. This is a lot to keep track of, especially once you multiply these steps across your entire SaaS stack for multiple users.

    Automating all of the necessary steps—or at least some of them—will make the user life cycle management experience much more streamlined and efficient. Not only that, but you’ll reduce the chances of making an error from repeatedly retyping employee details.

    Additionally, going zero-touch with onboarding means that new employees will contribute value on day one. They’ll have almost immediate access to all the devices, apps, data and groups they need to be fully productive. Automating repetitive onboarding steps also does away with scads of request tickets and frees up IT for more strategic work.

    Zero-Touch IT: Governing SaaS Sprawl

    Once upon a time, SaaS security would have solely fallen on security teams. Not so today. Based on our research, 81% of IT professionals now say they are responsible for protecting SaaS and sensitive data. Further, 43% added a new SaaS app that stores sensitive data in the last 12 months.

    This is why zero-touch principles have become so critical to IT; it’s the key to securing and protecting applications and the data in them.

    Here’s a real-world scenario. Imagine you’re offboarding 100+ departing employees. Given this task is most often done manually, a handful of those employees are overlooked and therefore retain access to the company’s systems. By automating the offboarding process, you can ensure you quickly cut off access to every employee leaving the company with zero room for error and reducing the risk of a data breach or other potentially destructive action.

    Or imagine an employee externally sharing a file that contains sensitive business information. This immediately exposes said data. By automating the data detection process, IT now receives an alert every time such a vulnerability is identified. IT can then automate intervention to immediately stop any further data exfiltration and/or restrict file access.

    As more applications are deployed, more high-value data gets spread across them, creating new opportunities for bad actors to breach systems and exfiltrate (steal) information. IT groups recognize that automating SaaSOps strengthened their cybersecurity, with 26% citing better compliance or data security as an outcome.

    The bottom line is that zero-touch IT can provide a more comprehensive and up-to-date understanding of what employees are doing with their corporate and shadow applications and their data in order to uphold security standards.

    Zero-Touch IT: Boosting Operational Efficiency

    Nearly a third (32%) of IT professionals cited improved operational efficiency as the top benefit of automating SaaS management. Zero-touch IT helps organizations do more with less and ultimately save money.

    For example, automation can help IT extract insights into the utilization of apps to determine which resources are needed and which are expendable. IT can then find functionality overlaps between different apps, as well as orphan and ghost apps. This often allows IT to consolidate similar apps. It becomes simple to identify underused applications that do not deliver sufficient value and then discontinue them.

    Shockingly, two-thirds of SaaS apps are unsanctioned at organizations. Automation can help curb shadow IT by catching unauthorized applications in use. But shadow IT isn’t always a bad thing if it’s under control. With the right insights, IT can better understand what applications its employees need to be productive.

    The Future is Brighter With Zero-Touch IT

    SaaS growth may be slowing, but at most enterprises, the SaaS stack remains large, with many IT pros (59%, to be exact) citing management challenges.

    But achieving zero-touch IT won’t happen overnight. It’s a journey.

    Every application has its own idiosyncrasies, protocols and processes. In many cases, applications hold or share sensitive business data. Most organizations are tasked with carrying out all tasks related to the SaaS stack manually, a seemingly impossible task.

    But there is light at the end of the tunnel. This coming year we will consolidate, control, optimize and protect the SaaS stack at new levels — with a little help from zero-touch IT.

    At the end of the day, it’s organizations that prioritize automation that will be able to deliver more time savings, cost efficiencies, value and benefits.


  • Mobb Launches Community Edition of Automated Remediation Tool

    Mobb Launches Community Edition of Automated Remediation Tool

    Mobb today made available a free community edition of a namesake tool that creates fixes to open source vulnerabilities. The fixes are based on the results of code scanning by a static application security testing (SAST) tool.

    Fresh from raising $5.4 million in seed funding, Mobb CEO Eitan Worcel said the company developed a tool that creates validated patches based on the scan results of third-party SAST tools from Checkmarx, GitHub and Snyk. Initially, the tool is aimed at Java vulnerabilities.

    Worcel said that most vulnerabilities can be traced back to eight types of mistakes that developers routinely make. The company created a pattern for those common mistakes, along with patterns to fix them, called Mobb rules. That ability enables Mobb to accurately produce a code fix that both remediates the vulnerability and adheres to the correctness of the language to eliminate code defects. Mobb then makes available a patch to address those issues in a way that can be readily downloaded and applied by developers. Mobb does not automatically apply those fixes because most developers prefer to review them first, noted Worcel.

    The Mobb approach eliminates the need for IT teams to sort through SAST scans themselves, which can result in the discovery of thousands of vulnerabilities that might theoretically need to be fixed. Each vulnerability, at minimum, is going to require 30 minutes to fix, so the Mobb platform provides a better return on investment and reduces patch backlogs, added Worcel.

    For decades, application development teams have been attempting to find a way to remediate vulnerabilities as quickly as possible. With increased focus on adopting DevSecOps best practices to address those vulnerabilities, more organizations are now reviewing which types of vulnerabilities should have a higher remediation priority.

    Historically, one of the reasons for the wide divide between application development teams and cybersecurity professionals is that many of the vulnerabilities being discovered don’t actually impact applications running in production environments. Development teams then find themselves wasting time investigating vulnerabilities and, when they do determine a vulnerability is an issue, spending time developing a patch. The Mobb tool addresses that later issue by automatically creating the necessary patch, said Worcel.

    Many organizations just allocate junior developers to the task of remediating vulnerabilities, which Worcel noted frees up more experienced developers to focus on writing additional business logic.

    There will, of course, be vulnerabilities that the Mobb tool will not be able to address simply because there may not be enough affected applications to warrant pre-building a patch. Even with the most robust set of rules, it is improbable that an automated tool can, with 100% certainty, safely fix every issue. However, given the number of routine vulnerabilities present in applications, such as SQL injections, there’s plenty of opportunity to improve developer productivity by relying on patches that have already been developed.

    One way or another, the process by which patches are prioritized, developed and then applied has long been a source of DevOps frustration. Anything that streamlines that process will go a long way toward improving the overall state of application security at a time when cybercriminals are becoming more adept at exploiting vulnerabilities wherever they may be found.

  • PagerDuty Bets on AIOps and Automation to Simplify IT Management

    PagerDuty Bets on AIOps and Automation to Simplify IT Management

    PagerDuty this week made generally available an artificial intelligence for IT operations (AIOps) platform that leverages the data model embedded in its incident management software to reduce the amount of time required for an AI platform to learn how an IT environment operates.

    Jonathan Rende, senior vice president and general manager for PagerDuty, said that approach enables the PagerDuty AIOps platform to begin surfacing valid recommendations sooner than other AIOps platforms. Other platforms first need to be integrated into IT environments by an expensive team of consultants and integrators, he added. The PagerDuty approach makes the benefits of AIOps immediately available to both IT operations teams and application development teams alike, he said.

    The arrival of PagerDuty AIOps comes on the heels of the launch of PagerDuty Process Automation, a platform for orchestrating automation across multiple platforms that is integrated within PagerDuty Operations Cloud. That capability makes it possible for organizations to centralize the management of islands of automation that have emerged across the enterprise without having to replace any framework that has already been deployed, said Rende. There are also more than 700 integrations between PagerDuty AIOps and the PagerDuty Operations Cloud platform.

    Like other platforms, PagerDuty AIOps relies on machine learning algorithms and an AI model created by PagerDuty to correlate events so that the platform can put them in context. Incident response recommendations are then made, which an IT team can accept and automatically implement or reject. The platform then uses those inputs to surface more accurate recommendations over time, said Rende.

    The platform will also automatically group apply defined rules coupled with its machine learning capabilities to aggregate alerts. That capability reduces the overall alert noise that might otherwise be generated, noted Rende.

    Organizations are looking to invest in AI and automation more heavily at a time when many of them are reducing the overall size of their IT staff, said Rende. The challenge with AI, however, is that it can take six months or more for a rival AIOps platform to learn enough about an IT environment to begin making recommendations. The PagerDuty approach takes advantage of the data within the PagerDuty incident management platform to train an AI model more quickly, in a way that reduces the time to generate valid recommendations to a matter of days, noted Rende.

    PagerDuty has been building that AI model for the last four and a half years with that specific goal in mind, he added.

    It’s not clear how quickly organizations are embracing AIOps, but as IT environments continue to evolve, many once-manual tasks are being automated. There is a natural fear of the impact those advances might have on specific roles within an IT organization, but as IT environments get more complex, there will always be a need for IT personnel that can focus on higher-order tasks, said Rende.

    Overall, the rate of IT staff turnover should also decline as much of the toil that contributes to burnout is also eliminated.

    It may be a while yet before AI becomes pervasively applied to manage IT, but the proverbial genie is not going back into the bottle. The challenge is determining precisely where the line between the man-machine interface with IT environments is today versus where it might be tomorrow.

  • Predicting, Preventing and Resolving Incidents With AIOps

    Predicting, Preventing and Resolving Incidents With AIOps

    IT operations teams, site reliability engineers (SREs) and service providers are on a mission to scale across geographies, expand their digital services and create new experiences for customers. Amid this drive, their backend IT systems are getting more complex. This hinders visibility into applications and makes monitoring and troubleshooting cumbersome. With heightened competition in the market, businesses cannot afford to take hits on revenue or customer experience scores due to issues stemming from their IT stack, such as unknown outages, increased incident management times and data replication.

    Infusing artificial intelligence capabilities into IT operations (AIOps) can raise efficiency through automation, improve security and make a significant impact in warding off downtime. AIOps uses machine learning (ML) to enhance IT operations such as performance monitoring, event correlation and analysis. With AIOps, IT teams, SREs and service providers can predict and prevent outages before they occur and resolve them automatically. Moreover, AIOps uses ML to analyze current and past data to make precise predictions, reducing costs and speeding up return on investment (ROI).

    AIOps Implementation

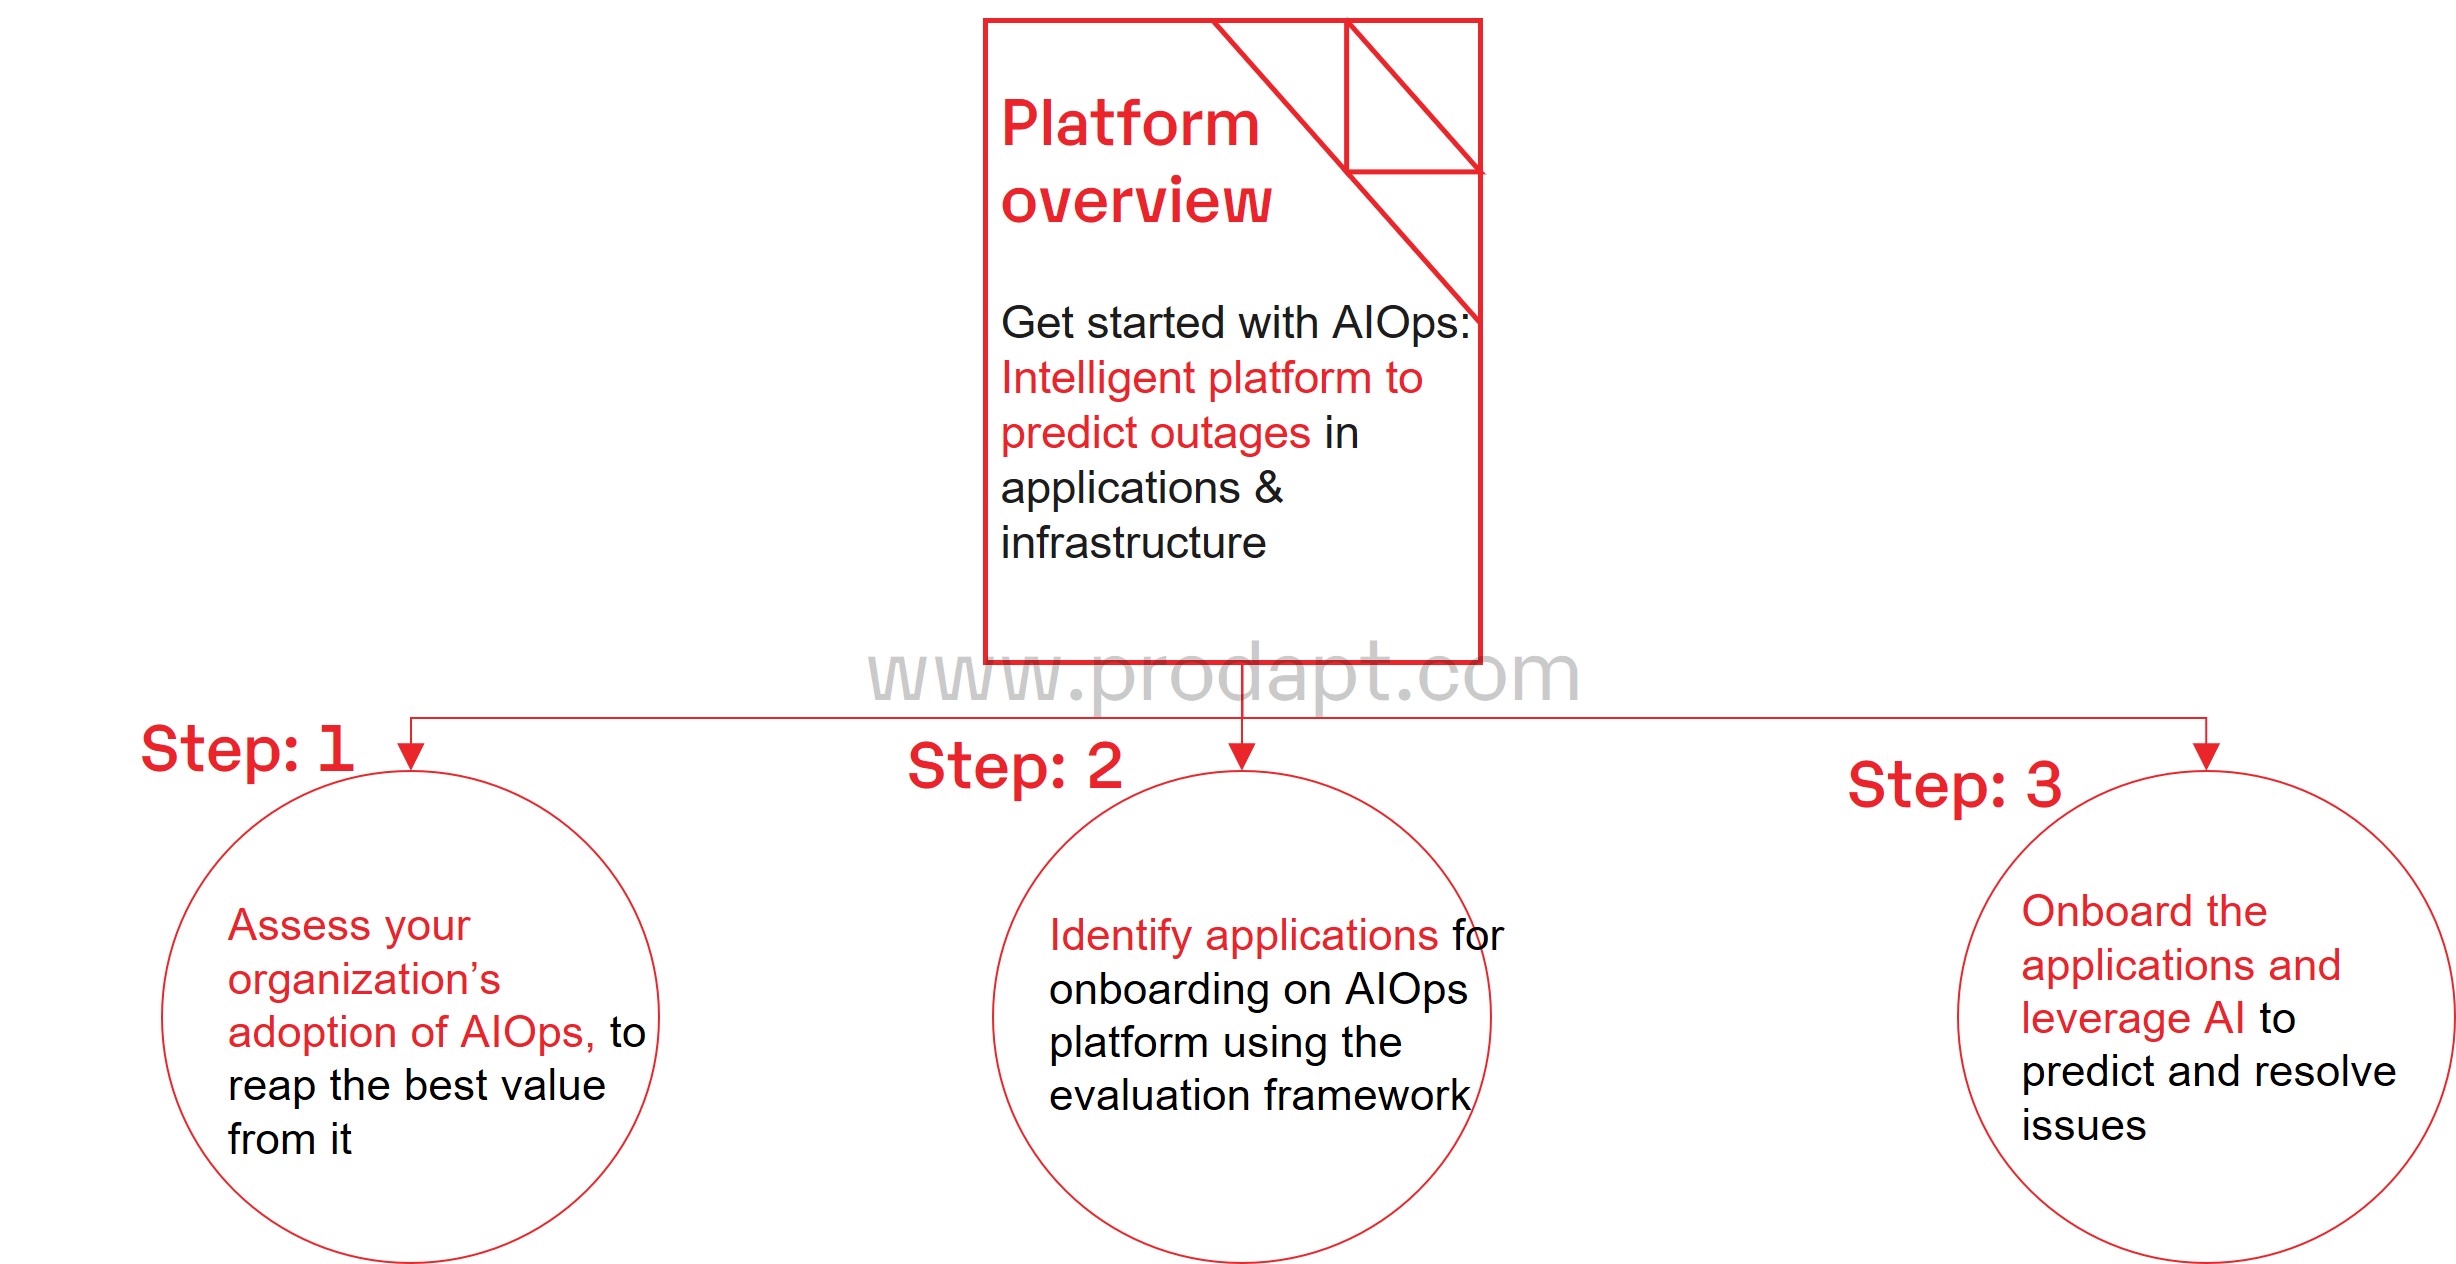
    Launching AIOps requires a unique approach depending on your organization, its capabilities and needs. This article provides a three-step implementation strategy to help your organization detect incidents before they impact users, automate responses and prevent recurring issues.

    AIOps 201

    Fig: AIOps implementation approach

    With the advanced ability to collect and analyze IT operational data, AIOps is an asset for a range of actions and solutions. When implemented effectively, AIOps can enable IT teams, SRES and service providers to significantly reduce application outage costs by over 60% within a span of 24 months.

    Getting Started With AIOps: Predicting Outages in Applications and Infrastructure

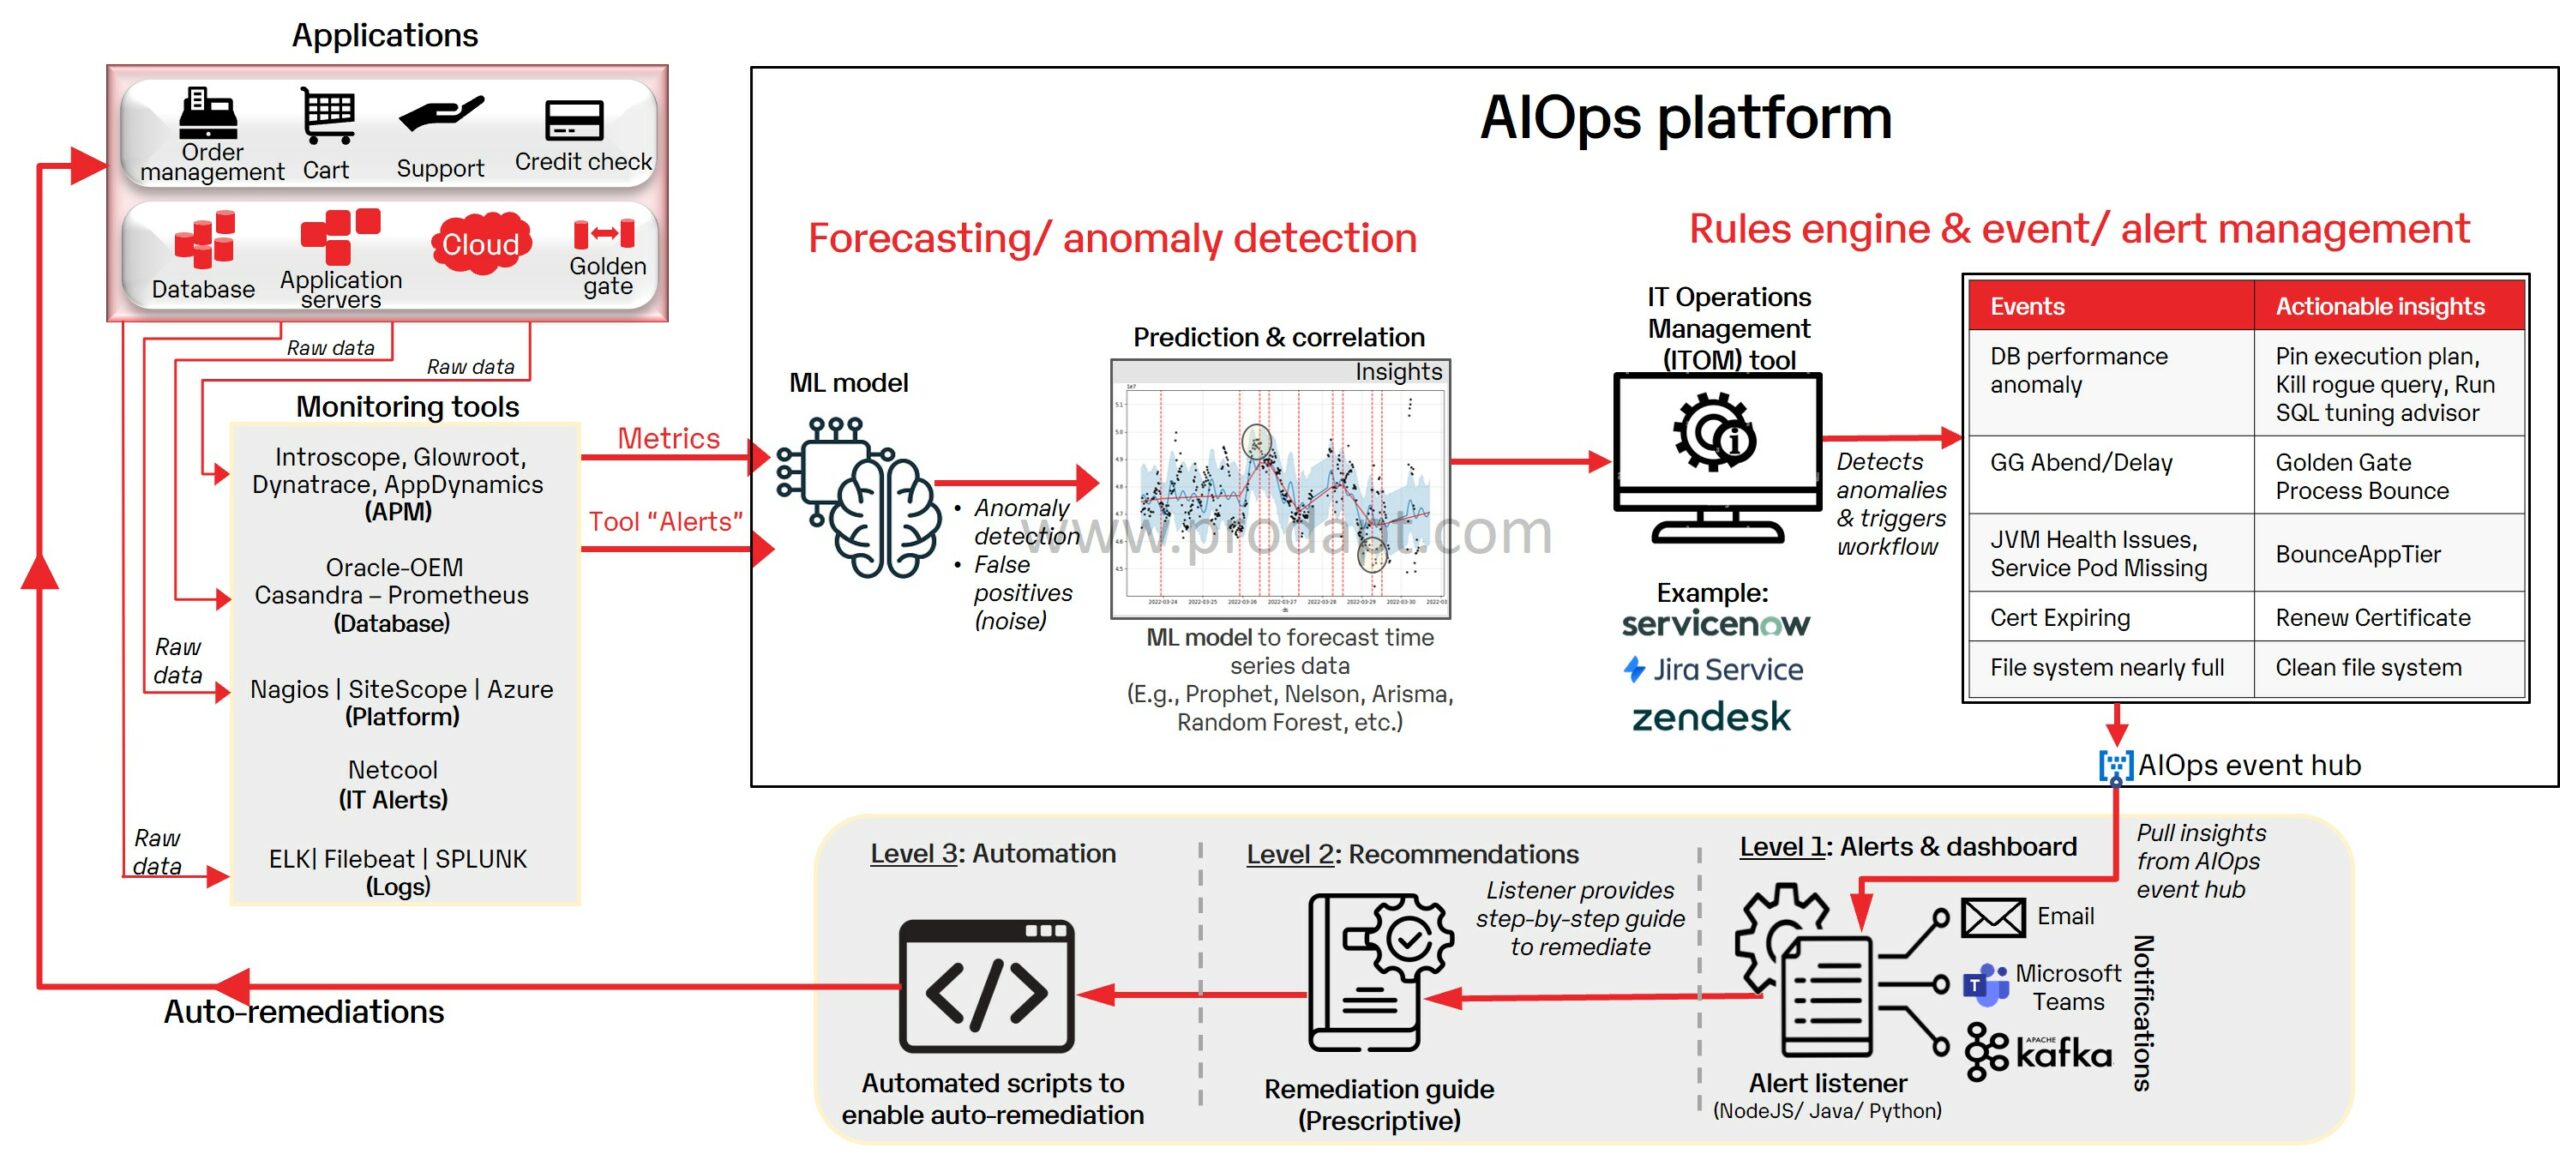
    The AIOps platform can be leveraged by IT teams, SREs and service providers for data gathering, analysis and generation of useful insights. It is designed to enhance operational efficiency, offer predictive alerts, reduce mean-time-to-identify (MTTI) and mean-time-to-repair (MTTR) as well as prevent service outages.

    Recommendations

    • Prioritize onboarding mission-critical applications, such as network monitoring, fault management and service assurance onto the AIOps platform.
    • Determine the best method to ingest data from the different monitoring tools. For example, build APIs, use pre-built connectors, use MuleSoft to automatically collect data from different systems, etc.
    • Choose the right ML model based on the types of raw data, e.g., use an anomaly detection model to identify issues from a dataset or use a time-series model to understand patterns based on historic data.
    • Use closed-loop automation to resolve low-risk issues; for example, automate disk clean-up issues or Java Virtual Machine (JVM) bounce for JVM-related issues.

    AIOps platform

    Fig: AIOps platform

    Assess Your Organization’s Adoption of AIOps to Gain Value

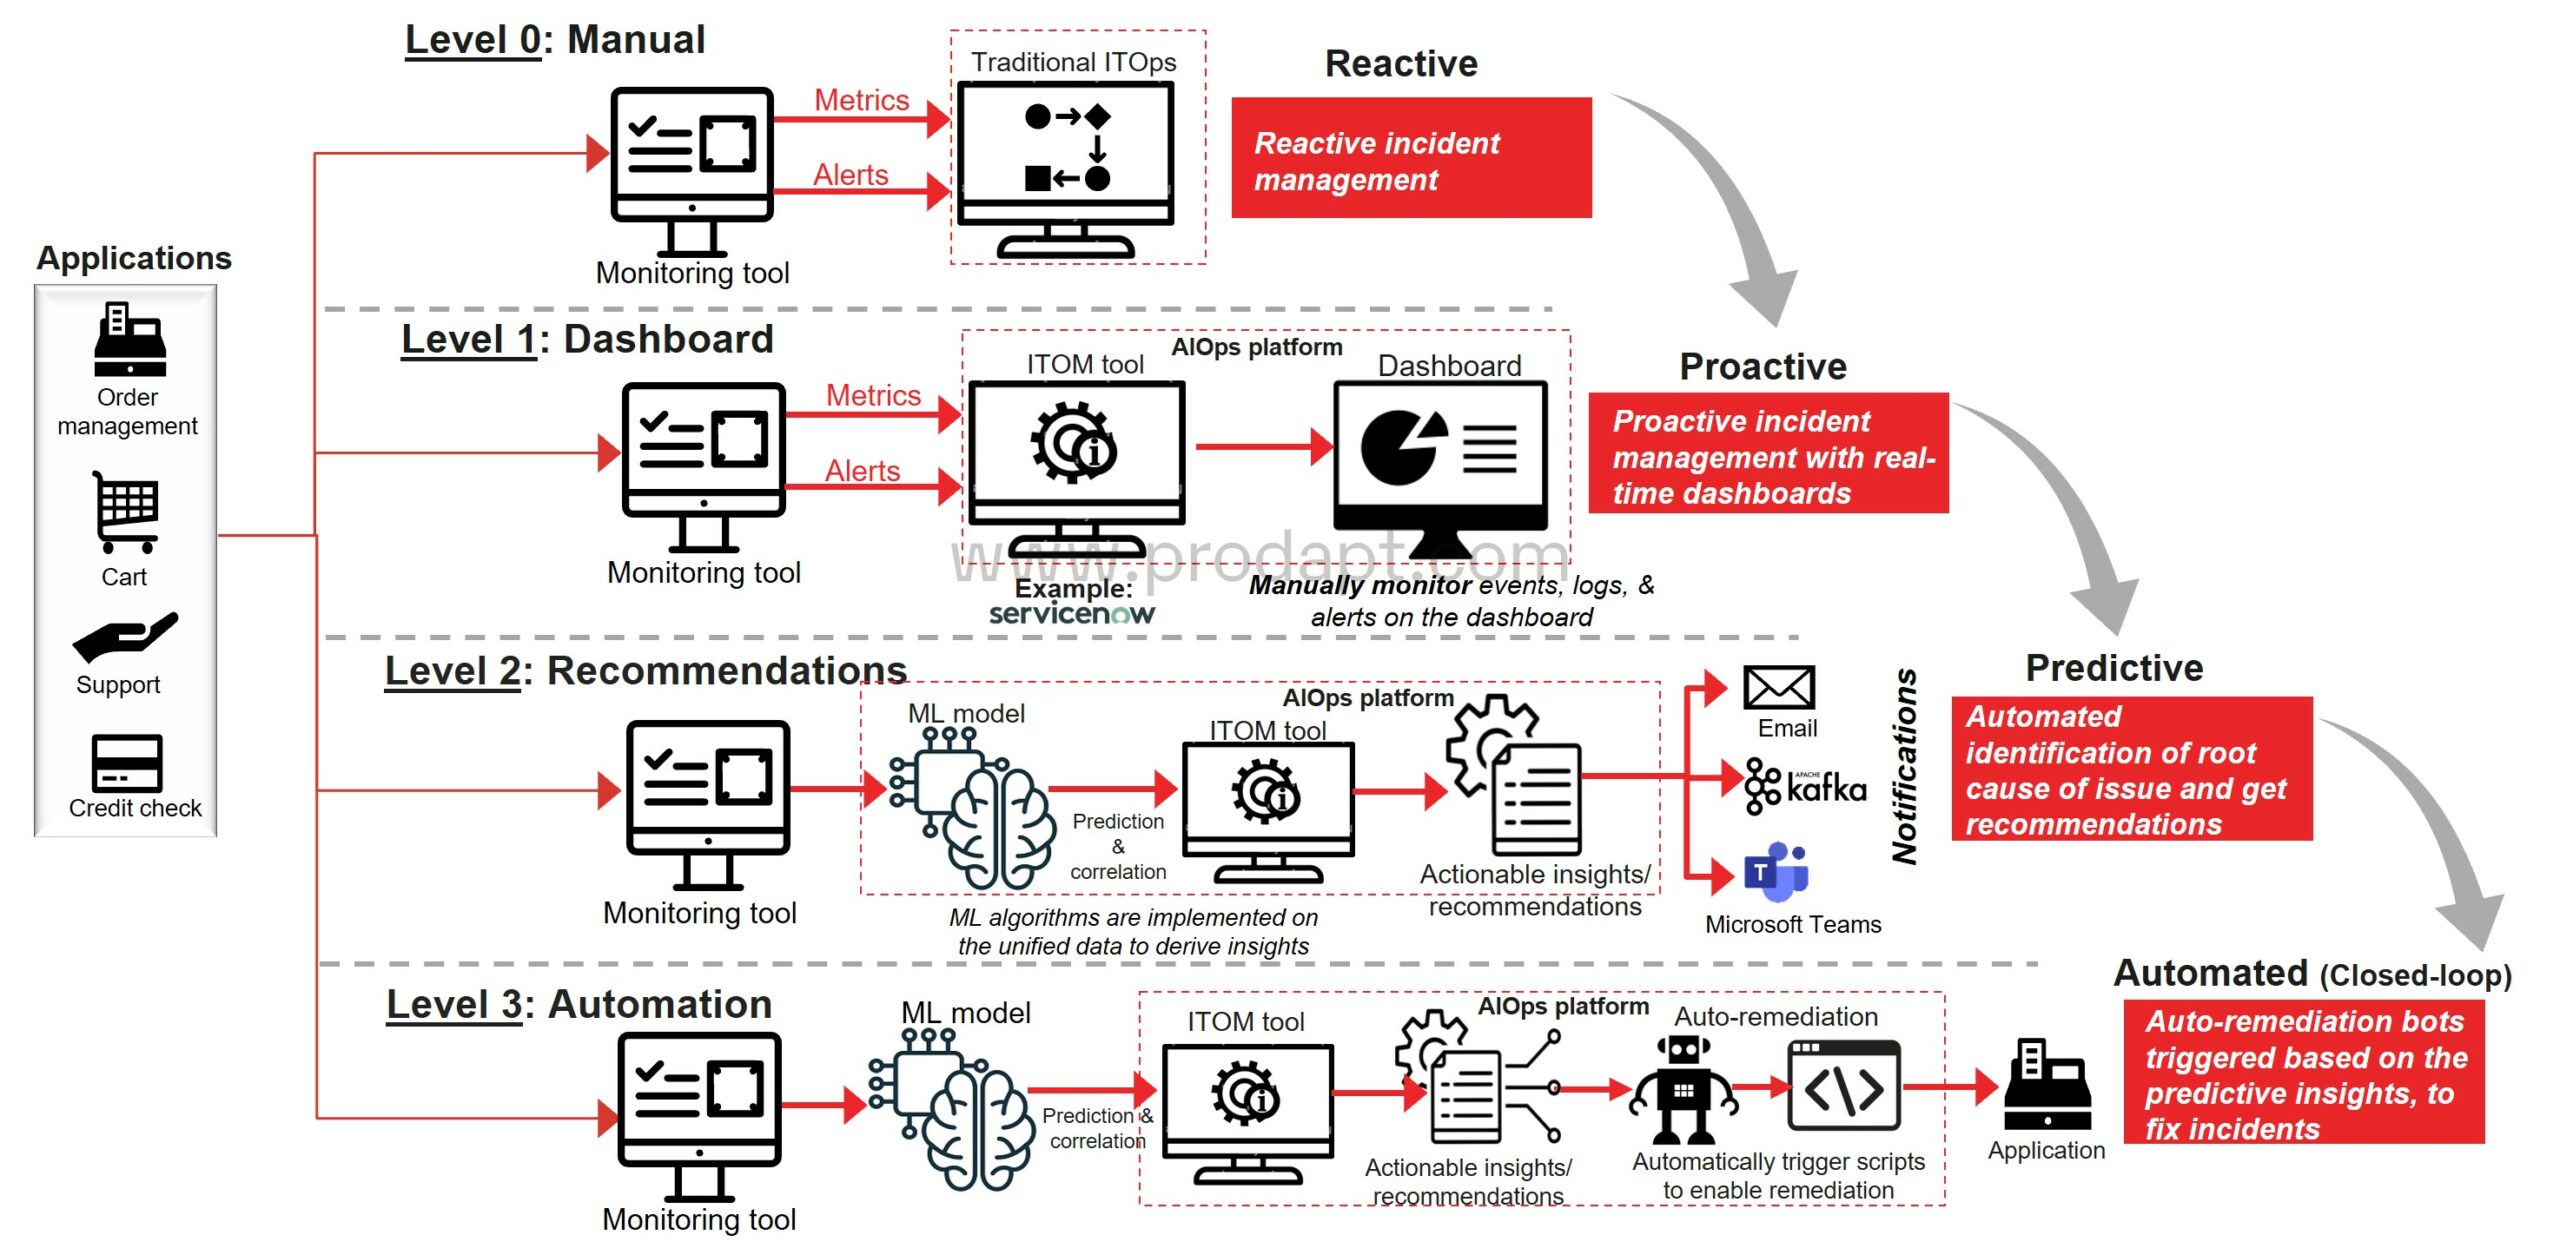
    Organizations contemplating AIOps as a strategy should first evaluate their current maturity and then chart out a path to make the best use of AIOps, which is automated resolution. There are three levels of maturity in AIOps adoption.

    Maturity

    Recommendations

    Level 1: Dashboard

    • Remove operational siloes by integrating the application data sources into unified architecture and ITOM tool.
    • Collect logs from applications and set up alerts that are commissioned to command centers to escalate as per the defined SOPs.

    Level 2: Alarm & Recommend

    • Implement supervised or unsupervised ML algorithms on the unified data to derive insights.
    • De-duplicate and correlate alerts and events through noise reduction to alleviate alert fatigue

    Level 3: Automation

    • Correlate incidents and events with business impacts by leveraging ML algorithms.
    • Trigger autonomous remediation bots spontaneously based on the predictive insights to fix incidents that are likely to happen in operations.

    Identify Applications for the AIOps Platform

    Conduct an AIOps workshop with key stakeholders to narrow down the list of apps and prioritize them for evaluation. Apply specific criteria to prioritize applications that meet the required onboarding standards.

    Recommendations

    • Prioritize onboarding critical apps and outage-causing apps on the AIOps platform.
    • Tag the data e.g., metrics, logs, inventory, topology, to ease the browsing, searching and visualization of data across the distributed analytics repository.
    • Setup an AIOps service and support team, as there is a constant need to maintain and update the platform features
    • Collect all relevant logs, metrics and traces along with data collected from ITOM platforms. A poorly constructed AIOps platform will show incorrect insights and inaccurately reflect the activities in the IT environment.

    Onboard Applications and Leverage AI to Predict and Resolve Issues

    To initiate application onboarding, monitoring tools must be set up to collect data for ML models. Predictions from the models can be integrated into visual dashboards for analysis.

    Automate AIOps

    Fig: Application onboarding

    Recommendations

    • Route both the on-premises and cloud-centric data to the AIOps platform. This will facilitate the prediction of issues in both the environments.
    • Use ML models such as Prophet, Nelson, Arisma, Random Forest, etc., to forecast the time series data, correlate the events and predict thresholds.
    • Choose secure connectors to transfer data in/out of the AIOps platform. For instance, any log flowing into the platform must be sent over transport layer security (e.g., syslog) or HTTPS (API endpoints).

    By implementing AIOps, service providers can successfully reduce the MTTI and MTTR, attaining a 63% reduction in outage costs for applications within 24 months, a 90% reduction in false-positive alerts and a 400+ hours reduction in downtime per annum.

    Ramesh Ram (Assistant Vice President), Sreedhar S K (Associate Director), Sakthivel D (Director), and Rohit Karthikeyan (Manager) also contributed to this article.