Category: Application Performance Management/Monitoring

  • How Developer Productivity Engineering (DPE) Enhances Software Delivery

    How Developer Productivity Engineering (DPE) Enhances Software Delivery

    Developer experience (DX) is in the zeitgeist, and for a good reason. Digital demands are increasing, yet the market faces cautious IT budgeting, workplace burnout, and high resignations. The idea is that quality developer experience can help keep the remaining talent happy and increase productivity. And organizations are considering many strategies for increasing DX, such as creating more usable interface interfaces, maintaining intuitive documentation and abstracting complexity with more automation and low-code.

    Another way to increase productivity is by slimming down the time it takes to test and deliver software. There are many potential hurdles in the way of deploying new code, and a cumbersome pipeline can easily take a programmer out of the flow. The practice of streamlining this toolchain is known by some as Developer Productivity Engineering (DPE). DPE focuses on improving developer productivity through accelerating DevOps processes, like CI/CD pipelines.

    I recently met with Hans Dockter, founder and CEO of Gradle, to understand the core tenants behind DPE. According to Dockter, the dialogue with the toolchain is a developer’s bread and butter, and optimizing this exchange is vital for quickly validating new ideas. Below, we’ll seek to understand what DPE is and how it might increase the pace of software delivery. We’ll also consider some methods for implementing DPE in practice.

    Roadblocks in the Development Toolchain

    Engineers are always experimenting with new feature development. “A developer needs to have a dialogue with their toolchain to see if their hypothesis makes sense,” explained Dockter. Yet, there are many potential barriers to instant feedback. For example, a toolchain may be comprised of code compilation, static code analysis, unit testing, performance testing, security testing and other checks. Running new changes through a CI/CD pipeline can take anywhere from a few seconds to minutes or hours. In his work, Dockter has even encountered teams that deal with a 24-hour feedback cycle time.

    Long wait times can be taxing as they demand users to switch contexts. Neuroscientists say that multitasking depletes glucose in the brain and leads to exhaustion. Similarly, Dockter argued that long waiting periods with the toolchain can take developers out of the flow and slow down the pace of software delivery. “You cannot have a good developer experience without good productivity.”

    Furthermore, he added that engineers often encounter untrustworthy signals from their toolchains. If testing suites produce too many false positives, for example, you can lose faith in the tooling altogether. This equates to a bad experience and may result in developers overlooking important signals that do matter.

    Understanding Developer Productivity Engineering (DPE)

    DPE is all about improving developer efficiency. And quickening the feedback cycle is one method to enhance developer productivity. According to Dockter, DPE applies a few strategies to streamline this feedback loop and shorten the timeframe:

    • Optimizing which tests are run: First, Dockter recommended only running tests relevant to the change at hand. Optimizing test selection can reduce bulky builds and significantly reduce the time it takes.
    • Caching: Caching is integral to any web application, so why not apply similar heuristics for the development pipeline? This could involve caching code that is not changed. “Changes are often incremental from one feedback cycle to the next. A lot of output is produced that can be reused,” said Dockter.
    • Predictive test selection: To automate test optimizations, Dockter recommended predictive test selection to understand which tests are sensitive to which areas of code. This would utilize an AI trained on release mechanics to help pinpoint what components the changes modify and, thus, what tests to run.
    • Test distribution: Another way to accelerate the pipeline is by distributing testing processing. Using multiple machines to test different areas simultaneously could greatly speed up the routine. Test distribution “is a modern approach to test parallelism that accelerates test execution by taking existing test suites and distributing them across remote agents to execute them faster,” wrote Marc Philipp and Hans Dockter in The Developer Productivity Engineering Handbook.
    • Monitor the toolchain: Lastly, it’s good to continuously monitor failure analytics to discover where the toolchain itself is causing trouble, said Dockter. On the side, CI/CD pipelines are not immune to security vulnerabilities and should be treated with the same security standards as other infrastructure.

    DPE principles have already been applied at DoorDash, LinkedIn, Netflix and other organizations.

    Benefits of Developer Productivity Engineering

    In the last few years, DX has moved from niche to mainstream, said Dockter. In fact, DX has even entered the C-suite, as certain companies have embraced the role of chief developer experience officer CDX). And with the emerging discipline of platform engineering, we’re seeing an even greater focus on streamlining internal DevOps workflows.

    And although platform roles may have been viewed as second-class engineers in the past, said Dockter, they are held in high esteem nowadays. “It’s as important as the other engineering work we’re doing,” he said. Developer productivity engineering seems to align with these principles, helping organizations manage the effects of an exponentially expanding code base. In the end, an investment in DPE, like platform engineering, could bring more satisfactory working conditions and accelerate the pace of software development.

    “DX is a transformative opportunity, but most companies invest incrementally. The economic benefits are transformative for companies developing infrastructure to get more output from their developers.”

  • Enfabrica Makes Cloud Networking Performance Advances

    Enfabrica Makes Cloud Networking Performance Advances

    Enfabrica Corp. today emerged from stealth at the MemCon conference to launch a class of processors for networking in cloud computing environments that are optimized for moving data between CPUs, graphical processor units (GPUs), accelerators and memory.

    Enfabrica CEO Rochan Sankar said the Accelerated Compute Fabric (ACF) enables scalable, streaming, multi-terabit-per-second movement of data in a way that also reduces the total cost of cloud networking. That’s critical as the amount of data being generated by applications infused with artificial intelligence (AI) capabilities that require access to larger amounts of data continues to increase, he added.

    At the same time, DevOps workflows will need to evolve as it becomes possible to compose AI fabrics of compute, memory and network resources capable of scaling to tens of thousands of nodes versus relying on top-of-rack network switches, network interface cards (NICs), PCIe switches and CPU-controlled DRAM that creates too many bottlenecks when moving large amounts of data.

    Enfabrica’s first chip, the Accelerated Compute Fabric Switch (ACF-S), supports standards-based interfaces, including multi-port 800 Gigabit Ethernet networking and high-radix PCIe Gen5 and CXL 2.0+ interfaces. The company claims that Enfabrica’s ACF-S is the first data center silicon product in the industry to deliver headless memory scaling to any accelerator by incorporating CXK memory bridging to enable a single GPU rack to have direct, low-latency, uncontended access to local DDR5 DRAM at more than 50 times greater capacity than GPU-native High-Bandwidth Memory (HBM). That approach should enable customers to cut their cost of GPU compute by an estimated 50% for large language model (LLM) inferencing and 75% for deep learning recommendation model (DLRM) inferencing, the company claimed.

    Simulation tests suggested ACF-enabled systems could achieve the same target inference performance using only half the number of GPUs and CPU hosts compared to the latest GPU servers.

    The cost of building AI applications today is prohibitive for many organizations, but as processor advances are made, there may come a time when the cost of building and training AI models substantially decreases. Advances in networking processor technologies will, as a result, accelerate the pace at which network operations are integrated into programmable DevOps workflows versus relying on dedicated networking teams to manage top-of-rack switches.

    It’s not clear yet whether cloud service providers will embrace ACF, but the chip makes it clear there is a significant opportunity to reduce the amount of networking infrastructure needed to build and deploy AI applications.

    Less clear, of course, is to what degree machine learning operations (MLOps) might ultimately be folded into DevOps workflows. While developers of AI models create a unique type of software artifact, they still need to be integrated with application code running in a production environment via application programming interfaces (APIs). One way or another, the total cost of building and deploying applications infused with AI models will need to decline.

    In the meantime, the networking bottlenecks that conspire to make deploying distributed computing applications difficult today may soon become overcome as latency issues are increasingly overcome.

  • Survey Surfaces Application Modernization Challenges

    Survey Surfaces Application Modernization Challenges

    A survey of senior IT leaders suggested the level of confidence in application modernization projects that many organizations initially had is now starting to wane.

    The survey polled 200 senior IT leaders at organizations with more 1,000 employees and was conducted by Global Surveyz Research on behalf of EvolveWare, a provider of platform for automating application modernization processes. The survey found 70% of respondents reported they were confident or very confident in their understanding of their applications when they prepared for modernization. However, that level of confidence dropped to 41% at the planning stage and even lower (28%) at the point the project began, the survey found.

    More than half of respondents (51%) are already experiencing or anticipating critical issues that need to be addressed immediately, the survey found. The top areas of importance are understanding the parts of the code that contain business policies (47%), database access details (43%) and understanding the complexity (40%).

    EvolveWare CEO Miten Marfatia said the survey makes it clear organizations are encountering issues associated with capturing tribal knowledge that has been lost mainly because the teams that initially built an application are no longer with an organization. In fact, the survey found a full 81% of respondents reported they currently have or anticipate challenges hiring or retaining talent to support legacy applications. Nearly half (46%) currently don’t have enough talent available to manage legacy applications.

    The survey found the primary reason these initiatives are launched is to boost employee productivity (40%), followed by retiring mainframe infrastructure (37%), reducing the dependency on legacy code (36%), reducing maintenance costs (30%), improving customer experience (29%) and cloud migration (22%). Most of these projects are generally focused on critical applications (55%) as well as applications that have few or no dependencies (55%), the survey finds.

    The primary success metrics for assessing these projects, however, are improving customer experience (46%), the readiness to migrate to the cloud (46%) and meeting the performance requirements of the modernized application (45%).

    Less than a third of respondents (31%), however, reported having access to modern tooling. More than half would like to automate code transformation and business rules extraction (BRE) while 40% would like to automate documentation.

    Nearly two-thirds (64%) said freezing code during the modernization process would have significant business and financial consequences, with 59% noting that finding a way to modernize applications without freezing code is at the top of their technology wish list.

    Application modernization efforts usually have multiple goals. IT teams are usually motivated by a desire to reduce the amount of time and effort required to support legacy applications that are generally less efficient than modern applications. In addition, many IT teams are also looking for ways to reduce the total cost of running those applications, especially during uncertain economic times. Business leaders, meanwhile, are funding digital business transformation initiatives that typically require some level of modernization of legacy applications.

    Regardless of motivation, it’s apparent many IT teams initially underestimate the amount of effort required to achieve those goals.

  • Why Observability is Important for Development Teams

    Why Observability is Important for Development Teams

    Observability, which allows development teams to understand better how their systems behave in production, is critical to successful software delivery. According to Gartner, by 2026, 70% of organizations that successfully applied this practice will achieve shorter latency for decision-making, enabling competitive advantage for target business or IT processes.

    Observability allows development teams to identify and diagnose issues quickly to make decisions that improve overall software delivery performance. Let’s take a closer look at why this practice is critical for development teams.

    Differentiating Observability and Visibility

    To better understand observability, it’s essential to clear up a common misconception – that observability and visibility are the same. Two critical differences exist between the two. Visibility allows development teams to look at the surface-level aspects of an application or system. In contrast, observability provides deeper insight into what an application is doing in production. Being equipped with a deep knowledge of observability allows developers to be more productive within their respective organizations.

    Impact on Developer Productivity

    With observability, developers can identify and diagnose issues within applications quickly, giving them more time to fix bugs and time for resolution, which are both critical success factors for software delivery. Observability allows organizations to quickly identify and respond to potential problems, such as operational issues or security breaches, before they become issues that impact customers or users. While there is no such thing as perfect software, observability helps developers quickly find and fix issues, bottlenecks, inefficiencies, etc., so they can get back to doing what they love: Creating new software.

    With the benefits of observability, developers naturally gravitate toward tooling and technology. There are many tools available for developers to take advantage of, and development teams must learn how to use these tools to integrate them into their applications and services. Let’s explore some of the more popular options.

    The Shift to Cloud-Native Tools

    The shift to cloud-native tools is driven by the increasing popularity of cloud computing and its benefits, such as scalability, cost-effectiveness and flexibility. The move to cloud-native has made an enormous impact on observability efforts. Having good tooling and processes available positively impacts observability efforts because it’s a critical aspect of the developer communities’ systems. Overall, the shift to cloud-native tools is driven by the need for organizations to take advantage of the benefits of cloud computing and the need for more efficient and flexible deployment and scaling of applications.

    Some of the most common tools in observability include:

    These tools offer developers greater insight and knowledge into how applications behave. The cloud-native approach necessitates a new way to aggregate all of these operations.

    Conclusion

    With observability, developers can understand how their systems work in production. These systems act in different ways depending on the environments they run in. Therefore, organizations must do more to provide developers with sufficient observability because of the limited visibility into the overall system performance.

    Observability allows developers to act quickly and remedy issues before they go into production and organizations can better measure success relative to the application’s performance. Hours of developers’ time are spent manually debugging and troubleshooting when organizations could have a system in place to do this automatically and allow developers to get back to what they love doing most: Creating software. Observability helps organizations make better-informed decisions, improve operations and performance and achieve their objectives more effectively.

  • Grafana Labs Acquires Pyroscope to Add Code Profiling Capability

    Grafana Labs Acquires Pyroscope to Add Code Profiling Capability

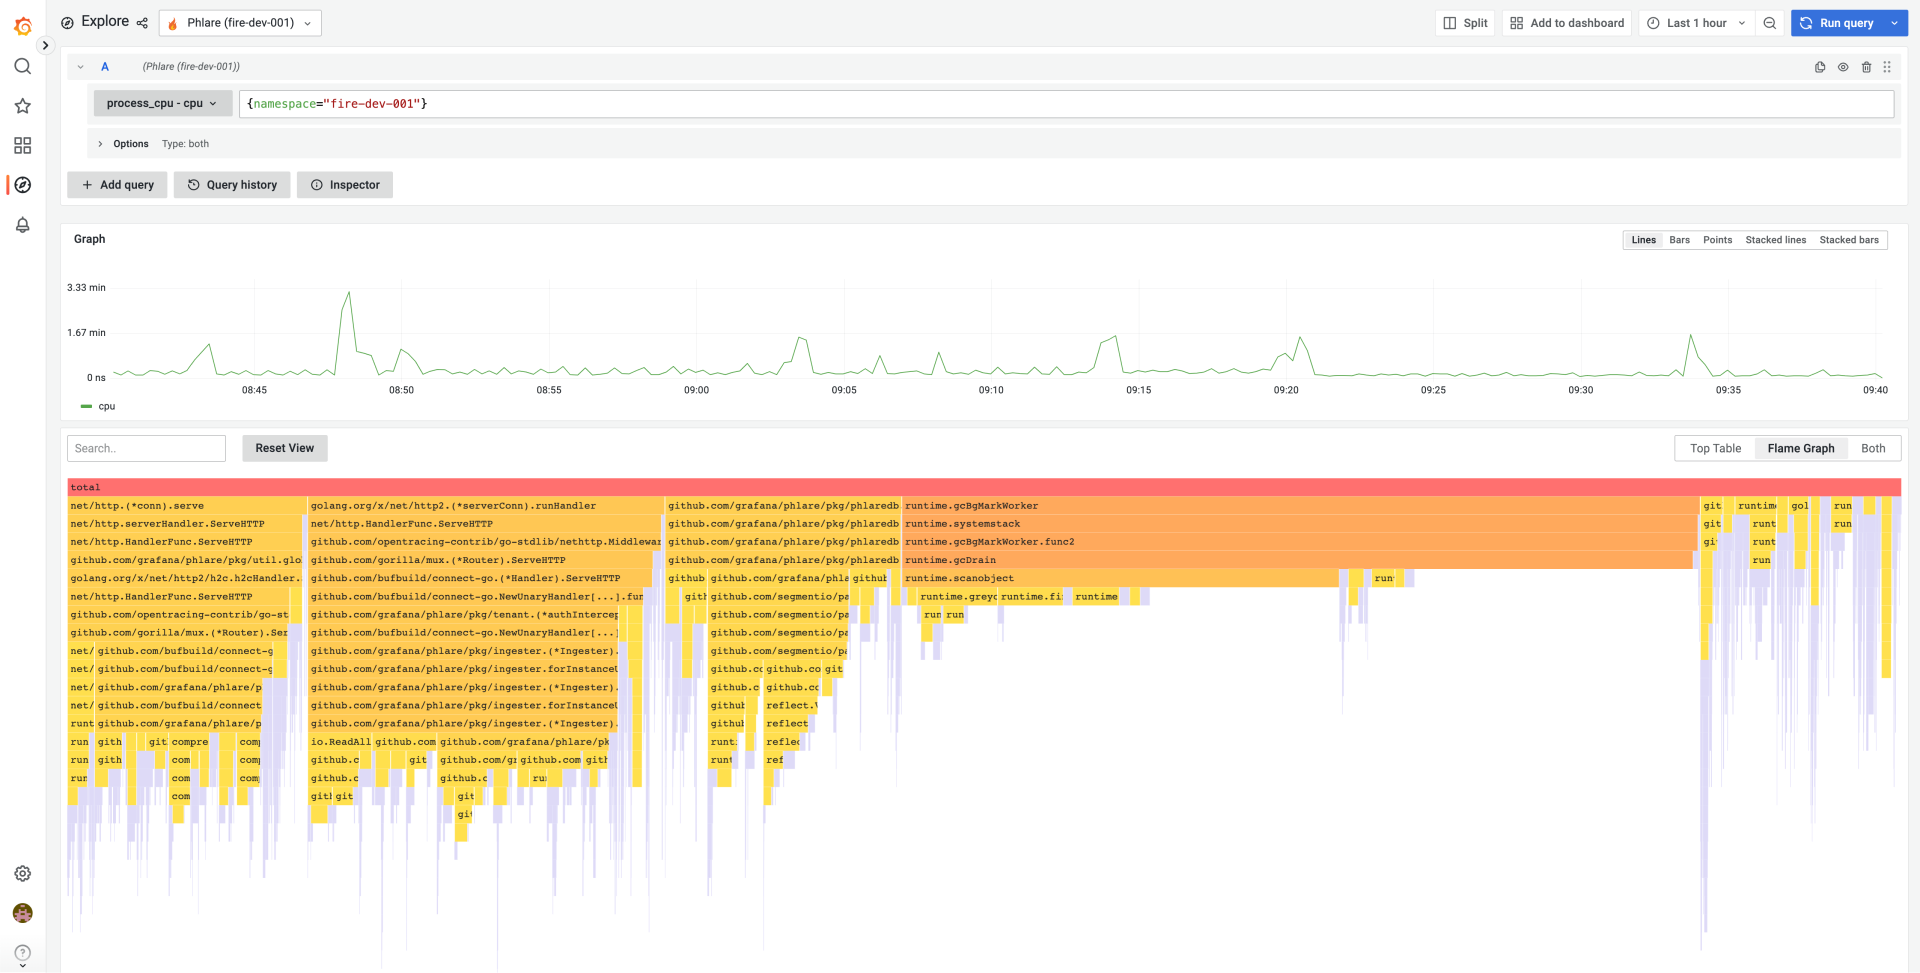
    Grafana Labs this week announced it acquired Pyroscope and plans to merge Pyroscope’s open source continuous profiling project with the open source continuous profiling database that Grafana Labs launched last year.

    Richard Hartmann, director of community at Grafana Labs, said after logs, metrics and traces, continuous profiling is now the fourth pillar of observability that enables DevOps teams to identify how much infrastructure resources any given piece of code is consuming. That capability is critical for everything from controlling costs to improving performance to limiting the amount of carbon generated by an application both before and after an application is deployed, he added.

    The resulting Grafana Pyroscope project will be natively integrated with Grafana Labs’ open source dashboard project to make it simpler to visualize profiling data and correlate it with metrics, logs, and traces. Grafana Labs is also committing to adding profiling capabilities to the fully managed Grafana Cloud observability platform.

    Pyroscope currently makes a plug-in for Grafana available in addition to a cloud instance of Pyroscope. Integrating Pyroscope with the Grafana Labs portfolio will make it simpler for DevOps teams to visualize issues before there is a major disruption to an application environment, said Hartmann.

    It’s still early days as far as the adoption of observability platforms is concerned, but it’s apparent that as application environments become more complex, the plethora of monitoring tools that DevOps teams rely on will need to be streamlined. Observability platforms promise to unify logs, metrics and traces in a way that makes it simpler to launch queries to identify the root cause of an issue. The rate at which DevOps teams will embrace observability will naturally vary, but the biggest obstacle might not be the platforms themselves. Instead, the issue is understanding what queries can help DevOps teams better understand the root cause of an IT issue. Visualization tools, in combination with code profiling tools such as Pyroscope, should make it simpler to surface those issues.

    Grafana Labs is also enabling organizations to better address sustainability concerns that have emerged as more policies are enacted to encourage organizations to reduce the overall size of their carbon footprints. The European Union, especially, has been enacting policies that provide organizations with a range of incentives to encourage greater efficiency from IT environments. It won’t be long before more DevOps tools and platforms provide greater visibility and control over the amount of infrastructure application code is consuming to achieve sustainability goals.

    In the meantime, overall observability should continue to improve as organizations move beyond continuous monitoring to gain insights into how application environments are behaving. As IT environments become more complex, tools that monitor a set of pre-defined metrics are no longer enough to ensure application resiliency. The challenge—and the opportunity—is to determine how to take observability to the next level before the next inexplicable application performance degradation.

  • Large Organizations Are Embracing AIOps

    Large Organizations Are Embracing AIOps

    A survey of 265 IT leaders found the primary reason organizations are applying artificial intelligence to IT operations (AIOps) is to improve service and application availability and performance (60%), followed closely by automation of operations (58%) and processes (54%).

    Conducted on behalf of OpsRamp, a provider of an AIOps platform, the survey polled 138 IT leaders working for enterprise IT organizations and 127 representing managed service providers (MSPs). The organizations surveyed generated at least $25 million in revenue and have more than 500 employees. The survey found monitoring/native instrumentation (55%) ranked as the most important feature of an AIOps platform.

    Bill Talbot, chief marketing officer for OpsRamp, said the survey suggested the initial reason organizations appear to be adopting AIOps is to improve monitoring and overall observability as IT teams continue to find simple tasks—such as discovering what is in their IT environments—challenging to achieve.

    Overall, the survey found the greatest IT operations challenge for enterprises in 2023 was automating as many operations as possible (66%), followed by driving greater efficiency and productivity of IT operations teams and processes (61%). Application-to-infrastructure dependency mapping is the top incident management challenge (64%), the survey found.

    The primary operational benefit cited was reducing open incident tickets (65%), followed by reducing mean-time-to-discovery (MTTD) and mean-time-to-remediation (MTTR) tied at 56% and automation of tedious tasks (52%).

    The survey also found 80% of respondents reported it took less than six months to implement an AIOps platform, with more than two-thirds (68%) noting it takes more than six months to hire engineers with the right skillsets for AIOps. Well over 90% of respondents said AIOps is delivering the level of value they expected.

    Despite advances in AIOps, however, two-thirds of respondents said they are concerned about the accuracy of the data being used to train AIOps platforms. A little more than a third (36%) are also concerned about AIOps deployment causing job loss.

    While there has been a lot of initial skepticism concerning AI applications in IT operations at scale, adoption has now crossed the proverbial chasm, said Talbot. IT teams are finding a wide range of static application environments that lend themselves to being automated using machine learning algorithms, he added.

    Less clear, of course, is the degree to which AIOps can be applied to highly dynamic IT environments where changes to code are frequently made. However, the more routine processes that are automated, the more time DevOps professionals will have to manage more challenging issues.

    At this juncture, it’s not so much a question of whether AIOps will be employed to manage DevOps processes as much as it is to what degree. It remains to be seen how generative AI platforms such as ChatGPT might be applied to IT operations, but it’s apparent that AI will automate a wide range of tasks. It’s not likely those capabilities will eliminate the need for humans any time soon, but it does mean that many of the rote tasks that make working in IT tedious may soon disappear.

  • JFrog Aligns With New Relic to Improve Observability

    JFrog Aligns With New Relic to Improve Observability

    JFrog and New Relic jointly announced today they will provide a free integration tool that will enable New Relic’s observability platform to consume log data from JFrog platforms for building and deploying applications securely.

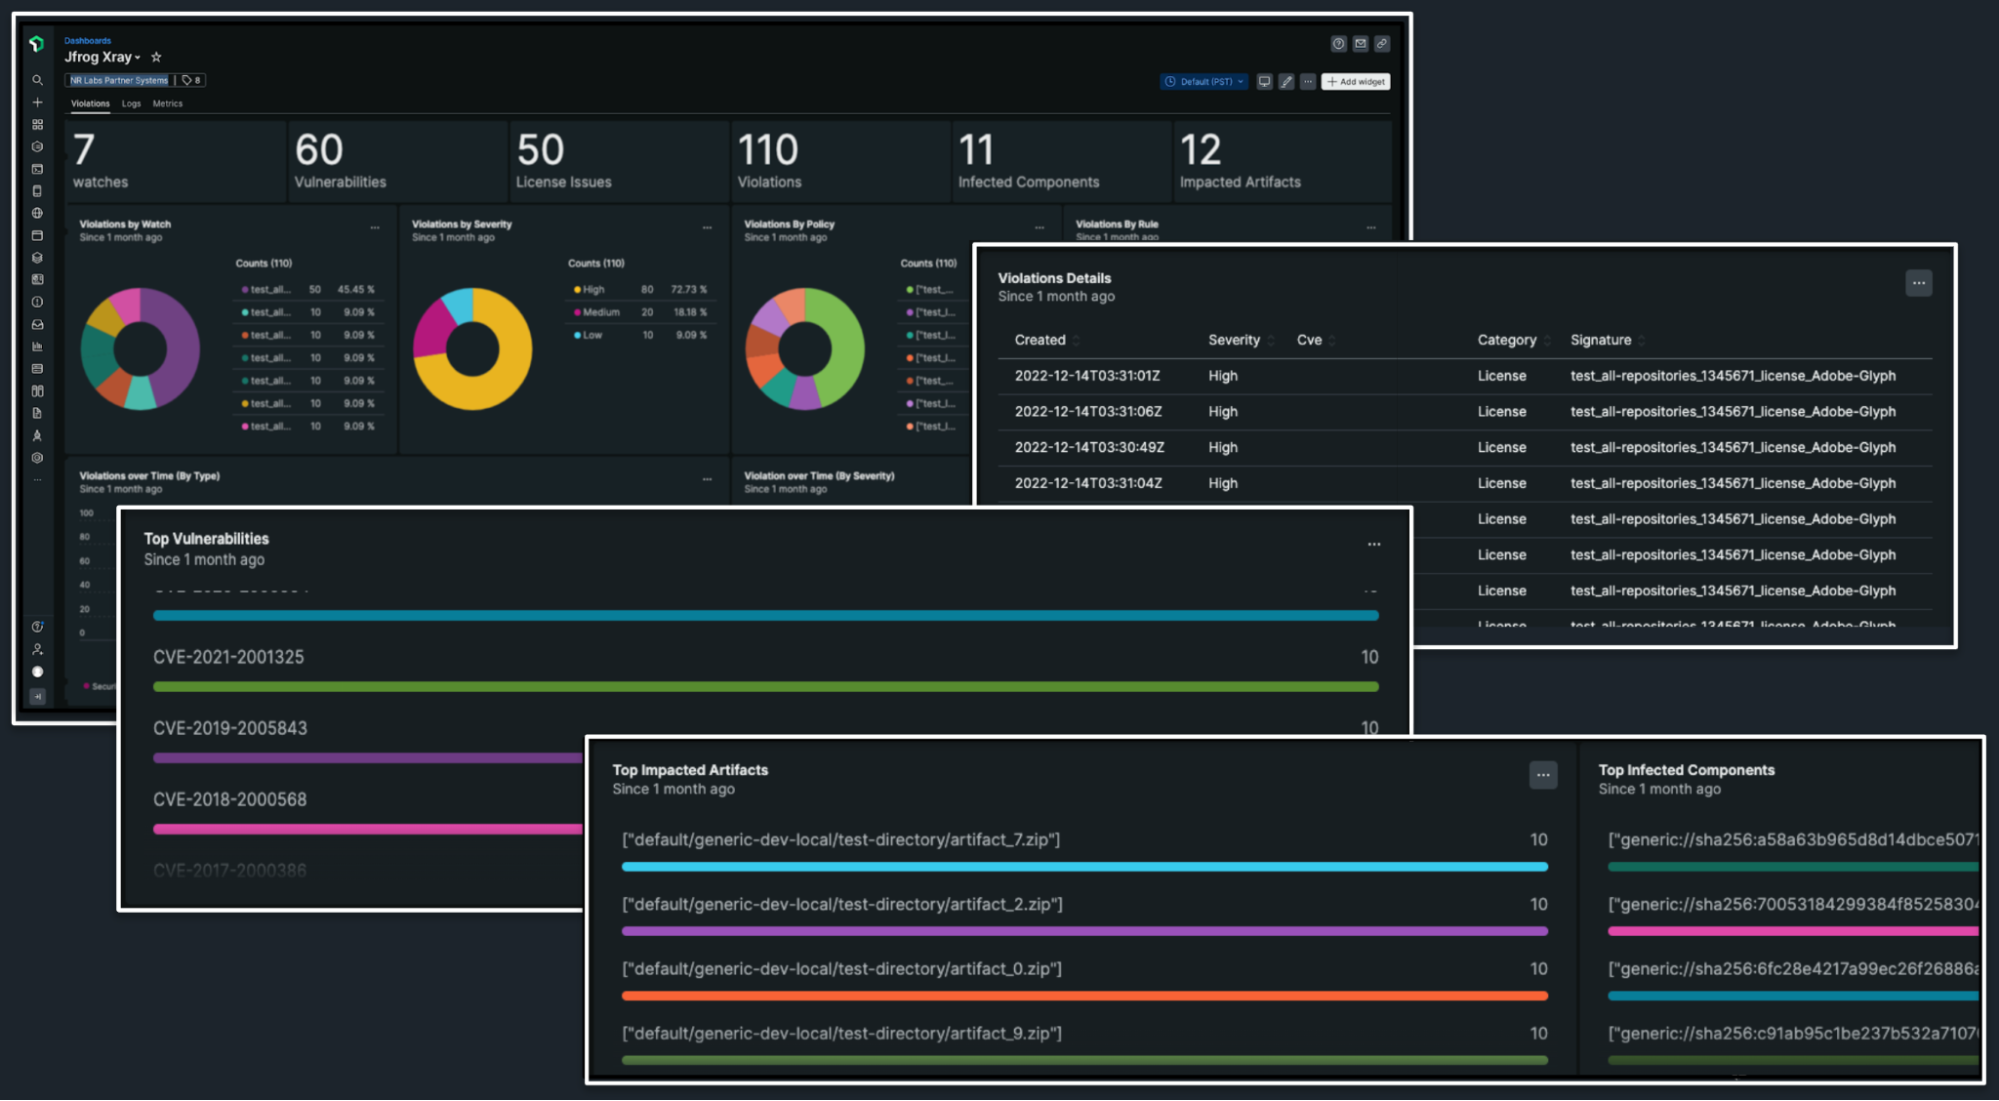
    Announced at the Futurestack conference hosted by New Relic, this integration eliminates the manual effort that was previously required to integrate these platforms. Preconfigured New Relic dashboards provide a comprehensive view of performance data, artifact usage and security metrics in real-time that is automatically collected from JFrog Artifactory and JFrog Xray environments and then displayed alongside other telemetry data.

    Omer Cohen, executive vice president of strategy at JFrog, said that capability will make it easier to identify performance issues, urgent vulnerabilities and malicious users in a way that reduces the amount of time required to remediate those issues across the software supply chain.

    The goal now is to eventually provide similar levels of integration between JFrog platforms that enable DevOps teams to manage and secure application binaries with other observability platforms, added Cohen.

    It’s still early days as far as the adoption of observability platforms is concerned, but it’s apparent that as application environments become more complex the plethora of monitoring tools that DevOps teams rely on need to be augmented. Observability platforms promise to unify logs, metrics and traces in a way that makes it simpler to launch queries to identify the root cause of an issue. The rate at which DevOps teams will embrace observability will naturally vary, but the biggest obstacle might not be the platforms themselves. The biggest challenge is understanding which queries to actually launch to identify an issue that might later cause a major disruption. In the longer term, it’s expected that machine learning algorithms will leverage the data collected by observability platforms to automatically identify those issues. In the meantime, much still depends on the acumen of the DevOps team employing an observability platform.

    In fact, a recent New Relic survey found only 27% of respondents have achieved full-stack observability, with only 5% claiming they have a mature observability practice in place. A third (33%) of respondents also said they still primarily detect outages manually or based on complaints, the survey found. More than half (52%) of respondents also admitted they experienced high-business-impact outages once per week or more and 29% said they take more than an hour to resolve those outages.

    On the plus side, nearly three-quarters (72%) expected to maintain or increase their observability budgets next year. More than half (52%) of respondents, including 57% of C-suite executives, expected observability budgets to increase over the next year. A total of 14% of all respondents and 16% of IT decision-makers expected to increase observability budgets significantly or extensively. More than a third (36%) believe observability increases their productivity and enables them to find and resolve issues faster. Just under a third (32%) said observability enables cross-team collaboration, while more than a quarter said observability improves their ability to innovate.

    One way or another, visibility into DevOps environments clearly needs to improve as application environments become more complex. The challenge, as always, is determining the cost required to achieve it.

  • NETSCOUT Taps F5 to Optimize Custom App Performance

    NETSCOUT Taps F5 to Optimize Custom App Performance

    Through its alliance with F5, NETSCOUT Systems has extended the reach of its nGeniusOne enterprise performance management platform to support custom applications.

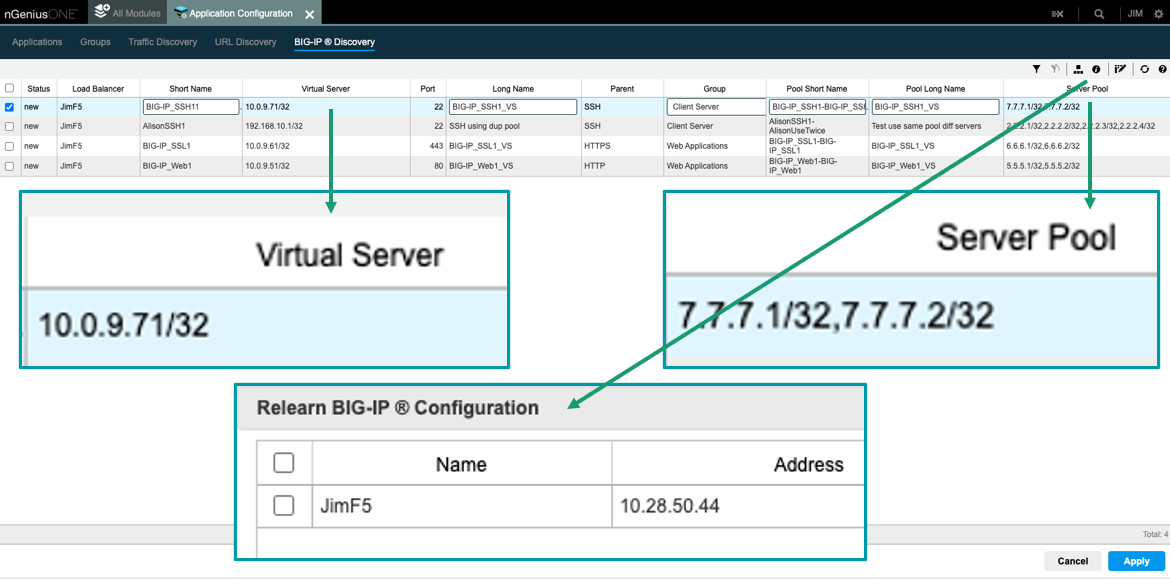
    The nGeniusONE platform supports more than 1,000 voice, video and business data applications using NETSCOUT InfiniStreamNG appliances in combination with nGeniusONE to provide visibility into any infrastructure environment, including data centers, private and public cloud and co-location facilities. The integration with F5 extends those capabilities to add support for custom applications via integration with F5 BIG-IP server pool definitions that can now be directly imported into nGeniusOne.

    Eileen Haggerty, area vice president for enterprise product and solutions marketing for NETSCOUT, said that approach enables nGeniusOne to access clear, unencrypted traffic from the BIG-IP Local Traffic Manager.

    As more cloud-native applications built using microservices are deployed across distributed computing environments, network latency is becoming a bigger DevOps challenge. A wide range of networking issues can adversely impact application performance, but without any visibility into network traffic, it can be challenging to determine the root cause of an issue. NETSCOUT has deployed a global network of appliances to surface those issues.

    A recent report published by Cloud Security Alliance (CSA) found the average enterprise uses 464 custom applications and expects to deploy 37 new applications in the next 12 months. At that rate, the number of organizations likely to encounter networking issues is only going to increase, noted Haggerty.

    It’s not clear to what degree network operations (NetOps) teams are becoming integrated with DevOps teams that build and deploy custom applications. The need for both teams to collaborate more effectively is becoming more apparent as more application code is deployed at the network edge. In some cases, developers are now programmatically invoking network resources directly, while other organizations provide developers access to a portal to self-service their requirements within the context of a set of pre-defined guardrails. Regardless of approach, the need for greater visibility into the underlying networks that custom applications depend on has become critical.

    Exactly how much that need will drive organizations to embrace one networking vendor over another remains to be seen. DevOps teams are starting to exercise more influence as organizations realize how much they depend on custom software to drive digital business processes. DevOps teams need to be able to understand whether an issue is the result of a networking problem or an inherent problem with the code written or the way an application has been deployed.

    Of course, DevOps and NetOps teams don’t share a common nomenclature so the cultural divide between these teams can be wide. The simpler it becomes for NetOps teams to share visibility into networking services the easier it becomes to bridge that divide. Developers should be able to see for themselves how changes to application code might potentially improve network performance. In the absence of any proof to the contrary, most DevOps teams will simply assume there is a fundamental flaw in the networking services being provided.

  • Improving the DevOps Process for Mobile App Developers

    Improving the DevOps Process for Mobile App Developers

    Development teams—perhaps especially mobile development teams—have heavily invested in systems to automate their processes and accelerate the delivery of mobile apps. From build, test and release to tracking and monitoring, the mobile DevOps team depends on systems like Fastlane, Bitrise, Jenkins, Azure Pipelines and GitLab—and really, that list just scratches the surface.

    The mobile app market moves so fast that automation is the only way mobile DevOps teams can keep up with their competitors and rapidly changing customer expectations. They have to iterate and release rapidly—the more frequently a publisher puts out new features, the more highly customers rate their app. In the GitLab 2022 Global DevSecOps Survey, 70% of respondents said their teams release code every day or every few days.

    Unfortunately, there’s one major component of mobile app development that sits outside of these automated processes in most mobile DevOps teams: Security. For the most part, developers still implement security manually, and the process for ensuring apps are secure mostly comes down to code scanning and penetration tests. Again, from the GitLab survey, 53% of developers are running static application security testing (SAST), but unfortunately, the data from those scans is often not feeding back into developer workflows. Less than three out of 10 teams (29%) pull scan results into a report for developers.

    Additionally, there’s still a large disconnect between the security and development teams. Nearly half (47%) of security pros said that developers miss more than three-quarters of the bugs in the code, leaving them for the security teams to find, and more than half (56%) said it was hard to get developers to prioritize fixing code vulnerabilities. In fact, prioritizing vulnerability remediation was security professionals’ biggest challenge. Additionally, it’s interesting that when it comes to shift left security, the emphasis appears to be on early code scanning, not actually building security into apps earlier in the process.

    Data-Driven Decisions and Security Automation

    First, DevOps teams need to integrate data about the security of their mobile apps early in the process so they can make informed decisions about what protections to incorporate into the next build. Scanning information and results from penetration tests clearly need to feed back to the development team as quickly as possible—there’s no point in doing these tests if the information remains unavailable and not acted on.

    But mobile devices have the capability to collect and send much richer data about the security threats apps are actually facing in the field. By collecting this data, DevOps teams can make data-driven decisions about which threats are the highest priority to combat.

    However, as noted earlier, it does little good to collect data if it’s never used. And the slow pace of manual security implementation does not allow DevOps teams to implement protections quickly or nimbly enough to keep pace with the rapidly changing threat environment. DevOps teams need to automate the build, testing, release, tracking and monitoring of security to the same degree as every other aspect of an app’s development. Specifically, they need:

    • A system that can store, provide version control and audit security in every release
    • An automated system that can build the desired protections into the app within the organization’s existing CI/CD processes
    • Automated verification that the protections slated for implementation are actually included in the release
    • A feedback system from data collected in the field, including data about the effectiveness of protections already implemented. This proves security measures are working and reinforces the value of the DevSecOps process.

    With this combination of data and automation, mobile app developers can transition from DevOps attempting to shift left security towards a DevSecOps process that is completely data-driven. Instead of reacting to the latest threat that’s making headlines in the news or working off gut feelings about the direction the threat environment is moving, DevOps teams can look at trending threat data from their very own apps, slicing it according to growth, geography, device, OS version and a multitude of other filters. As a result, the organization can pinpoint exactly which threats are emerging as the next big thing so they can defend against them early.

    And with the assistance of automation, the DevOps team can keep up with the trending data, building security protections into the app within days or even hours of making a decision on what to include.

    To improve the DevOps process, security has to shift left, but moving code scanning and penetration testing earlier in the process won’t do much good to harden protection without real-time data from the field and automation for security implementation. What DevOps needs is a transition to data-driven DevSecOps.

  • Balance Software Quality, Dev Speed and Cost With CI/CD

    Balance Software Quality, Dev Speed and Cost With CI/CD

    In many cases, success in the business world relies on software, be it a compelling mobile app, desktop application suite, interactive website or even an embedded system for the IoT. Because of this need, companies with mature software development processes enjoy a significant competitive advantage over those without. Part of fostering this maturity involves crafting quality software with high velocity but low costs.

    Modern software development methodologies, like Agile and its variants, play a key role in crafting applications in an effective fashion. As more companies adopted an Agile approach, the movement also fostered DevOps, a management structure combining software engineering and network administration teams while leveraging automation to build apps more quickly. In many cases, the ultimate goal for these adopters involved achieving the programming Holy Grail of continuous integration and continuous delivery (CI/CD).

    So, let’s take a closer look at continuous integration and delivery and how it helps companies successfully balance quality, speed, and cost in their software development projects. In a competitive global economy, adopting this approach remains a crucial differentiator, whether or not a business also fully adopts DevOps. In either case, understanding the benefits of CI/CD helps your software company achieve its business dreams.

    A Closer Look at DevOps

    As noted earlier, DevOps somewhat grew out of the Agile movement, but it isn’t a software development methodology in and of itself. Instead, it involves a company merging its software development team and its network administration staff largely responsible for helping the process of building applications. It increasingly leverages modern technologies like containers and virtualization for development, QA and production servers and automation for builds and testing processes.

    This organizational structure and mixture of tools combine to help companies build high-quality software with high velocity and at a lower cost. A mature community grew around DevOps, including tools, best practices, process experts and more. While DevOps originally served as the sole domain of large enterprises, now businesses of all sizes involved in software development benefit from adopting this approach.

    Defining Continuous Integration and Continuous Delivery (CI/CD)

    Continuous integration effectively automates the critical software development processes of builds and testing. It especially makes sense for shops using multiple programmers, as it works with the team’s source code version control system to ensure all programming changes are merged and remain in sync whenever a developer checks in their code.

    Any check-in typically kicks off a process where unit tests and a build are automatically run to ensure those changes don’t “break the build.” In pre-DevOps days, this tended to be a highly manual effort, leading to inefficiencies in any software development project. In short, the team only discovered any integration issues after a manual test. Automation now plays a crucial role in making this aspect of application building significantly more efficient. CI remains a critical best practice in any DevOps shop.

    Continuous delivery shares many similarities with continuous integration, especially its use of automation and the latest software development tools. However, instead of performing builds for internal developers and the QA team, CD focuses more on delivering a software product for release to a user community, customer or the public at large. Again, this is another part of the software development process that led to inefficiencies in the days before DevOps and automation.

    In terms of software development for mobile apps, CD ends up being the last part of the development process before the app gets delivered to the App Store or Google Play. It also comes into play with any fixes or feature improvements after the app is on the market. A key aspect of engendering goodwill among your customers directly relates to the speed of app improvements. Adopting a CI/CD approach plays an important role in making app changes with high velocity.

    CI/CD is the Heart of Successful Modern Software Development

    Simply stated, if your company wants to be a successful software developer, adopting both continuous integration and continuous delivery remains crucial. Following an older, manual approach causes too many bottlenecks and inefficiencies to thrive in a highly competitive industry. No matter how great your startup’s idea or app design is, failure to deliver it with high velocity ultimately results in failure. Once again, this same concept applies to fixes and feature enhancements after the app’s launch.

    At the same time, you don’t need to fully embrace the DevOps organizational structure by creating a separate team made up of software engineers and network administrators. At many startups with a small headcount, your developers might handle many of those network tasks, including managing virtual servers and containers. Hiring a network admin or two might be an unneeded luxury.

    In the end, if you want to build your startup’s app in the most efficient manner, adopting the CI/CD approach makes perfect sense. It provides speed that allows your team to effectively balance quality, speed and cost, resulting in a great app without overspending. It’s the right approach for any successful software project.