Category: Application Performance Management/Monitoring

  • New Relic Adds Module to Surface Code Metrics

    New Relic Adds Module to Surface Code Metrics

    New Relic today added a free CodeStream module to its observability platform to give developers access to metrics and telemetry data that will enable them to write higher-quality code faster.

    Peter Pezaris, group vice president and general manager of strategy and experience for New Relic, said this capability is part of an effort to shift observability left toward developers to optimize code as it is written and after it is deployed.

    CodeStream surfaces metrics and telemetry data within the integrated development environment (IDE) developers use to write software. Telemetry metrics are displayed as a line of text above the code or in the debugging tool used to troubleshoot an application. Alternatively, developers can view metrics via an observability panel at the service level. They can also view performance metrics such as error rates and response times for related services.

    That approach eliminates the need to wait for IT operations teams to surface issues that usually don’t manifest until long after the code in question was originally developed, noted Pezaris.

    The overall goal is to provide development teams with frictionless access to observability data at every stage of the software development life cycle, he added. That analysis capability will result in faster mean-time-to-detection (MTTD), mean-time-to-resolution (MTTR) and, ultimately, shorter development cycles, said Pezaris.

    Organizations should also be able to reduce technical debt faster by making it easier to identify issues that, for example, adversely impact application performance, he noted. That activity can be especially challenging because developers often inherit code written by someone else that often lacks clear documentation. CodeStream makes it simpler to onboard a developer to any application modernization initiative that has been launched to reduce technical debt, said Pezaris.

    A recent New Relic survey found only 27% of respondents have achieved full-stack observability, and only 5% claimed they have a mature observability practice in place. A third (33%) of respondents also said they still primarily detect outages manually or based on complaints, the survey found.

    On the plus side, the survey also found nearly three-quarters of respondents said C-suite executives in their organization are advocates of observability, and more than three-quarters of respondents (78%) saw observability as a key enabler for achieving core business goals. However, more than half (52%) of respondents said they experienced high-business-impact outages once per week or more, and 29% said they take more than an hour to resolve those outages.

    A full 82% of respondents said they use four or more tools to monitor the health of their systems. Only 7% said their telemetry data is entirely unified and only 13% said the visualization or dashboarding of that data is entirely unified. Nearly half of the respondents (47%) said they would prefer to have a single, consolidated observability platform, but only 2% said they currently used one tool for observability.

    Regardless of the approach to observability, it is clear that development and IT operations teams need to be looking at the same metrics and telemetry data at the same time to collaborate effectively.

  • Zenhub Brings Issues Management to Project Management Platform

    Zenhub Brings Issues Management to Project Management Platform

    Zenhub today announced it is adding an issue management module that makes it simpler for stakeholders to collaborate with developers on application development projects without having to log into a GitHub repository.

    Fresh from raising an additional $10 million in capital, Zenhub co-founder Aaron Upright said Zenhub Issues is a plug-in for a project management application the company developed for GitHub environments to better streamline software development life cycles. The issue is that many application stakeholders, such as marketers, are not especially pre-disposed to logging into a repository for managing software components, he said.

    Zenhub Issues provides an alternative means for collaborating with developers that doesn’t require stakeholders to log into GitHub, he said. In addition, organizations no longer need to acquire additional GitHub licenses for those users, noted Upright. Many of those end users wind up with read-and-write access to software components, which creates unnecessary cybersecurity risks should their credentials be compromised, he noted.

    In some cases, organizations will also be able to eliminate the need for the project management applications many of those stakeholders have adopted because they can track issues via Zenhub Issues, he added.

    Many organizations’ entire business strategies now revolve around accelerating the rate at which software development projects can be completed. Many elements of those projects, however, can’t go forward until a specific component upon which it depends is completed, so project management has become a critical function. Investors are holding business leaders more accountable for software delivery timetables that have direct implications on revenue generation, so that pressure naturally falls on DevOps teams.

    It’s not surprising that there aren’t a wider range of end users of project management applications as various stakeholders seek to keep closer tabs on how updates to schedule impact their planning cycle. Everyone from the sales team to the board of directors now wants more visibility into the rate at which software development projects are being completed. The challenge DevOps teams face is that software development is an inexact science. Application development projects can just as easily fall behind schedule as they can leap ahead depending on how well code is written.

    Regardless of how application development projects are managed, the relationship between DevOps teams and the rest of the organization has fundamentally changed. Unfortunately, expectations are not always realistically aligned with available development resources. A project management application that is widely employed across an organization should make that apparent to all interested stakeholders. In theory, at least, that should result in either the hiring of additional developers or a reassessment of the business strategy.

    One way or another, project management applications designed for managing software development projects now play a pivotal role in business planning. The challenge is finding a way to populate those applications with the data needed without requiring developers to help enter data that can already be easily pulled from the DevOps tools and platforms. Otherwise, instead of being viewed as a benefit, the entire project management process becomes one more tedious task that development teams are not going to prioritize over writing code.

  • Linux Tweak Brings Big Speedup ¦ DCs in SPAAACE (Redux) ¦ Atlassian Fires 500

    Linux Tweak Brings Big Speedup ¦ DCs in SPAAACE (Redux) ¦ Atlassian Fires 500

    Welcome to The Long View—where we peruse the news of the week and strip it to the essentials. Let’s work out what really matters.

    This week: Intel optimizes Linux multithreaded networking, data centers in space (again), and more DevOps toolmaker layoffs. (more…)

  • AWS Delivers on Latest Graviton3 Price/Performance Promise

    AWS Delivers on Latest Graviton3 Price/Performance Promise

    Amazon Web Services (AWS) has expanded the number of virtual machines based on the latest generation of its Graviton processors to include instances that support DDR-5 memory.

    The latest Amazon EC2 instance types, dubbed M7g and R7g, that are now generally available are based on the AWS Graviton3 processors developed using an architecture created by Arm. Previously, these instances were only available as part of a technology preview program.

    Rahul Kulkarni, director of product management at AWS, said these latest offerings take advantage of DDR-5 memory to provide 25% better performance than the previous sixth generation of Graviton instances. DDR5 memory increases the amount of bandwidth available by 50%, he noted.

    Graviton processors now provide the lowest-priced instance of virtual machines in addition to the best performance and overall price/performance across the AWS portfolio, Kulkarni added.

    AWS is making a case for employing its AWS Graviton processors for general-purpose workloads as more IT teams are being tasked with reducing costs as the overall number of applications being deployed in the cloud continues to increase. In fact, all of the top Fortune 50 companies have already deployed workloads on Graviton processors, noted Kulkarni.

    While it’s not clear how many applications are being developed to run natively on Arm processors, the process of refactoring existing applications to run on Arm processors is not as intensive for most applications as it was when previously moving applications from one class of processors to another.

    In addition, Kulkarni noted AWS has committed to providing a full range of DevOps services, including a continuous integration/continuous delivery (CI/CD) platform, to help facilitate any transition to Graviton processors.

    There are, of course, multiple strategies for containing cloud costs that range from committing to consuming a specified amount of compute resources annually at discounted rates to relying more on spot instances that are available for limited amounts of time. Regardless of approach, the days when developers were allowed to invoke cloud resources at will appear to have come to an end as enterprise IT organizations become more aware of the total cost of IT. As a result, many of them are adopting financial operations (FinOps) best practices to maximize the utilization of cloud infrastructure resources.

    AWS, like most cloud service providers, gives organizations a wide range of processor options. However, it’s apparent that AWS views Arm processors in the form of Graviton to be the most efficient from both a price and performance perspective. It’s not clear how quickly organizations are embracing Graviton in the cloud given the dominance of x86-based platforms, but it’s apparent there is now a clear alternative for general-purpose workloads. If fact, the more data-intensive those workloads become, the greater the interest in more efficient processor architectures.

    Of course, x86 platforms are not going away anytime soon. But as more Arm-based processors find their way into the enterprise, DevOps workflows will only become more challenging to manage.

  • Checkly Adds Monitoring-as-Code to Testing Platform

    Checkly Adds Monitoring-as-Code to Testing Platform

    Checkly this week added a monitoring-as-code (MaC) workflow capability to its software-as-a-service (SaaS) platform that is used to create synthetic tests for applications.

    The Checkly platform spins up browsers to test and can now monitor how applications are performing at both the user interface and application programming interface (API) level. That capability, currently available in beta, is enabled via a command line interface (CLI) for accessing an instance of TypeScript to invoke MaC workflows.

    Checkly CEO Hannes Lenke said that integrated approach enables application development teams to observe applications in as little as 60 seconds without instrumenting them with agent software.

    As part of that effort, Checkly also made generally available Playwright Test, a testing platform for web applications that spins up modern browsers on demand in addition to updating its public dashboards and adding an analytics API.

    Finally, the Checkly SaaS platform has passed a SOC 2 Type II security audit.

    Lenke said the overall goal is to make it simpler for developers to discover and remediate issues as they assume more responsibility for the ongoing management of applications.

    It’s not clear whether developers are taking over responsibility for testing and monitoring applications, but as more responsibility for applications shifts left, organizations are looking to give developers the tools they will require to succeed. That doesn’t mean IT operations teams won’t need to continue to monitor IT environments, but developers do need integrated tools that give them enough meaningful context to address them as they write code. Synthetic testing tools also enable developers to address many routine issues long before they might be discovered by a dedicated testing team that should be focused on ensuring the overall quality of the user experience.

    Regardless of the approach to testing and monitoring, Lenke noted that the silos that make up the software development life cycle are becoming more tightly integrated in modern application development environments. The primary objective is to make it possible for organizations to accelerate application development without compromising quality, he added.

    Of course, the more testing that occurs early in the application development process, the fewer issues a DevOps team should encounter after an application has been deployed in a production environment. The issue is that, historically, much of that testing occurs late in the application development process. Each time a project falls behind schedule, there is naturally a greater temptation to reduce the amount of time spent on testing to ensure the on-time delivery of an application. Providing developers with tools for testing and monitoring applications as they are being built should ensure that the proper level of testing is occurring before an application is deployed.

    There will, however, never be a perfect application. Over time, DevOps teams will discover that every application is impacted by drift to varying degrees as updates are made and the underlying infrastructure is upgraded. The most critical issue is reducing the number of potential issues overworked DevOps teams may need to address later on by ensuring the code being deployed is of the highest quality possible.

  • Sysdig Launches Wireshark Foundation

    Sysdig Launches Wireshark Foundation

    Sysdig this week announced there is now a Wireshark Foundation that will oversee future development of the widely used open source traffic protocol analyzer.

    Gerald Combs, who is now director of open source projects at Sysdig, along with Loris Degioanni, CTO of Sysdig, launched Wireshark in 2006 to enable teams to monitor network traffic, learn protocols and packet basics and troubleshoot network problems. There are more than 2,000 contributors and Wireshark has been downloaded more than 60 million times in the last five years alone.

    The Wireshark Foundation will provide a framework for long-term stewardship and sustainability. The foundation will be led by Sheri Najafi as executive director, and Janice Spampinato, Hansang Bae, Najafi, Combs and Degioanni will serve on the board.
    Combs said rather than donating Wireshark to an existing foundation, it was decided to set one up to formalize many of the community processes that have evolved over the past two decades.

    Degioanni said the foundation will also ensure Wireshark remains relevant long after its creators eventually retire. Wireshark has a graphical user interface (GUI) that provides IT teams with an easy-to-understand traffic protocol analyzer. However, as applications become more distributed, additional types of IT professionals, including DevOps teams, are analyzing network traffic. Similarly, cybersecurity teams are using these tools to help track down the source of anomalous activity.

    It’s not clear whether network operations (NetOps) and DevOps workflows are merging, but the level of collaboration has increased. As networking increasingly becomes software-defined, it’s clear that developers will employ application programming interfaces (APIs) to manage networks as code in much the same way they do infrastructure in the public cloud. Most of those networking APIs are comparatively low-level, but with the rise of services meshes, it’s clear networking services are becoming more accessible.

    The biggest challenge is distinct cultures that have arisen around networking and application development. IT organizations will need to decide whether to provide development teams with the ability to programmatically invoke networking services on their own or through a self-service portal managed by a NetOps team. Regardless of who is responsible for managing the network going forward, the divide between DevOps and NetOps is already starting to narrow. The biggest challenge is simply finding a common language to express core concepts that eliminates any sense of fiefdom that might exist between them. After all, any conflict that arises can usually be attributed to a simple failure to communicate.

    In the meantime, in the age of edge computing, network latency issues are becoming even more challenging. An application based on microservices architecture is especially sensitive to network latency issues that are difficult to troubleshoot over an extended network. Tools that make those issues more obvious are crucial.

  • How GitHub Actions Simplifies Your CI/CD Workflow

    How GitHub Actions Simplifies Your CI/CD Workflow

    In today’s fast-paced world, being able to deploy applications quickly is essential for success. However, setting up a CI/CD pipeline can be a tedious and time-consuming task. Fortunately, GitHub Actions can help simplify and automate your workflow, making it easier than ever to get your applications up and running in no time. In this blog post, we’ll take a look at how to set up a React application with GitHub Actions and explore the benefits of using this tool for your CI/CD needs.

    Continuous Integration and Continuous Deployment

    Continuous integration (CI) and continuous deployment (CD) are essential components of any product development workflow. CI is the process of automatically building and testing code changes, while CD is the process of automatically deploying code changes to a production environment. Both CI and CD help to ensure that code changes are deployed quickly and efficiently, with minimal errors.

    Setting up a CI/CD pipeline can be a tedious and time-consuming task, particularly if you are not familiar with the required tools and technologies. However, using GitHub Actions can help to simplify and automate your CI/CD workflow, making it easier and faster to deploy your code changes.

    GitHub Actions is a powerful tool that can be used to automate many different tasks, including building, testing and deploying code changes. In addition, GitHub Actions can be used to trigger other actions in response to specific events, such as when a code change is pushed to a remote repository. This makes it an ideal tool for automating your CI/CD workflow.

    There are many advantages to using GitHub Actions for CI/CD. First, it is easy to set up and use, even if you are not familiar with the underlying technology. Second, it integrates seamlessly with GitHub, making it easy to track and manage code changes. Finally, it is highly customizable, allowing you to tailor the automation process to meet your specific needs.

    Setting up a React Application

    React is a popular JavaScript library for building user interfaces. Setting up a React application is not complicated, but there are a few important steps you need to follow.

    1. Choose your development environment. You can use create-react-app to set up a development environment with all the necessary dependencies and scripts.
    2. Install React and ReactDOM. React is the library that handles rendering of UI components while ReactDOM takes care of interaction with the DOM.
    3. Create a component file. In this file, you will write your UI code using JSX syntax.
    4. Include the component file in your HTML page. Now you can see your component rendered on the page!

    Development Mode and Production Mode

    In software development, there are two primary modes that code can be run in: development mode and production mode. Development mode is typically used by developers when they are actively working on code. In this mode, code is usually not optimized and may include debugging features that help developers identify and fix errors. Production mode, on the other hand, is used when code is ready to be deployed to end-users. In production mode, code is typically optimized for performance and security.

    One of the benefits of using GitHub Actions is that it makes it easy to manage both development and production workflows from a single platform. With GitHub Actions, you can create separate workflows for development and production, or you can create a single workflow that automatically detects whether code is being pushed to a development or production branch. This flexibility can simplify your CI/CD pipeline and help you avoid errors that can occur when manually managing multiple workflow files.

    To learn more about how to use GitHub Actions to simplify your CI/CD pipeline, check out the following resources:
    – [GitHub Actions documentation](https://help.github.com/en/articles/about-github-actions)
    – [Tutorial: Use GitHub Actions to deploy a static website](https://help.github.com/en/articles/configuring-a-workflow#creating-a-workflow-file)
    – [CI/CD with GitHub Actions blog post](https://blog.github.com/2019-08-08-introducing-github-actions/)

    Setting up GitHub Actions

    Setting up GitHub Actions is simple and only requires a few steps.

    First, you’ll need to create a new file in your project’s root directory called “.github/workflows/ci.yml”. You can name this file whatever you like, but for the purposes of this article we’ll call it “ci.yml”.
    In this file, you’ll need to specify the language your project is written in and the name of the action you want to run. For example, if your project is written in JavaScript and you want to run the “lint” action, your file would look like this:

    name: CI
    on: [push]
    jobs:
    build:
    runs-on: ubuntu-latest
    steps:
    – uses: actions/checkout@v2
    – name: Use Node.js ${{ matrix.node-version }}
    uses: actions/setup-node@v1
    with:
    node-version: ${{ matrix.node-version }}

    Breakdown of the Actions File

    In the “ci.yml” file, there are three main sections: “name”, “on”, and “jobs”. The “name” section is where you specify the name of your CI workflow. The “on” section is where you specify the events that will trigger your workflow to run. In this example, the workflow will run every time code is pushed to any branch. The “jobs” section is where you define the actual jobs that make up your workflow. In this example, there is only one job called “build”.

    The “build” job has two steps. The first step checks out the code from GitHub. The second step runs a Node.js linter on the code to check for syntax errors. If any errors are found, they will be displayed in the GitHub UI.

    You can also add additional jobs to your workflow, such as testing or deployment jobs. For example, you could add a job that automatically deploys your code to a staging environment whenever code is pushed to the development branch. This would allow you to test new features in a safe environment before deploying them to production.

    Adding additional jobs can help simplify your CI/CD pipeline by automating more of the process. This can free up time for other tasks, such as writing documentation or working on other features.

    Running the Action

    Assuming you have already set up a workflow file (ci.yml) and added a job to it, running the workflow is simple. All you need to do is push some code to your GitHub repository and the workflow will automatically run.

    You can also manually run a workflow by going to the Actions tab of your GitHub repository and clicking the “Run Workflow” button. This can be useful for debugging purposes or if you want to run a particular job without pushing code.

    If you want to see the output of a workflow, you can go to the Jobs tab and click on the job that you want to see. This will show you the log output of the job as it ran.

  • Vercel Adds Observability Tools to Web Application Framework

    Vercel Adds Observability Tools to Web Application Framework

    Vercel today announced it has added a suite of observability tools to its platform for building web applications using Next.js, an instance of the open source React framework based on a JavaScript library.

    Vercel CTO Malte Ubl said the Vercel Monitoring tools make it simpler for developers to troubleshoot applications without relying on a DevOps team to surface data. Instead, developers can take advantage of Vercel Monitoring tools to access metrics that track user interface and application programming interface (API) issues, he added.

    That capability is not intended to replace the need for observability tools employed by DevOps teams. Instead, the goal is to provide metrics that are specific to issues that developers encounter as an application is being built or after it has been deployed so they can be addressed.

    Developers can select from pre-made queries provided by Vercel or create their own by defining what metrics they want the Vercel Monitoring tools to track, including bandwidth and web traffic spikes and requests by bots that are indicative of a cyberattack. In total, there are more than 500 potential errors that developers can track. Logs then make it possible to drill down into errors and issues once they are identified to pinpoint the root cause of an issue.

    As more responsibility for applications shifts left toward developers, there’s a clear need for tools that provide more visibility into the applications they develop. Many of the issues that DevOps teams encounter today could have been resolved if developers had been aware of them earlier.

    The Vercel platform employs caching, routing and a React framework to optimize application performance in a way that reduces the dependency on backend infrastructure to optimize application performance. That approach puts less strain on backend infrastructure as more requests are automatically processed using a framework that spans clients and servers. In effect, developers can take advantage of frameworks such as React to treat the underlying IT infrastructure as if it were serverless whenever possible with tools that have a familiar JavaScript construct. The overall goal is to increase developer productivity at a time when many organizations are much more focused on the issue.

    As a result, DevOps teams will need to make some adjustments as more applications capable of providing richer experiences are built and deployed without relying as much on backend infrastructure. That shift has implications for everything from the amount of network bandwidth consumed to the performance of web applications. Frameworks such as Next.js also tend to increase the overall rate at which web applications can be built and deployed.

    One way or another, it’s clear that the way web applications are being built is fundamentally changing. The only issue now is determining to whether DevOps teams are prepared to absorb that level of change across an ever-increasing portfolio of applications that still need to be deployed, secured, updated and optimized.

  • WTH? WFH is 6× Pre-Covid ¦ Plus: Agile Sucks (Redux)

    WTH? WFH is 6× Pre-Covid ¦ Plus: Agile Sucks (Redux)

    Welcome to The Long View—where we peruse the news of the week and strip it to the essentials. Let’s work out what really matters.

    This week: Working from home is here to stay, and Agile is still a failure. (more…)

  • Nobl9 Adds Service Level Analyzer to SLO Management Platform

    Nobl9 Adds Service Level Analyzer to SLO Management Platform

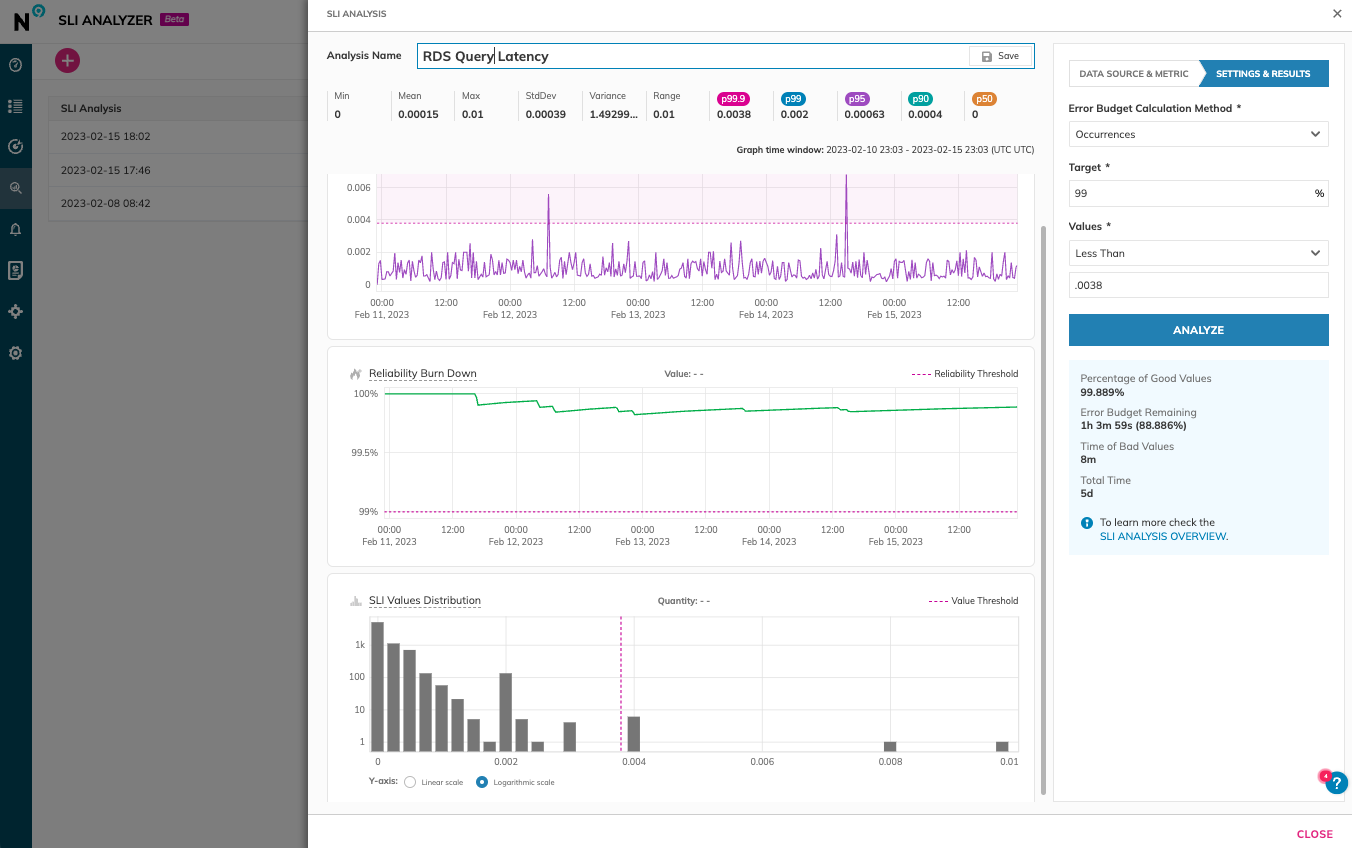
    Nobl9 today added a free tool for analyzing service level objectives (SLOs) to its platform to enable DevOps team to more accurately set reliability goals.

    Brian Singer, chief product officer for Nobl9, said Service Level Analyzer collects metrics and observability data from more than 24 DevOps tools and platforms that can then be used to create an SLO via a single click.

    Included as part of the free tier of the Nobl9 service, Service Level Analyzer also enables DevOps teams to more easily update SLOs as error budgets and error budget burn rates change over time based on actual incidents that have occurred, added Singer.

    DevOps teams can also perform “what-if” analysis to test out the impact of different targets and thresholds on error budgets, he added. That capability ultimately reduces costs because DevOps teams become less likely to overprovision resources to ensure application performance and resiliency, noted Singer. In effect, Service Level Analyzer is providing DevOps teams with an observability tool that spans the entire software development life cycle, said Singer.

    Nobl9 is trying to spur greater adoption of SLOs by making available an open source SLO specification that defines a common interface for constructing SLOs across a DevOps workflow. SLOs, of course, are not a new idea. They have been employed as a metric to track the performance of IT services for decades. However, as more microservices-based applications are built and deployed, it’s becoming more challenging to maintain SLOs across applications because they have many more dependencies than legacy monolithic applications.

    Ultimately, each DevOps team needs to provide some sort of objective benchmark that assesses their overall effectiveness at delivering application services. SLO-as-code is intended to make it simpler to gather the metrics that confirm whether service levels are being achieved. As organizations become more dependent on software to drive digital processes, those SLOs are then tracked across everything from financial services to supply chains.

    In general, DevOps teams are more comfortable with the SLO concept, said Singer. The biggest challenge is making them simpler to implement, he added. The Service Level Analyzer lowers the bar for implementing an SLO by making historical data stored in DevOps tools and platforms more accessible, noted Singer. Rather than having to manually collect that data and then normalize it in an external repository, Nobl9’s Service Level Analyzer automates that process on behalf of a DevOps team using actual data versus relying on less precise statistical analysis, said Singer.

    As IT environments become more distributed, the number of dependencies that exist across application environments only continues to expand. IT teams can spend weeks trying to discover the root cause of issues that are negatively impacting application performance, only to discover that, for example, calls to an application performance interface (API) are being rerouted in a way that significantly increases latency. Tools that enable DevOps teams to more easily understand the relationships between all the services that make up an application environment are more crucial than ever.