Category: Application Performance Management/Monitoring

  • What the Convergence of Observability and Security Means for Devs

    What the Convergence of Observability and Security Means for Devs

    There is a scene in the movie Apollo 13 when the mission control flight director asks why the carbon dioxide scrubber in the command module was a different shape than the one used in the lunar module (and therefore incompatible). The engineer simply replied, “This just isn’t a contingency we’ve even remotely looked at.”

    A similar scenario plays out at many organizations when they examine security and development practices. When it’s time for code to go into production, every developer hopes their code will run as planned–smoothly and error-free. Unfortunately, something will be missed, performance could degrade or new, unanticipated problems can emerge after an application is deployed to production.

    Developers fear the “unknown unknowns.” And it keeps them up at night.

    When an “unknown unknown” problem occurs, it takes time for teams to do the forensics to identify the problem. It can take days or even weeks for teams to complete that initial investigation. If a mission-critical application is offline for a significant period of time due to a forensics investigation, then it can negatively affect your customer’s experience and, ultimately, your organization’s bottom line.

    The “unknown unknowns” problem is another challenge facing developers in today’s unpredictable macro environment. That includes the deluge of data, increasing cyberthreats, an increasingly distributed infrastructure and a remote and hybrid workforce as well as a mix of modern cloud-native and monolithic apps.

    To help developers build for the future and address security concerns, it is imperative they rethink the way they are collecting, operationalizing and storing different types of data from a variety of sources.

    Security and Observability: Better Together

    Today, security and observability have recently begun to overlap, driven by the growing need for organizations to better understand the activity inside their environments. Many forward-thinking organizations are operationalizing the massive amounts of log and event data currently being generated to understand and assess issues in their infrastructure and apps and using these actionable insights to optimize workload, app resource availability, security and uptime.

    So how can developers take advantage of the security and observability convergence trend happening right now?

    Currently, it’s common for developers to have two agents as part of their tech stack. One agent for observability, which is collecting data such as logs and events to get relevant insights into the health and performance of their application in real-time. The other agent is for security to collect data in their devtest, integration and production environments.

    Since these two agents often collect the same data, there is an opportunity to consolidate it into a single location, such as a unified security platform with a single agent, where this data can be overlaid with time series analytics to deliver relevant insights to users. Using this approach of having both security and non-security data in one place will significantly speed up the process of getting these valuable insights into the developer’s hands.

    In addition to getting insights faster, another benefit of having this data in a single location is the ability to access historical data. Giving developers the ability to store and manage data for long periods of time allows them to get insights from this historical data, so they can better understand alerts, incidents and adversaries. This can help them correlate in terms of understanding the risk to an application, such as potential “unknown unknown” threats, which they can proactively address before it causes any damage.

    Adopting a converged security and observability approach is the most mature step that organizations can take to help developers deliver the best outcomes and best experiences for their customers and users. As more organizations rely on the cloud and the speed of business rapidly increases, developers must transform their view of the health, performance and security of applications and infrastructure. Giving developers this perspective will dramatically help them take rapid action against an adverse event before it impacts their company’s bottom line.


  • Three is the Magic Number: Planning and Executing a Successful DevOps Project

    Three is the Magic Number: Planning and Executing a Successful DevOps Project

    Diligent preparation, clearly defined workflows and watchful monitoring are key to delivering a high-performing DevOps project. DevOps is one of the hottest buzzwords in programming, but everyone seems to have their own ideas when it comes to structuring and deploying a DevOps team.

    In basic terms, DevOps is the integration of developers and IT operations workers into a single group, with the goal of increasing the speed and quality of software deployment. Its creation was a response to concerns over the segregation of teams, which led to communication breakdowns and a lack of cohesion.

    Since its inception, DevOps has grown in popularity, with 83% of IT decision-makers stating that they have implemented this style of working in some form.

    However, transitioning business focus in this way does not guarantee an immediate change in fortunes–this dynamic represents an IT culture shift, with increased emphasis placed on collaboration and interpersonal skills. For this model to yield returns, engineers should be open to new information, technology and ways of working.

    So, what vital steps must a DevOps team take to ensure the successful delivery of a project?

    Understanding the Needs of the Client

    The preliminary stages can make or break a DevOps project. If the team does not emerge with a vivid idea of what the client wants and how this can be delivered, the venture is doomed to failure.

    It is crucial that both the team and the client are willing to put the time in to understand each other’s goals, ensuring that their visions align for the steps to follow. This can be done through a series of meetings and workshops, where objectives are identified and both establish a good comprehension of how the final product should look.

    If executed correctly, the DevOps team will exit the project’s first phase with a well-defined brief and a crystal-clear understanding of what the client wants to see delivered. When this step is rushed, engineers will be held back by a lack of direction, increasing the chances that the finished product will not reflect the client’s hopes.

    Configuring the Environment

    This next phase is where the developmental process of the app begins, which is usually facilitated using a cloud-based solution. The team begins by preparing the environment’s aesthetic, working out the components it should contain and exploring how they should be configured to maximize efficiency.

    It is during this period that cybersecurity measures are added so that the final version of the app is as close to impenetrable as possible. This shows why a DevOps team needs a diverse range of skill sets: Cybersecurity experts are few and far between, but there should be at least one member of the group whose knowledge can be called upon to ensure protective measures are properly implemented.

    A successful developmental phase is underpinned by clearly structured workflows, with the project mapped out step by step and everyone involved understanding where they fit into the plan and how they can contribute.

    However, a DevOps project is rarely smooth sailing from start to finish–development is often disrupted by missed deadlines, bugs and conflicting duties pulling engineers away from their stations. For this reason, agile and multi-skilled team members, who can ably jump in and assist in various areas, are extremely important for ensuring continuity when workflows are derailed.

    Avoid Failing at the Final Stages of the Project

    Just because the development of a product is complete and the app is live, this does not mean it is time for the DevOps team to rest on their laurels and move on to the next project. It is essential that they continue to monitor the app in its early stages so that any bugs can be identified and immediately fixed.

    Engineers should be in place to see how much the environment is burdened and how it responds depending on the rate and number of new users. Any data obtained is a precious commodity and should be treated as such, with teams ordering and labeling results as soon as they are collected.

    Once the baseline data has been gathered, results can be analyzed to pinpoint which parts of the app may need recalibrating. After making these improvements, the final result should be a product performing at an optimal level while also meeting the client’s specifications.

    Don’t Rush the Project’s Process

    At the conclusion of all three phases, DevOps teams should have absolute confidence that the project is headed in the right direction and that they are fully equipped to execute the next procedural steps.

    A well-designed app is far easier to produce when a team is made up of specialists from an array of fields eager to collaborate and communicate with one another. Assembling the right personnel will aid the smooth transition between the stages of a DevOps project.

  • A History of Distributed Tracing

    A History of Distributed Tracing

    Organizations are increasingly using distributed tracing to monitor their complex, microservice-based architectures. Distributed tracing has become essential in microservice applications, cloud-native and distributed systems. Microservices and serverless applications can grow exponentially, which makes observing them at scale very challenging. The traditional logging method becomes expensive, and if there’s an issue, time-series data can reveal symptoms but not the root cause(s). With modern usage patterns of Kubernetes service mesh like Istio and Envoy, for example, there can be billions of microservices calls daily.

    What is Distributed Tracing?

    Traces describe the progress of a transaction or workflow through a system. Distributed tracing provides visibility into service dependencies and their interdependencies by providing end-to-end visibility. Visualizing transactions in their entirety allows you to compare non-normal traces with normal ones to determine differences in behavior, structure and timing. Through distributed tracing, you can identify bottlenecks in your system. As a traced request flows through a network, it can be tracked. 

    As requests flow from frontend to backend and to databases, traces provide diagnostic techniques that reveal how a set of services coordinate to handle an application request. Using distributed tracing, developers can troubleshoot requests with errors and high latency. A single trace typically shows the activity of a request or transaction within an application. A trace shows what has changed at each step. As you aggregate the traces, you can see which backend service or database has the most significant impact on performance. 

    The History of Distributed Tracing

    Dapper, a large-scale distributed systems tracing infrastructure, was introduced by Google in 2010. Two years after Dapper was made public, Twitter open sourced Zipkin, which was designed for application performance tuning. Zipkin was the first open source distributed tracing project. Zipkin trace data can be collected and visualized using a UI. In 2015, Uber launched Jaeger, which was inspired by Dapper and named after the German word for hunter. Later in 2017, Uber published a blog post, called Evolving Distributed Tracing at Uber Engineering, explaining the reasons for the architectural choices in Jaeger. In addition to creating Jaeger, its author, Yuri Shkuro, wrote a book about distributed tracing called Mastering Distributed Tracing. 

    In 2016 Ben Sigelman, founder of Lightstep, wrote a blog post called Toward Turnkey Distributed Tracing, describing OpenTracing as a single standard. Some people refer to this as the OpenTracing Manifesto. OpenTracing allows developers of application code, open source packages and open source services to instrument their code without binding themselves to any particular tracing solution. The goal of OpenTracing was to solve a standardization problem. Trace context must pass through all the components, including application code, dependent libraries, standalone open source services (Nginx, MySQL) and other vendor-specific libraries and services, to collect a complete distributed trace. Collecting a full path without a standard API to define the collection and passing of trace context is difficult. OpenTracing aims to solve this problem by defining a standard API that can be implemented by components from different tracing solutions, allowing the collection of end-to-end tracing data. The Cloud Native Computing Foundation (CNCF) accepted OpenTracing as its third project in October 2016. Two months later, OpenTracing 1.0 was released. After OpenTracing, Jaeger joined the CNCF. 

    W3C tracing context specification was proposed in November 2019, bringing distributed tracing closer to standardization. Over ten years, distributed tracing evolved from one paper to an active community. With standardization on all the layers, it is moving from just tracing to overall observability, ranging from latency optimization to root cause analysis and application performance management. It is moving from a single backend system to an end-to-end solution that spans multiple systems. 

    OpenTracing and OpenTelemetry merged in 2019. Using OpenTelemetry, distributed tracing can be implemented end-to-end. It released version 1.0 in 2021. CNCF’s OpenTelemetry project is one of the fast-growing projects, and OpenTelemetry has become the de facto standard for tracing, metrics and logging.

    How it Works

    Traces in distributed tracing consist of tagged time intervals called spans. It is possible to think of a span as a unit of work. Traces are directed acyclic graphs (DAGs) composed of segments known as spans. According to OpenTelemetry, There are four major components of a trace:

    • traceID
        • A unique 16-byte array to identify the trace that a span is associated with
    • spanID
        • Hex-encoded 8-byte array to identify the current span
    • Trace Flags
        • Provides more details about the trace, such as if it is sampled
    • Trace State
        • Provides more vendor-specific information for tracing across multiple distributed systems. Please refer to W3C Trace Context for further explanation.

    The spans in a trace consist of contiguous segments of work that are named and timed. There are start and end times for spans, as well as metadata such as tags or logs that help classify them. Parent-child relationships may be present between spans to show how particular transactions traverse the application’s numerous services and components. 


    A trace represents an end-to-end request; it can contain one or more spans. Spans indicate work performed by a single service with associated time intervals and metadata. The purpose of traces is to provide a request-centric view of spans through tags. Despite microservices enabling teams to work independently, distributed tracing offers a central resource that allows all teams to understand issues from a user’s perspective.

    Conclusion

    In distributed systems, response latency can have a significant commercial impact. Identifying bottlenecks and understanding how a request moves through a complex system is complicated. Other techniques, like logging and monitoring metrics, don’t provide insight into distributed applications such as those created with microservices architecture. Several open standards and tools are emerging within the distributed tracing space, like OpenTracing and commercial tools that could compete with existing APM solutions. Implementing distributed tracing for modern cloud-native services poses several challenges. OpenTelemetry tracing is necessary for processing high volumes of trace data while generating meaningful insight.

  • AWS Makes Economic Case for Graviton Processors

    AWS Makes Economic Case for Graviton Processors

    Amazon Web Services (AWS) is making available in preview a C7gn instance on the Amazon Elastic Compute Cloud (Amazon EC2) based on AWS Graviton processors. The C7gn instances provide up to 200 Gbps network bandwidth and as much as 50% higher packet-processing performance compared to previous-generation C6gn instances.

    Announced at the AWS re:Invent 2022 conference, these instances are based on Arm processor architecture that AWS provides as an alternative to x86 processors.

    Rahul Kulkarni, director of product management for Amazon EC2, said interest in more efficient AWS Graviton processors has spiked sharply as the overall economic outlook softened. More IT teams than ever are being tasked with finding ways to reduce costs as the overall number of applications being deployed in the cloud continues to grow, he added.

    While it’s not clear how many applications are being developed to run natively on Arm processors, Kulkarni noted that the process of refactoring existing applications to run on Arm processors is not as intensive for most applications as it was when previously moving applications from one class of processors to another.

    Overall, AWS now offers more than 600 types virtual machine instances on its cloud platform, including a set of Inf2 instances, available in preview, based on custom AWS processors that are optimized for processing workloads that include machine learning algorithms that drive artificial intelligence (AI) models.

    Every AWS instance takes advantage of a set of AWS Nitro Cards that offload the overhead virtualization creates so IT organizations can take full advantage of compute resources without having to allocate any resources to run virtualization software, noted Kulkarni. That virtualization tax is instead absorbed by AWS to reduce total cloud costs for the customer, he added.

    In addition, more customers are taking advantage of tools such as AWS Cost Optimizer and AWS Karpenter for Kubernetes clusters that employ machine learning algorithms to identify opportunities to reduce the cost of cloud infrastructure by, for example, shifting workloads to different classes of services.

    There are, of course, multiple strategies for containing cloud costs that range from committing to consuming a specified amount of compute resources annually at discounted rates to relying more on spot instances that are available for limited amounts of time. Less effective is moving workloads from one cloud provider to another simply because the total cost migrating workloads can be substantial depending on the number of proprietary application programming interfaces (APIs) that have been invoked.

    Regardless of approach, the days when developers were allowed to invoke cloud resources at will appear to have come to an end. Enterprise IT organizations are a lot more conscious of the total cost of IT in the cloud era. As a result, many of them are adopting financial operations (FinOps) best practices to maximize utilization of cloud infrastructure resources.

    It’s not clear how readily IT organizations will embrace AWS Graviton alongside other classes of Arm processors to achieve that goal, but as the economic outlook continues to remain uncertain, there is no doubt all options are now on the table.

  • Nobl9 Adds Free Tier to SaaS Platform for Managing SLOs

    Nobl9 Adds Free Tier to SaaS Platform for Managing SLOs

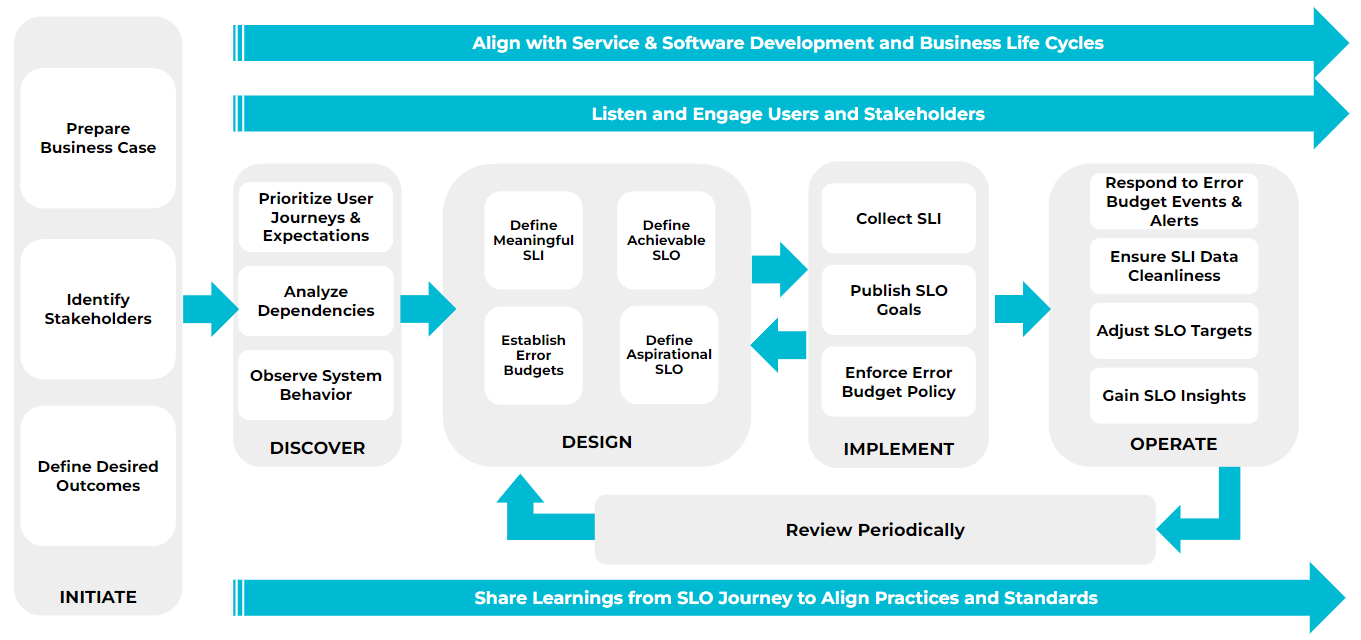
    Nobl9 this week announced it is making available a perpetual free tier of its software-as-a-service (SaaS) platform for managing service level objectives (SLOs).

    The free tier was announced at the AWS re:Invent 2022 conference and the company also revamped its pricing. Nobl9 Teams Edition (formerly Nobl9 Hydrogen) now includes 50 SLOs, up from 25, for $850/month. Nobl9 Enterprise Edition also has doubled the included SLOs from 75 to 150.

    Finally, Nobl9 also launched SLOcademy to help educate IT teams on how best to create and manage SLOs.

    The Nobl9 platform simplifies the creation and tracking of SLOs using metrics and observability data collected from more than 24 widely used DevOps tools including Prometheus as well as services provided by Datadog, New Relic, Dynatrace, Google, Amazon Web Services (AWS) and Splunk.

    Kit Merker, chief growth officer for Nobl9, said the company’s platform collects signals from logs, metrics and traces to define what normal should look like for any given service. The free tier of the platform has some limitations, but it does provide access to the full-featured platform to enable IT teams to get started managing SLOs.

    SLOs, of course, are not a new idea. They have been used as a metric to track the performance of IT services for decades. It’s not clear whether reliance on SLOs has waned over the years or if application environments simply became too complex to track meaningful metrics. However, as applications are increasingly viewed as services, it’s now only a matter of time before SLOs become more widely adopted across a modern application environment. The challenge, of course, is that defining an SLO is a lot easier than maintaining it—especially within today’s highly dynamic cloud-native application environments where services with lots of dependencies tend to come, change and go unexpectedly.

    Nobl9 is making a case for an SLO-as-code approach that makes it simpler to track service levels. A recent survey of more than 300 IT managers and executives conducted by Dimensional Research on behalf of Nobl9 found only 29% of respondents had no plans to implement SLOs. A full 94% of respondents that have or plan to implement SLOs intend to map them directly to business operations, with 91% reporting that they expect that effort to improve decision-making. More than 80% also said their organizations are planning to increase the use of SLOs, with 87% indicating SLOs should improve overall microservices performance.

    The challenge is that most organizations have limited visibility into their IT environments. The survey, for example, found less than half of respondents (46%) had visibility into all their IT environments. Only 45% and 35% claim to have visibility into containers and microservices, respectively. More than three-quarters (78%) said hybrid clouds make observability more difficult. Ironically, 45% of companies reported they already employed 11 or more observability and monitoring tools. On the plus side, 31% have hired site reliability engineers (SREs) while nearly half (46%) planned to create that role.

    It may be a while before most IT teams are organized around the concept of applications as services but as the management of IT continues to evolve it’s now just a matter of time before that approach becomes more the rule than the exception.

  • Datadog Dives Into Universal Service Monitoring

    Datadog Dives Into Universal Service Monitoring

    Datadog, Inc. today made generally available a Universal Service Monitoring service that takes advantage of the extended Berkeley Packet Filtering (eBPF) microkernel in a Linux operating system to automatically detect all the services that make up an application environment without changes to the code used to construct them.

    Yrieix Garnier, vice president of product at Datadog, said as application environments continue to evolve IT teams are now trying to track not just individual microservices but also entire business processes such as order-to-cash. Before those services can be instrumented, however, DevOps teams need a simple way to discover them, he noted.

    Within the Linux operating system, eBPF makes it possible to employ a sandbox environment to identify and map the services that make up an application environment, including both internally developed and third-party services regardless of what programming languages were used to build them, added Garnier.

    DevOps teams also gain visibility into the health of every service and deployment through real-time request rate, error and duration (RED) metrics and correlated infrastructure metrics and application logs. They can then expand monitoring capabilities provided via Datadog agent software to employ distributed traces that can be correlated with observability data.

    The Datadog Universal Service Monitoring service is also integrated with the Service Catalog that Datadog makes available to determine which development team created a specific service.

    The goal is to close a visibility gap that has emerged as more IT organizations align their management efforts around specific application services in the age of digital transformation rather than the components that make up a service, noted Garnier.

    DevOps teams today are simultaneously being tasked with diving deeper into application environments to discover issues before services are disrupted and also tracking the services that span multiple application components. Collectively, the expectation is that DevOps teams will be able to ensure that application services are not just available but also consistently delivered. Ultimately, IT organizations are being tasked with removing much of the guesswork that has historically characterized the management of IT.

    Less clear is how much those shifts will ultimately drive the reorganization of IT teams that are still mostly organized around the platforms they support versus the services being delivered. However, as business leaders increasingly appreciate how dependent the overall organization is on application services, the need to manage them in a more comprehensive manner becomes apparent.

    In the meantime, DevOps teams are evaluating whether their existing tools and platforms enable them to accomplish that goal. Datadog is making a case for employing a service it manages on behalf of DevOps teams versus each DevOps team having to construct and maintain its own observability platform. Datadog, most recently, extended the reach of its namesake cloud-delivered monitoring and observability platform to address continuous testing, application security and cost management.

    It will be up to each organization to decide how best to achieve their observability goals. One thing that is certain is the current level of visibility they have into application environments is not nearly sufficient.

  • Logz.io Unveils Managed Open 360 Observability Platform

    Logz.io Unveils Managed Open 360 Observability Platform

    At the AWS re:Invent 2022 conference, Logz.io launched an Open 360 platform that combines multiple open source technologies to provide observability across both existing monolithic and emerging cloud-native application environments.

    Existing Logz.io offerings included in the Open 360 platform are Logz.io Kubernetes 360, a managed observability platform based on open source tools such as OpenSearch analytics software, Prometheus monitoring tools and Jaeger distributed tracing agents.

    In addition, Open 360 includes Logz.io Telemetry Collector agent software, Logz.io Data Optimization Hub dashboard, Logz.io LogMetrics Index for converting log data into metrics and the Logz.io Trace Sampling Wizard tool for configuring open source OpenTelemetry Collector agent software.

    Logz.io CEO Tomer Levy said rather than requiring organizations to combine a set of disjointed open software tools to create an observability platform, instances of open source tools have been curated by Logz.io. The goal is to streamline the number of tools and platforms that DevOps teams will need to observe multiple classes of applications, he noted.

    It’s still early days as far as the adoption of observability platforms is concerned, but it’s apparent that as application environments become more complex the monitoring tools DevOps teams rely on today will need to evolve. Observability platforms, in general, promise to unify logs, metrics and traces in a way that makes it simpler to launch queries to identify the root cause of an issue rather than simply tracking a set of pre-defined metrics.

    The rate at which DevOps teams will embrace observability will naturally vary, but the choice many DevOps teams are trying to navigate is how much to rely on proprietary observability platforms rather than using open source software to construct their own. Logz.io is making a case for finding a middle ground between those two extremes by relying on a managed service based on open source tools.

    Observability has always been a core DevOps tenet, but achieving and maintaining it is challenging. Most DevOps teams today aspire to maintain some level of continuous monitoring. However, as it becomes easier and less costly to instrument applications, interest is rising in observability platforms that simplify the investigation of anomalies indicative of an issue that could disrupt a distributed application environment.

    More challenging still, DevOps teams are also now managing a much wider range of application types as cloud-native applications based on microservices deployed on Kubernetes clusters are deployed alongside legacy monolithic applications running in the cloud and on-premises IT environments. The Logz.io approach enables DevOps teams to manage those applications at a lower total cost, noted Levy.

    Regardless of the approach to observability, the increasing complexity of application environments has become a major challenge for organizations that are increasingly sensitive to costs. Many of them can’t afford to hire additional DevOps engineers. Instead, the focus is on increasing the productivity of existing DevOps teams using a new generation of observability platforms that should cost less to acquire and deploy than to expand existing teams of DevOps engineers. That may not necessarily eliminate the need to hire additional DevOps engineers, but it should ensure organizations are getting the most out of the DevOps teams they already have.

  • 4 Best Practices for Entertainment App Testing

    4 Best Practices for Entertainment App Testing

    Entertainment apps represent a broad category of software, ranging from mobile games, to social media platforms, to streaming video apps and beyond.

    However, all entertainment apps share a few key traits in common:

    They typically host dynamic content that is unique for each user. This makes entertainment apps different from apps where most or all of what each user sees is the same.

    They host rich multimedia content including, in many cases, streaming audio and video.

    They are often created by vendors operating in highly competitive markets, where a poor user experience can send users flocking to competitors’ apps. There is no shortage of apps out there for gaming, video streaming and so on, and if your app fails to perform, your users can easily convert to a competing solution.

    For these reasons, teams responsible for testing entertainment apps must develop a testing strategy tailored to the unique challenges of these applications. Traditional testing tools and methodologies aren’t enough for running tests that support an excellent end-user experience for entertainment software.

    With that reality in mind, let’s take a look at four best practices to follow when testing entertainment apps. These strategies go a long way toward ensuring that entertainment apps deliver the end-user experience that is necessary for maximizing user engagement and retaining users, no matter how complex or dynamic the apps happen to be.

    Testing for Video and Audio Syncing

    An easy – and all too common – way to shred the user experience in an entertainment app is to stream videos where the visual and audio streams go out of sync with each other. Videos need to be perfectly in sync with audio to keep users happy.

    Of course, the challenge that testers face is that most testing frameworks don’t offer an easy means of evaluating whether visual and audio content are in sync with each other, especially when the content is streamed. Frameworks that let you evaluate when content initially loads or when it updates aren’t enough for analyzing sync between visual and audio streams. As a result, teams have traditionally resorted to testing for sync manually, or not testing it at all.

    Fortunately, there’s a better way. Using AI, you can run tests that automatically identify lag between video and audio. In turn, you can detect problems that may cause streams to go out of sync, then fix them before your users experience sync issues.

    Minimize Test Latency

    When you have an entertainment app where content changes in real-time, your tests need to be able to execute and display results in real-time, too. But that’s difficult to do if network latency issues prevent data from moving between your test cloud and your testing tools quickly enough to provide real-time results.

    There are two ways to solve this challenge. First, you could run tests on on-premises devices in order to avoid network latency problems. Alternatively, if you want to take advantage of a test cloud while still achieving real-time results, you can optimize network traffic in a way that minimizes latency and allows test data to flow between your test cloud and your testing tools in a few dozen milliseconds–as opposed to the hundreds of milliseconds traditionally required for packets to flow from tools to the device cloud, and then back again.

    Test Across Geographies

    The way a user based in, say, Barcelona experiences an entertainment app might be quite different from the way one located in New York or Tokyo experiences the same app. The reason why is that the network hops over which data needs to travel, as well as the efficiency of the carrier network that delivers the data, which can have a major impact on how quickly content loads and is streamed. For media-rich entertainment apps, latency and bandwidth limitations can be particularly problematic.

    For this reason, you should be testing your entertainment apps from the perspective of users spread across the world. Doing so allows you to represent multiple geographies and carrier networks in your tests, ensuring that your app performs properly not just from the location where your testing team is located, but from all of the locations where your actual users reside.

    Test for Multiple Screen Resolutions

    Variations in screen resolution can have a significant impact on how content is rendered. Attempting to display content at a screen resolution that software developers didn’t plan for can result in pixelated images, distorted images or images that aren’t fully visible.

    That’s why you should be testing how content on your entertainment app is rendered under different screen resolutions. Testing for just one or a handful of resolutions isn’t enough.

    You can perform these tests manually, by reviewing content rendering by hand. A better approach, however, is to take advantage of AI tools that can automatically compare renderings of the same content under different screen resolutions to detect inconsistencies. That’s a much faster, more efficient, and more scalable way to ensure your content appears as users expect it to.

    Conclusion

    Entertainment apps are a unique category of software, and they require a unique testing strategy. Testing teams need to test for factors that aren’t important for most other types of apps, such as evaluating whether video and audio streams are in sync. They also need to minimize latency during testing and test across multiple geographic locations and screen resolutions. Practices like these are the only means of ensuring that entertainment apps deliver the user experience necessary to succeed in highly competitive niches.

  • Switching From FluentD to Vector Log Aggregation Tool

    Switching From FluentD to Vector Log Aggregation Tool

    Log files are extremely important to the data analysis process as they contain essential information about usage patterns, activities and operations within an operating system, application, server or device. This data is relevant to a number of use cases across an organization from resource management, application troubleshooting, regulation compliance and SIEM and business analytics and marketing insights. To manage logs created by these use cases and make use of this wealth of data, log aggregation tools enable organizations to systematically collect and standardize log files. However, choosing the right tool can be quite challenging.

    This blog will detail and compare the popular open source fluentD and Vector tools for log aggregation.

    fluentD Configuration and Efficiency Calculation

    When using orchestration tools like Kubernetes to deploy containers or other API resources, there is a need for a log aggregator to store the pod or node logs in a cloud platform. For a particular requirement, fluentD was used as a log aggregator tool to push K8s pod logs to cloud storage buckets with a sample configuration as shown below:

    <match kubernetes.**>

    @type <cloud platform name>

    project <project name in cloud platform>

    keyfile <credential json to access the cloud storage> bucket <cloud storage bucket name> object_key_format <name for the file to be used>

    path <file prefix/path where the file have to be stored>

    <buffer tag,time>

    @type file

    path /var/log/fluent/gcs timekey 1m timekey_wait 30 timekey_use_utc true flush_thread_count 16 flush_at_shutdown true flush_mode interval flush_interval 1 chunk_limit_size 10MB retry_max_interval 30 retry_wait 60

    </buffer> <format>

    @type json </format>

    </match>

    Using this system, fluentD was pushing only 47.62% of total logs to cloud storage. Since there was a loss of more than 50%, changes were made to the configuration. In most of the changes, the efficiency was somewhere between 40% and 50%, with a maximum efficiency achieved at an average 67% for an entire day. Below are some of the changes made along with the percentage of logs that were pushed to cloud storage:

    <buffer tag,time> @type file

    path /var/log/fluent/gcs timekey 1m timekey_wait 30 timekey_use_utc true flush_thread_count 16 flush_at_shutdown true retry_max_interval 60 retry_wait 30

    </buffer> Efficiency:- 46.32%

    <buffer tag,time> @type file

    path /var/log/fluent/gcs timekey 1m timekey_wait 30 timekey_use_utc true flush_thread_count 16 flush_at_shutdown true

    </buffer> Efficiency:- 49.89%

    <buffer tag,time>

    @type file

    path /var/log/fluent/gcs timekey 10m timekey_wait 0 timekey_use_utc true flush_at_shutdown true

    </buffer> Efficiency:- 37%

    <buffer tag,time> @type file

    path /var/log/fluent/gcs timekey 30 timekey_wait 0 timekey_use_utc true flush_thread_count 15 flush_at_shutdown true

    </buffer> Efficiency:- 60.88%

    <buffer tag,time> @type file

    path /var/log/fluent/gcs timekey 1 timekey_wait 0 timekey_use_utc true flush_thread_count 16 flush_at_shutdown true flush_mode immediate

    </buffer> Efficiency:- 66.77%

    Vector Deployment, Configuration and Resultant Efficiency

    To improve this further, the open source Vector tool by Datadog was also considered. This tool was suitable for K8s setup with a similar configuration as fluentD and was installed in the nodes.

    A Helm command was used to clone the official repository in its VMs; the configuration was changed as described below and installed it as an agent. Vector comes in two working modes: Agent and aggregator. While agent is the plain mode that pushes logs/events from source to destination, aggregator is used to transform and ship data collected by other agents (in this case, Vector).

    The installation of this tool requires a Helm repository in the local machine to fetch the source code. Hence the below commands were run in a sequential pattern before installing Vector in a K8s cluster:

    helm repo add vector https://helm.vector.dev (Adding vector repo to helm list)

    helm repo update (Updating the helm repos)

    helm fetch –untar vector/vector . (command to clone the repository to local machine)

    Configuration:-

    data_dir: /vector-data-dir

    sources:

    <Custom source id>:

    type: kubernetes_logs (because we are using kubernetes as our source)

    exclude_paths_glob_patterns: <Array of directories which has be excluded when collecting the logs from the nodes> (Optional)

    sinks:

    <Custom sink id>:

    type: <Destination cloud storage>

    inputs: <Array of source id’s from where log has to be pushed>

    bucket: <Bucket name of cloud storage>

    key_prefix: <Path inside the bucket where the logs has to collected> (Optional) encoding:

    codec: <Encoding of the log file> (Optional) Command to install the Vector:-

    helm install vector . –namespace vector

    After deploying Vector in the development environment and testing it, the efficiency was ~100% with negligible loss. The switch was then made to Vector and deployed in the production environment. Vector can ship up 100,000 events or logs/sec, which is a very high throughput rate compared to other tools for log aggregation performance. Vector was able to achieve 99.98-100% efficiency even in the Kubernetes production cluster.

    To learn more about how DataOps can enable highly performant data pipelines with real-time logging and monitoring, watch this video. 

  • CircleCI Will Use AI to Increase Collective DevOps Intelligence

    CircleCI Will Use AI to Increase Collective DevOps Intelligence

    CircleCI has committed to adding additional collective intelligence capabilities to its continuous integration/continuous delivery (CI/CD) platform that will leverage machine learning and other forms of artificial intelligence (AI) to optimize application development and delivery.

    CircleCI CEO Jim Rose said that as the company’s namesake CI/CD platform continues to collect more telemetry data from multiple customers, it becomes feasible to create AI models that will optimize everything from application testing to reliability and performance.

    As part of that strategy, CircleCI has also added capabilities such as test splitting recommendations that employ machine learning algorithms to estimate the expected time savings of enabling parallelism on test jobs.

    In addition, CircleCI is creating a team of analysts and data scientists to develop additional AI capabilities based on the data collected via the cloud version of the company’s platform.

    The decision to invest more in developing AI capabilities follows the acquisition of Ponicode, a provider of a unit testing platform, earlier this year. That platform uses AI to augment application testers by providing capabilities such as syntax validation, on-hover hints and autocompletion capabilities to improve the accuracy of software developed using Visual Studio Code. The goal is to integrate that AI testing technology within the CircleCI platform to make it possible to apply algorithms to individual developers’ code as well as to code aggregated from multiple developers within a build as it is continuously updated across a DevOps workflow.

    The workflows make up a software supply chain that, in many regards, functions like any other type of supply chain, noted Rose. As such, there is plenty of opportunity to apply AI models to optimize those workflows in the same way AI is being applied to optimize other types of supply chains, he added.

    It’s still early days as far as applying AI to DevOps processes is concerned, but it’s clear there is a need to further automate a wide range of manual processes. It’s not likely that AI is going to replace the need for DevOps engineers any time soon, but it will reduce a lot of the toil that currently hinders productivity. The challenge, of course, is that it takes a lot of telemetry data to train an AI model, which typically can only be efficiently gathered and stored with a cloud platform. Less clear is whether AI capabilities might drive more organizations to shift away from legacy CI/CD platforms deployed in an on-premises IT environment where there might not be enough telemetry data available to effectively train an AI model.

    The one thing that is certain is there is now a race to apply AI to DevOps workflows. Organizations that have adopted DevOps typically are highly committed to automation, but the amount of AI applied to those workflows has been limited thus far. In the coming year, however, chances are good the amount of AI being applied to DevOps workflows will steadily increase, especially as many DevOps teams struggle to keep pace with complex application environments.