At QCon London, David Farley (@davefarley77) told the audience that “continuous delivery changes the economics of software delivery”. I could not agree more.
If you have been drawn to the evangelists like David Farley, Jez Humble, and Gene Kim, you’ll know that high performance IT organizations are seeing a massive payoff in their continuous delivery investments. Industry leaders big and small are sharing noticeable results:
8x more frequent production deployments
50% lower change failure rates
12x faster service restoration times when something went wrong
5 Principles
How are they achieving these results? They are following a few key principles that David and Jez outlined in their seminal book, Continuous Delivery (highly recommended). The principles outlined in their book and in David’s QCon presentation are as follows:
Deliver fast
Automate almost everything
Keep everything in version control
Build quality In
Empower the team
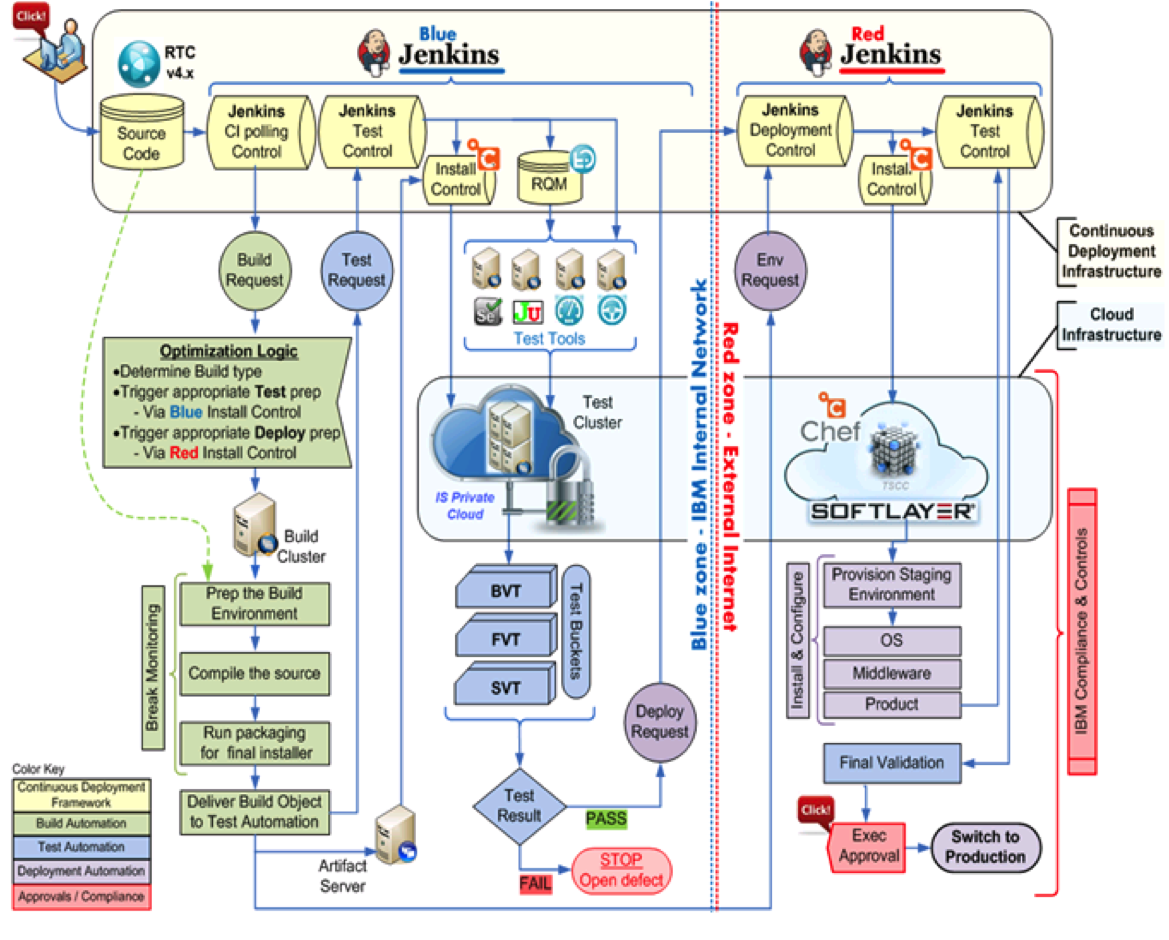
Reference Architectures for DevOps and Continuous Delivery
In their book, they also provide insight to continuous delivery tool chains and processes which highlight build tools, CI platforms, testing suites, artifact repositories, and many other components. There are numerous examples of reference architectures available, and each of them vary in levels of detail, tools highlighted, and processes followed. Yet, there is a constant theme among the tool sets: Jenkins, Maven, Nexus, Subversion, Git, Docker, Puppet/Chef, Rundeck, and Sonar seem to show up time and again.
To help you along your continuous delivery and DevOps journey, I have compiled a set of 31 reference architectures created by users across the continuous delivery and DevOps communities.
Each architecture is accompanied by a link to the original presentation or blog where the architecture was referenced to ensure you have access to the full context of the discussion. You can also freely download the presentation from SlideShare where we now have over 7,000 views.
Offer to help others: If you have a reference architecture to share, please consider posting a link to it in the comments section below. I am sure others would love to see it and learn from it.
This is 3rd part of the multi-part series covering Automation, provisioning and Configuration Management. In this follow up article best practices for Puppet shall be covered.
Why Puppet?
While every system administrator comes up with more progressive systems to be managed, the automation of every mundane task is increasingly significant.
Instead of achieving in-house developed scripts, it is necessary to share a system that can be used by everyone, irrespective of one’s employer. But undoubtedly, this is not possible manually.
So, Puppet has been developed to benefit the sysadmin community in building up and sharing of all mature tools, which prevent the replication of a problem which is being resolved by many.
Following are the key methods followed by Puppet:
1). It supports a powerful framework, and is responsible for simplifying most of the technical tasks required to be done by the sysadmin.
2). The sysadmin’s work is written in form of code, easily sharable as the other pieces of code, in the puppet’s custom language.
The Puppet usage accelerates your work as a sysadmin, as it supervises and handles all the details. You can download the code from other sysadmins to help you get your work done even faster. Most of the Puppet implementations make use of one or more modules already developed by others. One can find hundreds of modules developed and shared by the community.
What is Puppet?
Puppet is an open-source IT automation tool developed by Puppet Labs. Its written in Ruby; composed of a declarative language for expressing system configuration; a client and a server for distributing it; and a library for realizing the configuration. Puppet helps in automation, deployment and scaling of applications in the cloud or on site.
The basic design objective of Puppet is to come up with a powerful and expressive language backed by an influential library that makes you write your own server automation applications in just a few lines of code. Its intense adaptability and open source license lets you add up the required functionality. And, you can also share your innovations with others.
System Components:
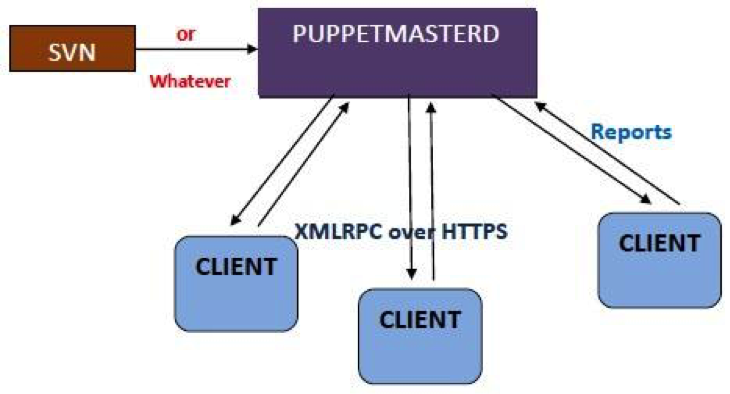
Puppet in general is used in a client/server formation, with all your clients talking to one or more central servers. Every single client contacts the server at regular intervals i.e. every half hour, by default. It even downloads the latest configuration and makes it sure that it is in sync with the configuration. The moment it’s complete, the client is able to send a report back to the server and can also refer to the changes required.
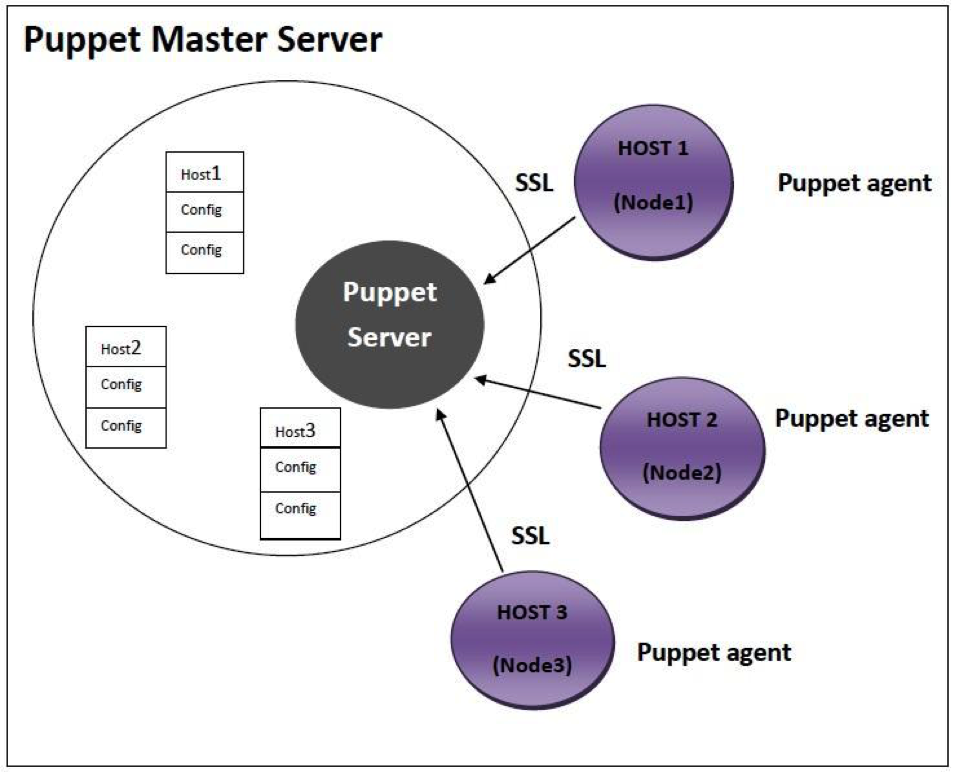
Following diagram displays the data flow in a usual puppet operation:
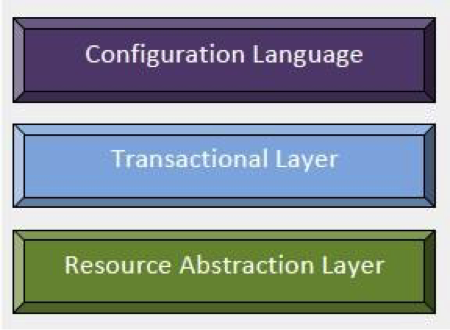
Puppet’s functionality is framed as a heap of individual layers. Each layer is duty-bound to a fixed aspect of the system with a tight control on how information transfers between these layers.
Fig2
How Does Puppet Work?
The Puppet agent acts as a daemon that runs on all the client servers where configurations are required, and the servers to be managed by Puppet in the future. Now all the clients to be controlled will have puppet agent installed in their systems. This puppet agent also known as a node in Puppet will have a server designated as the Puppet master.
Puppet Master: This machine restrains the entire configuration for different hosts, and runs as a daemon on this master server.
Puppet Agent: This is the daemon that will run on the entire server that is to be managed with the help of Puppet. At a specific time interval, the Puppet agent will go and inquire the configuration from the puppet master server.
Now the connection network between the puppet agent and master is built in a secure encrypted channel with the support of SSL. For example, if the Puppet agent has already applied for a necessary configuration and there are no new changes, it will do nothing. By default, the puppet agent will go and fetch the required config data from the puppet master in every 30 minutes.
From the above diagram it is clear that puppet master server has all the configuration options available for Host 1 or Node1, Host 2 or Node 2 and Host 3 or Node 3.
Following are the steps that are always followed whenever a puppet agent of any node makes up a connection between a node and a puppet master server to fetch the data.
Step 1: Every time a client node makes a connection to the master, the master server examines the configuration to be applied to the node.
Step 2: The Puppet master server takes and assembles all resources and configurations be applied on the node, and brings it together to make a catalog. Now, this puppet is given to the puppet agent of the node.
Step 3: According to the catalog, the Puppet agent will apply configuration on the node and then reply. It will also submit the report of the configuration applied to the puppet master server.
Who would find Puppet useful?
An organization that would like to decrease the cost of maintaining its computers could benefits from using Puppet. Since the return on investment is related to several factors such as the current administrative overhead, diversity among existing computers, and cost of downtime. It might be complex for an organization to determine if it should invest in any configuration management tools, much less Puppet.
In general, any organization should make use of server automation if any of the following are true:
It comes up with a higher server administration costs
Either because of contracts or opportunity cost, it pays a high price for downtime.
It contains loads of servers that are fundamentally identical or nearly identical.
Flexibility as well as agility is required in server configuration.
Conclusion:
Puppet refers to the two different things
The language in which code is written
The platform that manages infrastructure.
Puppet is both a simple and a complex system. It is composed of several moving sections wired all together quite loosely. It is a structure that can be used for all configuration problems. Our future success rests on the structure becoming more powerful and simple, for it should be approachable while gaining capability.
Despite the fact that information security is a top priority, many organizations face challenges integrating security assurance practices into their product and service development practices. All too often security problems are only detected and resolved with software patches following a security breach. Security assurance is often reactive but what is needed is a more consistent proactive and affordable approach to security. As indicated by Sean Michael Kerner in his article The DevOps model isn’t a threat to security; it’s a tool that can be used to enforce security like never before.
DevOps with Continuous Testing (CT), when implemented according to best practices, is an opportunity for organizations to systematically and affordably integrate security assurance into product and service development. Using DevOps techniques, continuous security testing can be built into software change and deployment operations. Many refer to the application of DevOps practices to security assurance as “SecDevOps”.
Below are some continuous testing best practices that make continuously testing security affordable:
1) Develop expertise in SecDevOps CT: Security assurance demands that an organization develops expertise and processes to identify threats, protect against them, detect threats when they occur, respond with solutions and recover quickly. SecDevOps CT is not so different from any other DevOps CT except that it includes a security focus. Security assurance is really a special case of quality assurance and the practices for continuous testing also apply to security assurance. Other than the general continuous testing practices which I have described in my blogs on continuous testing, here are some specific skills needed for effective SecDevOps continuous testing:
a. Include security experts in the DevOps CT team who are familiar with security domain knowledge including next generation network security protocols, understanding of BYOD security, cybersecurity attacks, in-application aware networks, streaming media and content delivery, virtualization and cloud security.
b. Security experts should partner with and train the rest of the organization. This should be done from the beginning of the development process. This is important to ensure security is no longer an afterthought for an isolated department to worry about, but integrated at all stages of a project. This will ensure that developers and testers have a security mindset as part of their daily work.
2) Leverage DevOps and continuous testing to make security assurance affordable: Because security assurance like quality assurance is considered a cost rather than a revenue generation activity, organizations are challenged to afford proactive security assurance. DevOps, when implemented in accordance to best practices, has a number of characteristics that make security assurance affordable as follows:
a. DevOps infrastructures are configured as a common resource shared by the entire development, test and deployment teams and consolidate separate department test labs which allow budgets to be pooled.
b. Orchestration tools include automated test topology re-configurations of products, test tools and interconnection components within physical, virtual and hybrid test lab deployments. This enables a wide range of security relevant production configurations to be stood up without expensive dedicated test equipment for each topology.
3) Use Security-CT-Ready test tools which support security test protocols and flexible automation workflows: As indicated in my prior blogs not all test tools are CT ready and this is true for security tools also. Using the right security test tools that are CT-ready will make the job of integrating security into CT much easier. Here are key ingredients to look for in Security-CT-ready test tools:
a. Use test tools with built-in security tests….no need to recreate them! These tools need to be compatible with security standards. The following whitepaper provides a framework of the impact – NIST Cyber Security Framework.
b. Use test orchestrations tools that integrate well in the DevOps environments and can stand-up any production configurations consisting of a variety of platforms, mix of vendor components from the device level all the way to large scale network topologies. A good example is Spirent’s Velocity solution.
c. Use static code analysis tools during continuous builds with built-in checkers that verify software security coding standards including CWE/SANS, OWASP and PCI DSS. For example Parasoft static analysis tools.
4) Engage outside expertise to help accelerate your progress towards continuous security testing best practices: Many organizations make the mistake of trying to do everything themselves instead of employing expert consultants. Bringing in outside expertise can greatly improve the speed of accomplishing best practices. A good example of security expertise is Spirent’s Network Security Testing brochure.
The above is a partial list of suggestions for continuously testing security that have been proven to yield good results for SecDevOps. At Spirent we think testing has a bright future in DevOps. You can read more about our views at Spirent.com/solutions/devops
What do you think of these suggestions and do you have others that should be mentioned?
The tally of smartphone usage worldwide is mind-numbing: Even as far back as 2012, more people on earth had access to a mobile phone than had access to a toothbrush. Even more mind-numbing must be the stats on the untold millions of those mobile device users in various states of rage at any moment while waiting for their content to finish downloading. Mary Meeker’s 2014 “State of the Web” report states 30% of all mobile phones are smartphones. The usage of the smartphones is growing in a compounded manner.
I’m confident that my own frustration resonates with those millions of users. And it’s only getting worse. I think about the plight of the next N billion mobile users who will depend on constantly overburdened mobile networks in all parts of the world.
I was fortunate in being able to turn that frustration into a mission, when I founded PacketZoom. I had developed the blueprint of an idea for a remedy while working at Google, and then spent two years to productize and trial the technology in the heavy R&D phase of PacketZoom starting in 2013. But we weren’t content to tweak the existing protocols to save a few milliseconds here and there – and neither were countless app developers around the world, who faced the same conundrum. Why not? Stats have proven that mobile downloads taking more than six seconds cause about half the users to defect from the app they are using – unaware that the network, and not the app, is to blame. And it’s well past time for incremental approaches to fixing the problem. [citation: https://blog.kissmetrics.com/loading-time/]
The turning point for me was my first-hand experience on a trip to India while trying to load the first screen of an application while on a moving subway. Only an exercise in extreme restraint prevented me from bludgeoning my phone – which, of course, was not the culprit. Clearly, the problem was unsolvable using the prevailing technology that had been jury-rigged over 40 years to serve every new use-case that came along. Maybe that time-honored, but worn-out technology had to be replaced!
The last few years we have seen an explosion of apps on mobile phones. The next few years promise to bring an order of magnitude larger number of devices in response to the “Internet of Things” phenomenon. If we continue using the same old protocols, the interminable waits for mobile content will become intolerable.
Time to Lose Four Decades of Losses
So what exactly is the problem with the legacy protocols? After all, they’ve been made to work for today’s use cases. Well, allow me to explain.
Let’s start with IP (Internet Protocol). IP addresses were intended to be solidly and reliably attached to a computer forever, in the same way a street address is solidly and reliably attached to each house. (And note that a smart phone is just another computer.) A packet sent to that address could go to only one place (the one house – or, in our analogy, the one computer). But now, in the year 2015, the IP address is but an ephemeral property of a mobile device. It’s as if everyone lives in a van now and your address depends on where you parked your van at the end of any day.
Today, the IP address of your mobile device might change while you walk from your office to the parking lot. As you move from your office WiFi to the LTE connection outside your office, and as you move through myriad disconnections and reconnections while travelling in personal or public transportation, you can be “taking” and “releasing” dozens of IP addresses during the course of your commute.
The upshot is, that when an app on your mobile device starts communicating with the cloud, every change of IP address causes the app to initiate the communication from the beginning – a so-called “cold start”), rather than from the point where the previous communication paused at the point of disconnection. That’s one very big problem, resulting in time lost through duplication of transmissions.
What’s more, each new reconnection to the network requires establishing a new TCP session, a session that utilizes the 40-year-old technology, TCP (or Transport Communications Protocol). But guess what? Each new TCP session starts cold and, according to the TCP algorithm, has to gently ramp up to full speed every single time. And the lost time due to those delays adds to the lost time created by continuous disconnections and reconnections that occur in all mobile environments.
TCP has been honed over the years to work “tolerably well” for general use over all possible kinds of networks. It was originally designed to connect huge computers, administered by professional sysadmins, and housed in meticulously maintained facilities with triple redundant power. It does the job that its least-common-denominator design is expected to do – that is, to get a stream of data from one computer to another (i.e., from one IP address to another) reliably.
Those are the guarantees of the TCP protocol. What it doesn’t guarantee however, and doesn’t even address, is speed. It uses the most conservative method possible to get your data packets from one place to another. As a result, user-level protocols (e.g., HTTP) get cluttered with hacks atop other hacks to try to work around TCP’s lack of concern for speed.
Consign TCP and HTTP to Their Rightful Place
Now imagine this conversation from sometime in the early 2000’s among boffin from companies making web browsers:
Boffin A: “TCP doesn’t allow us to use the full available bandwidth of the available channel (DSL, dial-up, or those new-fangled cable modems.”
Boffin B: “No problem! How about we open six TCP connections at the same time. Let them fight it out among each other.”
Boffin A: “Done.”
Boffin B: “We’re geniuses!”
Well, in fact, web browsers have been built around this approach ever since that ill-fated day. But the web runs on Hypertext Transport Protocol, aka HTTP, version 1.1 for the last decade and a half! HTTP, as an application-level protocol, knows nothing about speed either. And so browser vendors, over the years, have come up with a mish-mash of folklore-based tips, tricks and hacks to somehow keep this train running.
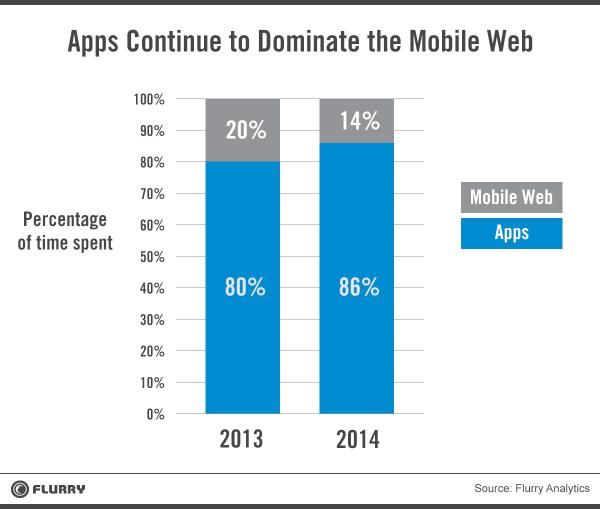
Fast-forward a bit, and a lot of these tips and hacks have been refined and codified into the latest revision of HTTP, version 2. The old protocol, the hacks to keep it alive, and now the new version of the protocol, are focused on making the web faster. The problem? Accessing the web accounts for only 14% of the uses of smartphones.
And therein lies the disconnect. For almost two decades the web was the dominant application platform. Gigantic hardware and software platforms (and companies) have been built to service the web. (Note how the biggest cloud platform in the world is called “Amazon Web Services”). TCP/HTTP sufficed for web access, but the constraints of what can be done in a web browser have held us back from evolving to the protocols designed for the predominant application of the Internet today: native mobile apps.
Quite simply, for any application running in a web browser, there’s nothing that you, the app developer, can do to fix the underlying network transport. But a new dawn is upon us. The dominant platform for applications is not the web anymore. It’s the native apps on mobile devices. And just like that, we’re free of the shackles of HTTP and even TCP. We, as app developers and our supporters, are free to invent protocols that make sense for this spottily connected, packet-lossy, high-latency mobile world. Evolution, by nature, works at a glacial pace. It’s now time for invention — and maybe even a few quantum leaps. Packetzoom has taken the first step towards fixing these problems by designing a more modern protocol purely for mobile use case. Learn more about it at https://packetzoom.com/learn.html. Here is a short video showing the PacketZoom difference:
About the Author/Chetan Ahuja
Chetan Ahuja is the Founder/CEO/CTO of mobile networking startup Packetzoom Inc. Prior to starting Packetzoom in 2013, Chetan worked on software and networking performance in companies such as Google, Admob and Riverbed where he gained a deep appreciation of the key role of network speed on application performance and thus on user happiness. He holds a Masters degree in computer science from Michigan State University and a Masters degree in computational chemistry from Indian Institute of Technology, Mumbai. He likes to spend the entirety of his free time watching old episodes of Monty Python and Start Trek (TNG) with his family or playing ping-pong with co-workers.
The effort to speed up continuous testing will be wasted if the underlying system that continuous testing depends on is not stable. In my prior blog
Continuous Test Results Analysis – at the Speed of DevOps, I discussed the importance and practices for speeding up continuous testing results analysis. However, unless the continuous test system that the test results are derived from is rock solid, the results will at best be unreliable and at worst – results may not be generated at all!
One of the first rules of DevOps is to “keep going and don’t stop”. Stopping is the equivalent of pushing the red button on a factory assembly line effectively causing the entire line to shut down. Then, panic ensues because every second that the line is down affects all of production leading to increasing costs not to mention restarting the line is substantial also.
Many techniques are employed to minimize the need to stop testing despite reported product test failures. However if the underlying continuous testing system itself is not stable, then the entire DevOps system including continuous testing will immediately be interrupted until the system recovers. Development team members are looking for results, so the time savings for speeding up the availability and the total work associated with results analysis is huge for every minute of results analysis time saved on each CI/CT cycle. When aggregated over multiple code branches, a few minutes saved per test result can be man-years of time saved over a year!
So what can be done to ensure the continuous test system itself is stable and produces reliable results even in the face of inevitable occasional system failures? After all, there is no such thing as a truly perpetual machine that never ever breaks down. Below are some suggestions in a checklist format that have proven useful in high performance DevOps deployments.
Build a fast-response multi-discipline team: There are a wide variety of ways any system of interconnected computers and applications can fail whether they are virtualized, internal, or running on a cloud used remotely from a data center in the cloud. The following list of suggestions for the team will assure fast recovery when the system does experience failure.
• Assign a continuous testing system architect with responsibility to design system stability SLAs, design high-reliability system architectures and define sufficient team workflows suitable for disaster prevention and recovery consistent with recovery time SLAs.
• While the team members may be in-or-out sourced, full or part-time, there needs to be clearly responsible first responders and 2nd line escalation team members with definitive workflows that take care of failure events 24/7 for every hardware, software, tools, network and firewall component that the system depends on.
• Assign product team leads to plan changes needed for new products and services.
• 24/7 availability system designs are pricey to build, expand, and maintain, so finance and accounting team members need to be part of the team to keep clear, current cost data relevant to the continuous testing system.
• A senior budget manager approves expenses needed for stability without delay.
Anticipate failures – prepare, prepare, prepare!: Don’t wait for a failure before testing system recovery procedures! Documented disaster prevention and recovery plans or high-availability tools won’t save the continuous test environment if the team is not ready to react during a failure event.
• Run failure simulations for each defined failure scenario at a frequency that matches the expected probability of each failure.
• Cross-train team members on system recovery best practices so the skills will be ready when most needed – ensure no one person has essential unique recovery skills.
Choose test tools designed with high stability system administration capabilities: Look for the following features designed into in test tools to ensure the continuous test environment can be configured and managed for high reliability.
• Tools are implemented as autonomous services, controlled through RESTful APIs, that can be separately invoked and managed
• Test system service monitoring is built-in including up-time, wait-time and usage metrics for each use case of each test system service.
• Diagnostic capabilities are built-in to each service. When a failure occurs the failure log includes helpful descriptions including causal information.
Engineer the system for stability: Typical continuous testing systems have many “moving parts” and many of them have to work in concert for the system to perform properly. It is common engineering knowledge that the reliability of a system is determined by the reliability and configuration of its parts. Here are some suggestions to improve the overall system reliability.
• Choose powerful servers and virtual machines (VMs) with ample processor speed, fast I/O, large and fast memory and data storage. This is important to minimize the chance of system failures due to possible overloading of these resources.
• Deploy multiple servers and VMs for each system component with enough redundancy so that no one component failure will interrupt the entire continuous testing system.
Configure the test workflow to avoid false negatives: There is no point in reporting product test failures to users if the reason for the failure was an underlying continuous testing system failure instead of a failure of the product itself. Such “false negatives” are a big waste of time. Here are some suggestions to reduce the chance of false-negative test reports.
• Assign an application to continuously verify, in-real time, that all the system components and interconnections are operating and report these results to the continuous testing report aggregation tool. These results are called CT system environment test results.
• Use the CT system environment test results within the continuous test results analysis tool to determine if any test failure coincides with an environment failure. Mark each verdict “inconclusive” instead of “fail” if it does and include a description of the environment failure in the verdict log.
Maintain the system to assure long-term stability: Every system needs maintenance at some point. Hardware components wear out and software components become obsolete. Each time a system component is replaced or upgraded to new versions there is a risk of instability. Here are some recommendations to reduce the risk of introducing instabilities to the continuous testing system when changes are implemented.
• Create a maintenance environment that mirrors the test and production environments.
• Define a test suite that will exercise all system components and topologies.
• Test changes in the maintenance environment before deployment.
• Occasionally run failure/recovery simulations in each production environment.
The above is a partial list of suggestions for continuous test system stability that have been proven to yield good results for DevOps. At Spirent we think testing has a bright future in DevOps. You can read more about our views at Spirent.com/solutions/devops
What do you think of these suggestions and do you have others that should be mentioned?
Fast continuous testing is counterproductive if the analysis of test results does not keep up with the speed of testing. In my prior blog Continuous Testing – Accelerated! I discussed the importance and practices for speeding up continuous testing. Unless test analysis is as fast as the tests, all that will happen is an accumulated debt of test results to be analyzed resulting in, at best, no net gain in time savings and, at worse, valuable results going overlooked and mass confusion that actually slows down the overall CI/CT cycles. Typically many development team members are looking for results, so the time savings for speeding up the availability and the total work associated with results analysis is huge for every minute of results analysis time saved on each CI/CT cycle. When aggregated over multiple code branches a few minutes saved per test result can be man-years of time saved over a year!
So what can be done to ensure continuous test results analysis keeps pace with accelerated continuous testing? Below are some suggestions in a checklist format that have proven useful in high performance DevOps deployments.
Determine clear responsibilities and SLAs for test results analysis:When the organization sets specific responsibilities and goals for results analysis the entire DevOps process will be accelerated.
• Assign first responders and 2nd line escalation team members with definitive workflows.
• Define a strategy for responding to test failures such as pre-determined actions if test failure rates exceed certain thresholds for each category of test. Examples of actions could include “continue with CI”, “revert changes”, or “stop and fix faults” depending on failure priorities.
• Train the team on best practices test design and peer-review the scripts to ensure they define clear verdicts.
Design test scripts for efficient test results analysis: When the test scripts are designed for efficient results analysis the process is accelerated. Here are some examples of good practices:
• Each script must have a clear “Pass”, “Fail” or “Inconclusive” verdict, and a description of the verdict.
• Each verdict should be reported together with pre-defined tags that can be used to categorize the verdicts.
• Assign a priority code to each verdict. The highest priority verdicts should be analyzed first.
• If a script has multiple verdicts, the highest priority verdicts should be reported first if possible.
Choose test tools that are designed for fast test results analysis: Look for the following features when you are evaluating test tools. Not only will this save you a lot of headaches in the long term, it will give you the flexibility to design tests that integrate with other DevOps tools.
• Restful APIs that do not require wait states between commands and responses.
• Support a framework that enforces test results standards that ensure each test, when completed, reports a clear verdict including “Pass”, Fail”, or “Inconclusive” , a description of the verdict, event logs from both the test system and system-under-test POV, and tags that identify the build campaign, and functional attributes which can be used for cause analysis.
• All timers can be sync’d to a common clock across the entire test environment and the verdicts record time at a precision that is appropriate for the fastest events relevant to the system under test.
• Caching features that enable results data to be processed for one test while the tool proceeds to execute other tests.
• Results data mapping and processing utilities integrated within the tool without requiring slow speed scripting to parse results.
Choose and configure test analysis tools to process results as they are available:In a best practices large scale DevOps environment test cases are running in parallel across many machines simultaneously and there may be multiple code branches and versions being tested at the same time. According to best practices powerful test result analysis tools collect and aggregate test results data from all of the test machines, filter the results in real time for processing according to functional tags, analyze the aggregated data to determine probable causes and report the analyzed results together with probable cause information in priority order to the most relevant first responders, in real time “results-so-far” cumulative format.
• Choose powerful servers for results aggregation and results processing, with ample processor speed, I/O, large and fast memory and data storage. Consider separate servers for aggregation and analysis to all result collection and processing threads to be run in parallel without interfering with each other.
• Configure the system with fast high priority channels to collect all results data to a common results repository.
• The results repository should be big enough to save all the results of many past test campaigns, such as a month of results data, because best practices test analysis tools will mine the past data to determine failure trends.
• Results are collected across all test agents, processed and reported in real time as the verdicts are reported.
• Results are reported in categories by build, tag and priority, and probable cause, giving highest priority in the reports to code areas or features that exceed pre-set failure thresholds
• Probable causes are automatically determined from statistical trend analysis which weight the most recent build results heaviest and also use static code defect density information to point to code modules that most likely caused the failures.
Configure the workflow for optimal test results analysis: When optimized, test analysis can prevent DevOps cycle interruptions significantly. The optimal workflow will use just-in-time concepts such as the following:
• Only send results to the appropriate first responders when failure thresholds are exceeded.
• Automatically escalate failures to the appropriate 2nd line escalation team members when the SLA time for first responders expires.
• Analyze the highest priority verdicts first.
• Prune or refactors tests that have a low failure history.
• Define threshold levels that will cause an automatic revert of a change but make sure the team gets all the results for analysis and probable causes so they can fix the problem off-line before re-applying the corrected change.
The above is a partial list of suggestions for continuous results analysis that have been proven to yield good results to complement accelerated continuous testing and DevOps.
At Spirent we think testing has a bright future in DevOps. You can read more about our views at Spirent.com/solutions/devops
What do you think of these suggestions and do you have others that should be mentioned?
The modern software delivery pipeline breaks the mold of traditional process and tool acquisition, but doesn’t warrant any less consideration. Measuring the impact of log analysis for your ops and dev teams (and the organization overall) is more of an exercise in measuring process improvement—not hard ROI.
The soft ROI components of log analysis are:
Wasting Less Time: IT Operations wastes dozens of hours each week hunting down system events that relate to a problem. Log analysis not only eliminates the lost time, but also this reactive approach to addressing problems. Identifying system issues is an arduous task, especially when it’s not clear if the problem is on the application layer or the infrastructure. If the issue is a combination of the two, a delayed release is the likely outcome. With log analysis, you’ll discover issues either before or as they happen and avoid both lost time and unnecessary delays!
Responding and Resolving Issues More Quickly: Developers working with IT provided analytics respond to and resolve bugs more quickly. This helps improve the stability of production and frees up developer time to focus on adding new functionalities that will ultimately increase the value of your application.
Reducing Customer Churn: Modern customers demand stable applications with regular updates. Without this positive user experience, they’ll move on and find a different application to meet their needs. Frequent outages and poor product quality result in churn even in previously entrenched industries. For instance in financial services, a few bottom-up constructed DevOps teams are blowing traditional organizations out of the water. Some of the older institutions have stepped up their game but only by thinking ahead and using better metrics.
Accelerating Releases: You cannot do agile if you are always playing catch up with production. Often organizations delay six or more planned releases a year due to unexpected issues. When a publicized release is delayed, customers are particularly unhappy and prone to jumping ship. In agile, with the expectation of regular bi-weekly or fast sprints, delays are a major let down. If your goal is continuous integration or delivery, delayed releases are not acceptable.
Optimizing Production Infrastructure Costs: Growing infrastructure quickly is easy, but how fast is too fast? Because of its low visibility, bad infrastructure can control your organization without you even realizing. Using log analysis, you can attack server sprawl head-on, track workloads assigned to specific machines and identify underutilized or dead assets. You can also use that data to restructure your on premise or cloud infrastructure spend!
Exploratory Infrastructure: Log analysis builds confidence that server logging is happening automatically, freeing IT resources and providing them the time to consider how and where your system can be improved. From identifying infrastructure configurations that will enhance the environment to auto-scaling initiatives or simply engaging in more productive activities than justifying outages, your IT department will have the time to focus on higher-level thinking and tasks.
Improving Communication: With better reporting, comes better communication to both the team and executives. Presentations are built more quickly, analysis showing what went well and poorly is generated easily and action items for improvement are implemented in more detail and without any additional effort. Consistent presentations means standard dashboards and greater efficiency across the board for the team.
Forget the ROI
You may have noticed the absence of any ROI calculation in our benefits analysis. This is intentional, because in the end, the calculations don’t matter. The point of implementing log analysis is to replace your existing procurement model with a system that your team already knows is better. Unfortunately, those who continue to use old ROI calculations to evaluate these tools will miss these benefits.
Cloud-based log analysis sometimes seems too easy, but it is the future of the modern software delivery pipeline. The processes and tools that drive log analysis are simplified and seamless, adding value to your culture, team and processes that cannot be measured in dollars.
The financial industry, especially banks, are still using a programming language that is over 50 years old. However, this doesn’t necessarily mean they are out of date, rather these giant institutions have found in some cases that their ancient systems just work. They are stable and secure software programs. But databases are not like static source code; they are always moving and changing. With the most important client information sitting in the database, it’s no surprise that banks and other financial institutions lead all other industries in adoption of Continuous Delivery methodologies for the database.
A recent survey we conducted revealed that the banking and finance industry DBAs far outpace non-financial companies in terms of database Continuous Delivery adoption. Of the 55% of respondents not in the finance space practicing Continuous Delivery, only 49% said they practiced CD on their databases. When we asked banking and finance DBAs and managers, we found that over 70% utilize database automation for software and 64% of those also practiced CD for the database.
These institutions are required to be agile in their database methodologies due to having such a large number of applications to deal with on a daily basis. Moreover, database errors that cause downtime are incredibly costly and financial institutions cannot afford to have any. Aside from the peace of mind that your database can run itself and adapt on the fly, proper database automation and version control can save financial institutions 80%-95% of time it would normally take to manually process changes and there is clear ROI when implementing Continuous Delivery.
The economic effects of unplanned outages are prohibitive. According to a report by Gartner research, unplanned outages, on average, cost $42K per hour. When it comes to financial services companies, research shows the cost are much higher at about $110K per hour, the bigger the footprint that a company has, the more money it will lose when it fails.
These statistics are one of the main reasons that we’re starting to see mainstream adoption of Agile and DevOps practices in finance companies. DevOps favors automating as many processes as possible and automation removes the potential for human error. By automating our processes, we allow machines to handle the redundant tasks freeing up the time and resources of skilled database professionals for more valuable and cost effective responsibilities.
DevOps for Database, automation, control and enforced change management, provide confidence in the integrity and quality of the database code and virtually eliminates the potential that harmful database changes will find their way into production.
Yaniv is the Co-Founder and CTO of DBmaestro, the leading provider of DevOps for Database solutions which enable control of database development and deployment. Yaniv is also the Co-Founder and the head of development for the Extreme group, a leading IT services solutions provider group.
Open source standards hold a lot of potential for networking. Already, initiatives such as OpenStack and OpenDaylight have gained a fair amount of momentum due to the contributions of major vendors such as Intel that recently joining OpenDaylight as a platinum member. That momentum is even spurring telecoms like AT&T to start their own open source efforts like the Open Networking Lab.
Beginning with this entry, I’ll examine various open networking standards and how they are impacting telecom businesses, IT strategy, and network engineering. At a meta level, it’s fair to say that due to the influence of open source development, networking teams are becoming more concerned with APIs, DevOps automation and the need to move away from manual towards automated ways of engineering and operating networks. Of course, each standard brings something different to the table. Let’s look at OpenDaylight.
OpenDaylight: The Open SDN Control Plane Project
The Linux Foundation manages OpenDaylight, the goal of which is to accelerate the development of software-defined networking and network functions virtualization. Though only about two years old, OpenDaylight is already one of the largest open source projects in the world, with 266 developers contributing in the past year or so, and the project already blowing past 1 million lines of code in early 2014.
What does OpenDaylight specifically address? It is perhaps best understood as offering an open control plane solution to enable multiple layers of SDN technologies:
The data plane layer consists of the physical and virtual devices in the network that speak various protocols northbound to the control layer. This includes but isn’t restricted to OpenFlow.
Above that is the OpenDaylight controller platform with northbound API’s to the application/orchestration layer, plus a multitude of southbound protocols and APIs exposed to the underlying data plane layer hardware
At the top is orchestration and application layer. This layer could look like a plug-in for OpenStack Neutron, for example.
OpenDaylight is trying to function as a sort of “Switzerland” of controllers, allowing compatibility with any type of switching hardware via many different protocols and interfaces such as OpenFlow, Path Computation Element Protocol (PCEP), NetConf, etc. The OpenDaylight controller runs on its own Java Virtual Machine and supports the Open Service Gateway Initiative.
Vendors and the future of OpenDaylight
A ton of networking vendors have piled onto OpenDaylight, to such an extent that detractors are arguing that the project, despite its open source moniker, may end up actually preserving the position of networking incumbents. Cisco and IBM founded OpenDaylight and were followed as members by Brocade, Juniper, Microsoft, Intel and others. A huge portion of OpenDaylight’s code contributions are made by large networking vendors.
With OpenDaylight in particular, the contributions of Cisco have often been scrutinized due to Cisco’s unique take on SDN and what type of controller should be used. Network World’s Jim Duffy has previously referred to Cisco OpFlex as an “OpenFlow killer”, which may be an exaggeration, but it’s clear that Cisco has something other than OpenFlow in mind for the future of OpenDaylight’s core. OpFlex could be a key part of the Lithium release that will succeed OpenDaylight Helium. However, Guru Parulkar, director of the Open Networking Lab, cited OpFlex’s exposure of device specifics to applications as a needless complication and one of the reasons for creating an alternative to OpenDaylight.
Of course, it’s a difficult balance for vendors to achieve between innovating in their own product and service lines and participating in the open source community. Projects like OpenDaylight demonstrate the promise of open source software in enabling SDN orchestration, the “wild west” nature of openness and the risks of having incumbent vendors become the de facto new sheriffs in that wild west landscape due to sheer muscle. A middle path is clearly needed.
“The vendor’s role in open-source networking projects should be a symbiotic one with other members of the community,” wrote Mike Cohen for TechCrunch. “This includes contributing to open-source efforts for the good of the community while continuing to innovate and build differentiated products that better meet user needs. Vendors should also contribute some of those innovations back to the community to help promote new standards that will help the market continue to grow.”
The upshot: OpenDaylight, initiated by Cisco and IBM in 2013 and now hosted by the Linux Foundation, is not only a significant open networking standard but one of the most prominent open source software movements period. It defines an open controller with a wide set of southbound protocols APIs for different types of infrastructure and northbound integrations. The shape that vendor contributions to and relationships with OpenDaylight take will be critical both to its rapid progress in delivering features, but also to its future as an inclusive effort at improving SDN and NFV orchestration and network DevOps.
About the Author/Alex Henthorn-Iwane
Alex Henthorn-Iwane joined QualiSystems in February 2013 and is responsible for worldwide marketing and public relations. Prior to joining QualiSystems, Alex was vice president of marketing and product management at Packet Design, Inc., a provider of network management software, and has 20+ years of experience in senior management, marketing, and technical roles at networking and security startups.
Through his roles at QualiSystems, Packet Design, CoSine Communications, Corona Networks and Lucent Technologies he has acquired expertise in cloud computing, software defined networking and network function virtualization, DevOps, ITaaS, and IT automation and orchestration. He has written for Embedded Computing, Virtual Strategy Magazine, Datamation, SDN Central, Datacenter Knowledge and InformationWeek.
These days, Alex focuses a lot of his writing around the intersection of new, programmable infrastructure technologies (cloud, SDx, NFV), DevOps and the orchestration and automation enablement needed to make all of them a reality, in both the enterprise and service provider/carrier space.
Chef is an influential configuration management and automation platform that transmutes the complex infrastructure and helps you in describing your infrastructure with code, by bringing your servers and services to life. Since your infrastructure is controlled and managed with code, it can be automated, tested and reproduced with efficiency and ease.
Chef automates the applications configuration, deployment and management throughout your network regardless of its size, even if you’re operating in the cloud, on-premises or on hybrid.
Chef is constructed around easy concepts: achieving the desired state, centralized modeling of IT infrastructure and resources primitives that serve as the building blocks. Chef’s biggest asset is that it saves the time in setting up virtual servers and other tasks. Through a multi part series I will be covering best practices in Automation, Provisioning & Configuration Management with CHEF.
Why Chef?
Being a system administrator is alternately inspiring as well as tedious, on the other hand is the thought to bring the best to your organization goes hand-in-hand with the idea that you require help to keep it all running. It is exceptional that a single individual is familiar about each and every complex problem and its essential solutions. Same goes with the tools also. Chef provides you with a framework which helps in evading these worn-tools problems. It even improves infrastructure management that can help you to solve every complicated problem.
There are numerous reasons to use Chef:
1). Chef immensely decreases the amount of documentation you ought to write.
2). Chef doesn’t change the scalability of the Bash.
3). Chef comes up with terrific technical approaches.
4). Chef is a tool that grows with you.
5). Chef can help you in holding back and stop you from reinventing the wheel.
What are the fundamental principles?
The main principle of Chef is to make users know best about their environment, what should be done and how it should be maintained. Chef-client does not come up with any assumptions. Only the individuals i.e. you and your team members on the ground is capable of understanding the technical as well the human problems which includes audit trails, skill levels and other internal issues that are unique to your organization and what are the required solutions to solve these problem plus whether any single technical solution is feasible.
Main components of Chef
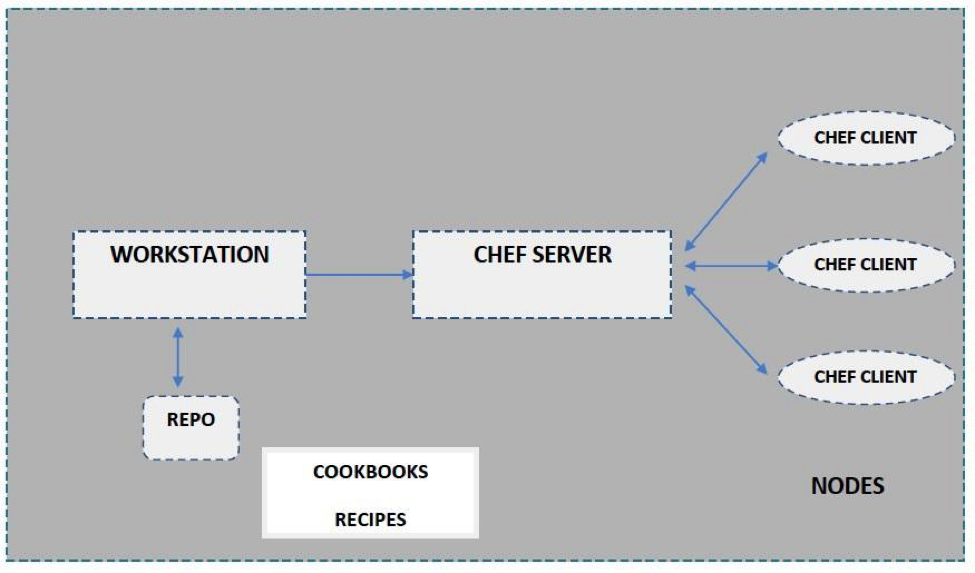
Chef environment is typically made up of three components:
Chef Server
Workstation
Chef Nodes
Chef Server:
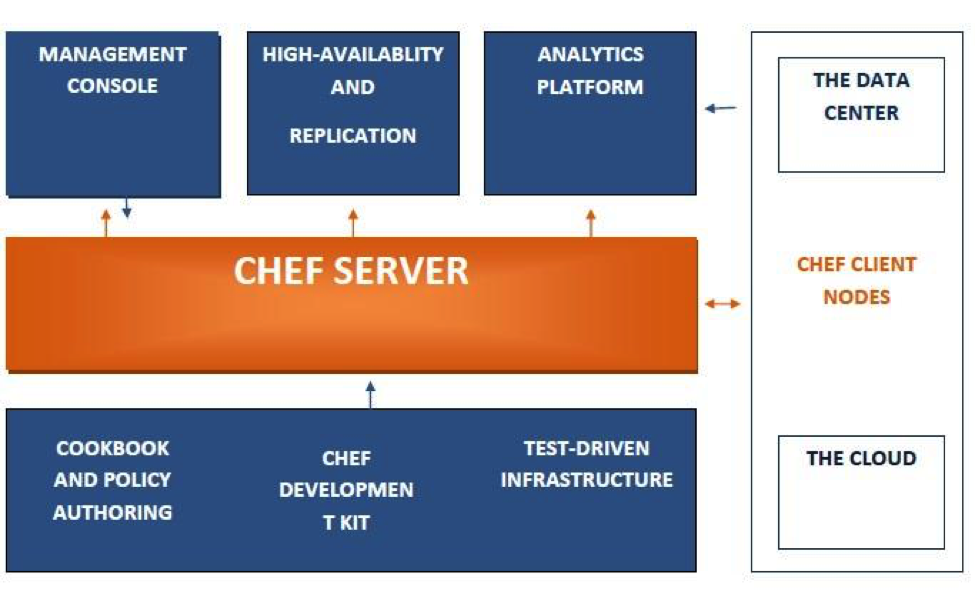
The Chef server is the brains of the operation which acts as a hub to store configuration data that is available to every node and also administer access rights. It preserves all the information regarding your infrastructure. All the client nodes are registered within the server.
The Chef Server stores and holds all the cookbooks, recipes and metadata that illustrates each and every registered node which is being managed by the chef-client and the policies that are applied to nodes. Clients communicates with the server in order to get the correct configuration details from the server such as recipes, templates, file distributions and apply it to the nodes. This type of flexible and scalable approach distributes the configuration effort throughout the organization.
Workstation:
Workstation is the development machine from where users run all configuration related tasks which includes creation of cookbooks and recipes, updating chef-repo, interacting with the single Chef server and many more. Workstation is the place where user will spend most of their time with Chef and will do most of their work that includes:
Development of the cookbooks and the recipes
Retaining the chef-repo synchronization with version source control
Making the use of knife to upload items from the chef-repo to the Chef server
Configuring organizational policies i.e. defining roles as well as environments and ensuring that critical data is stored in data bags
Communicating with the nodes whenever needed, such as carrying out a bootstrap operation
Chef Nodes:
A node can be a physical, virtual or cloud machine that contain the chef-client which performs all the infrastructure automation. Nodes are the computers that we manage using chef and it act as server in our infrastructure.
Fig:1
How Chef Works?
As already mentioned above, Chef converts infrastructure into code and make your infrastructure easily versionable, testable and repeatable as the application code.
Chef is totally dependent and certain about the reusable definitions named recipes to automate infrastructure tasks. Recipes make use of the building blocks called resources. These resources explain a certain pieces of infrastructure like a file, a template or a package to be installed. You can make use of these resources whenever required or even built up your own so as to manage and accomplish unique configurations and legacy systems. Together, Recipes are fully responsible for describing what your infrastructure comprises of and how each portion of your infrastructure should be deployed, configured and managed.
The Chef server holds up all the recipes as well as other configuration data. Now the Chef client is installed on all the nodes in your network. As explained before these nodes can be a physical server, a virtual server or a container instance. The Chef client at regular intervals polls the Chef server for the most recent recipes and examines whether the nodes is in compliance with the policy defined by these recipes. If a situation arises where a node is outdated then the Chef client runs them on the node so as to bring it up to date.
Fig 2
Conclusion:
Through Chef you will be able to:
Manage servers by writing recipes.
Integrate tightly with applications, databases and more.
Configure applications that require knowledge about your entire infrastructure
Create perfect clones of QA environments, pre-production environments, partner preview environments and more.
Chef is evolving fast and taking your first steps with Chef can be a little bit daunting. Chef comes up with new concepts to learn and best practices to understand. Chef provides you help with the infrastructure management and solves complicated problems.