Category: DevOps Toolbox

  • GitKraken App Correlates Activity Across Jira Cloud and Git Repositories

    GitKraken App Correlates Activity Across Jira Cloud and Git Repositories

    GitKraken today made available a preview of a free application that aggregates activity across Atlassian’s Jira Cloud and any Git repository to provide a unified view across all the activities of a software development team.

    Adam Wride, general manager for planning solutions of GitKraken, said Team Insights for Jira (TIJ) will make it easier for DevOps teams, project managers and application stakeholders to collaborate.

    TIJ accomplishes that goal by providing an overlay using a familiar Gannt chart view of epics and issues found in project management applications to correlate, for example, user activity such as status changes and comments made in Jira Cloud with updates to commits and pull requests made in a Git repository, he noted.

    Team members can then filter those views by project, sprint, contributors, issue type and other criteria to drill down on the exact list of issues that need to be addressed, added Wride.

    Most application development efforts rarely follow the original DevOps workflow plan, so TIJ provides a means for organizations to track real-time activity data to visualize how their efforts are progressing against the plan. That makes it possible to make data-driven decisions about how to reallocate resources as needed, said Wride.

    At the core of TIJ is a Git Integration tool that GitKraken previously made available. TIJ is the second offering from the company based on that tool following the launch of an application that integrates Jira with continuous integration/continuous delivery (CI/CD) platforms. GitKraken claimed there are already more than 10,000 organizations employing its Git integration tool.

    As more organizations become dependent on software to drive a wide range of processes, the need for increased visibility into DevOps workflows has become more crucial. Revenue is now directly tied to the pace at which software is being deployed and updated. Any change to the pace at which an application is being developed needs to be communicated across all the stakeholders that might be impacted. The challenge is that given all the dependencies that exist within modern applications, it’s not always easy to discern how a delay in the development of one module or component might impact multiple application development projects.

    Of course, project managers have been using project management applications to bring some order to the chaos of software development for decades. The challenge has always been that manual updates to projects have not always been provided in a timely manner. Developers don’t always remember to update project managers, who must manually enter updates in a project management application. GitKraken is making a case for an approach that automatically updates Jira Cloud by collecting data from DevOps tools and platforms rather than waiting for software engineers to remember to share that information with a project manager.

    Arguably, there’s now no excuse for everyone in an organization—if they care to, they can find out the status of any application development initiative. The challenge is making sure the data that DevOps teams—and their tools and platforms—already generate seamlessly updates the project management software that everyone else relies on to keep track of those projects.

  • Can ChatGPT Fix Bugs? ‘Wolverine’ Dev Says YES

    Can ChatGPT Fix Bugs? ‘Wolverine’ Dev Says YES

    Welcome to The Long View—where we peruse the news of the week and strip it to the essentials. Let’s work out what really matters.

    This week: Instead of AI aids for programming, what about for debugging? The pseudonymous “BioBootloader” says he’s persuaded GPT-4 to make his code self heal. (more…)

  • Fiberplane Adds Open Source Libraries to Automatically Collect Metrics

    Fiberplane Adds Open Source Libraries to Automatically Collect Metrics

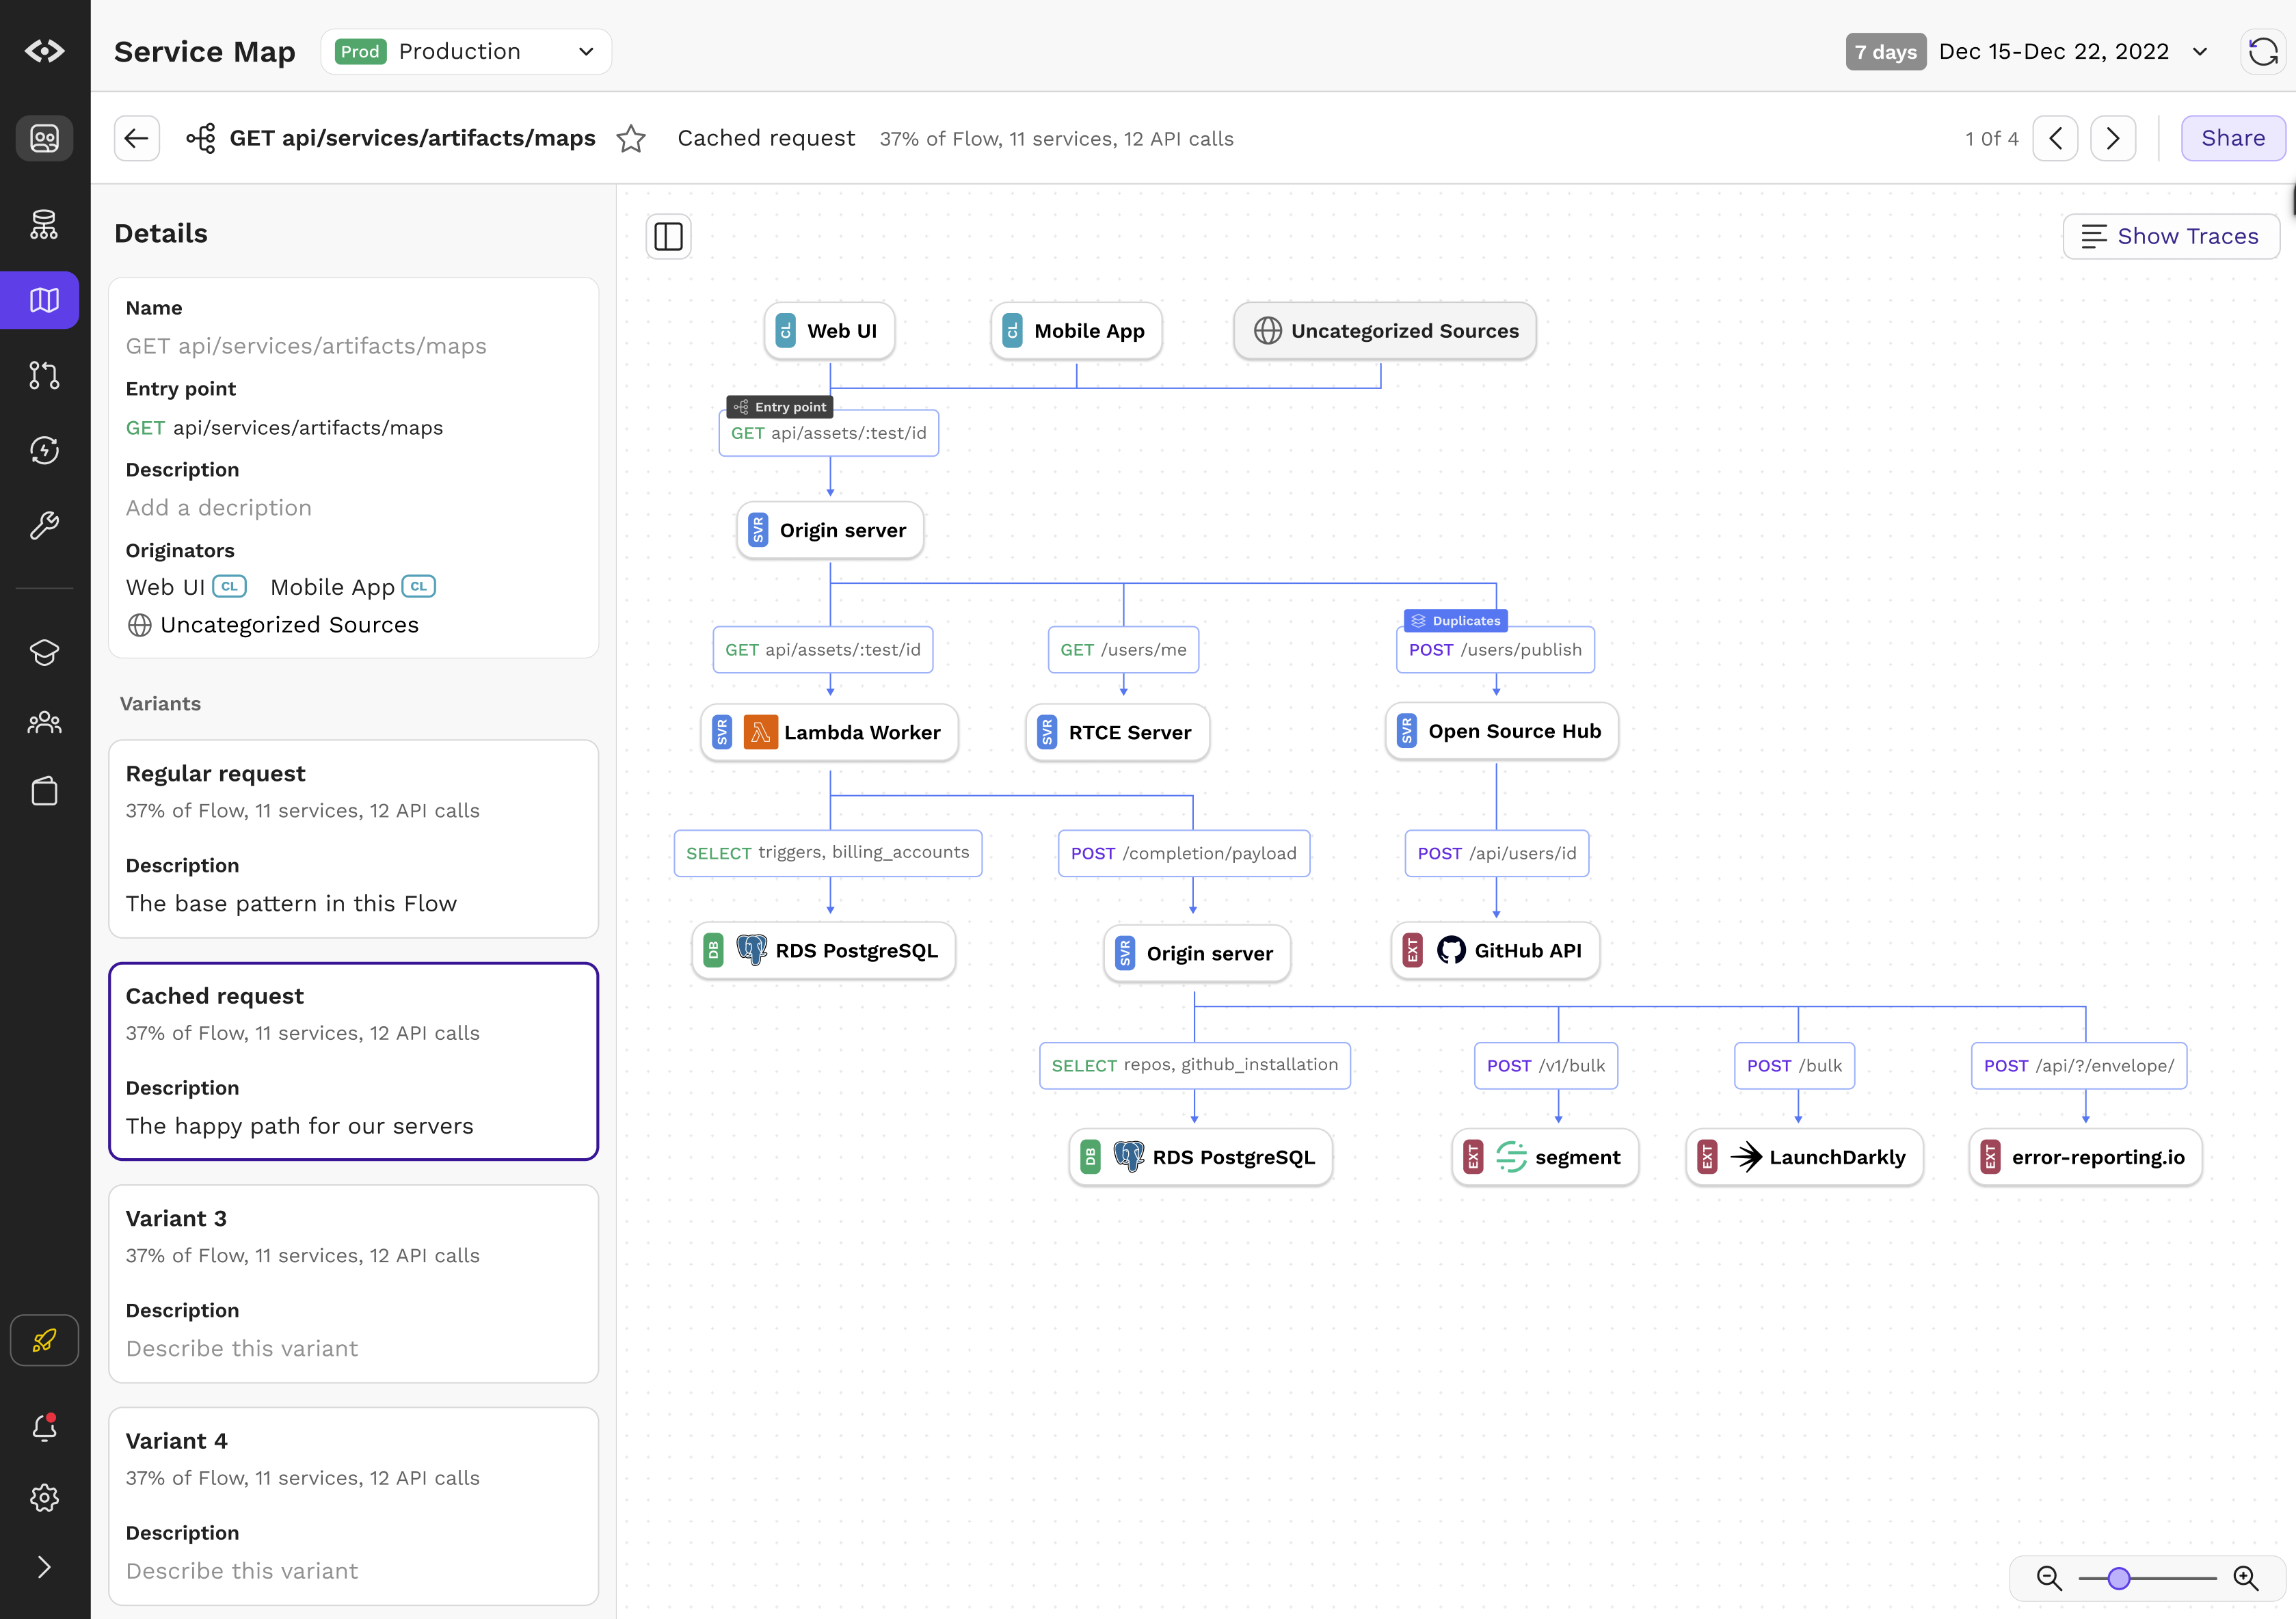
    Fiberplane today added an ability to automatically collect metrics in real-time and make them accessible either via its namesake notebook software for debugging infrastructure or an open source Grafana dashboard.

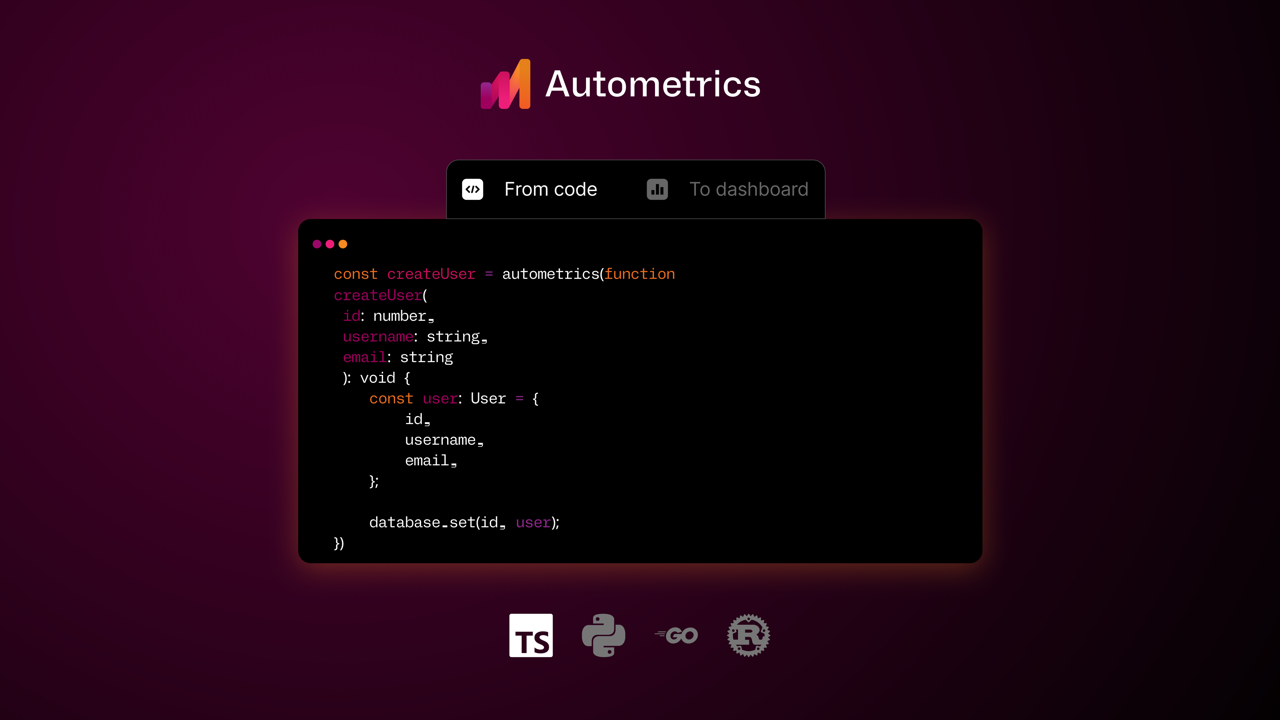
    Fiberplane CEO Micha Hernandez van Leuffen said Autometrics is an open source set of libraries the company created to make it simpler for developers to see platform performance metrics using a set of tools embedded within their integrated development environment (IDE).

    The goal is to reduce the cognitive load on developers; today, developers need to first determine what metrics to track, find a way to collect the appropriate data and then launch queries against those metrics to determine the root cause of an issue, said Hernandez van Leuffen.

    Autometrics, in contrast, provides access to a set of common queries using the Prometheus programming language (PromQL) against data that has been collected using open source OpenTelemetry agent software, he noted.

    That approach, for example, makes it simpler to track error rates, response time and latency of any function. Links to live charts based on real-time data can also be inserted into the comments section of any document a development team creates.

    The Fiberplane notebook uses the same operational transformation algorithm embedded within Google Docs to enable teams to easily collaborate around a document or spreadsheet. The core platform itself is built in Rust and WebAssembly (Wasm) to make it simpler to integrate Fiberplane as a plug-in into an existing DevOps workflow.

    Autometrics extends that capability in a way that enables DevOps teams to provide developers with instant access to observability data. They can then see how their code is performing on any given platform, which is critical as more responsibility for running applications continues to shift left, said Hernandez van Leuffen. Today, many developers need to wait for an IT operations team to share data collected via an observability platform that was designed to be used by ITOps rather than a developer, he added.

    As observability capabilities become more federated across the entire software development life cycle, it’s critical to make sure developers and IT operations teams can see metrics being generated in real-time. Otherwise, confusion arises because teams are not looking at the same set of metrics.

    Fiberplane address that issue by taking the concept of notebooks—often used by data science teams to collaborate—and applying it to DevOps workflows to reduce the amount of time it takes to resolve any issue. As IT environments become more distributed in the age of the cloud and microservices, troubleshooting issues invariably spans the responsibilities of multiple members of an IT team. In effect, a notebook makes it possible to spin up a virtual war room on demand that enables the members of an IT organization to collaborate—regardless of where they are physically located or which organization they may be employed by.

  • Harnessing the Power of AI Chatbots for Continuous Testing

    Harnessing the Power of AI Chatbots for Continuous Testing

    Artificial intelligence (AI) is revolutionizing the way we develop and test software, especially with the advent of AI chatbots. These intelligent agents have the potential to streamline and automate continuous testing while improving software quality. However, software and QA managers must understand the urgency, opportunities, pitfalls and best practices associated with integrating AI chatbots into continuous testing processes. This blog explains crucial aspects to help your team harness the full potential of AI-driven continuous testing.

    The Urgency of Integrating AI Chatbots Into Continuous Testing

    • Increasing complexity of software applications: Modern software applications are becoming increasingly complex, which makes manual testing time-consuming, error-prone and costly. AI chatbots can analyze vast amounts of data in real-time, identify patterns and learn from the testing process, making them invaluable for continuous testing.
    • Fast-paced development and market demands: Today’s competitive market demands faster release cycles and shorter time-to-market. AI chatbots can help you accelerate testing and development cycles, allowing your team to focus on delivering high-quality software promptly.
    • The growing importance of customer experience: AI chatbots can simulate user interactions and predict user behavior, helping to improve user experiences by identifying potential issues before they become real problems.

    Opportunities for AI Chatbots in Continuous Testing

    • Improved test coverage and accuracy: AI chatbots can execute a large number of tests simultaneously, leading to better test coverage and increased accuracy.
    • Enhanced defect detection: AI chatbots can identify defects early in the development process, reducing the overall cost and time spent fixing them.
    • Efficient resource allocation: By automating repetitive tasks and reducing human intervention, AI chatbots enable teams to allocate resources more effectively, leading to increased productivity.

    Pitfalls to Avoid When Implementing AI Chatbots

    • Over-reliance on AI: AI chatbots are powerful tools, but they should not replace human testers completely. Human intuition, creativity and critical thinking are essential for effective testing.
    • Insufficient training data: To work effectively, AI chatbots require quality training data. Ensure that your chatbot is trained with diverse and representative datasets to minimize the risk of biased or inaccurate results.
    • Integration challenges: Integrating AI chatbots with existing systems and processes can be challenging. Ensure that your team has a clear understanding of the integration requirements and potential issues that may arise.

    Best Practices for Applying AI Chatbots to Continuous Testing

    • Define clear objectives: Establish clear goals and expectations for your AI chatbot to ensure that it aligns with your team’s overall testing strategy.
    • Choose the right AI chatbot platform: Consider factors like cost, scalability, ease of integration and support for programming languages when selecting an AI chatbot platform.
    • Continuously monitor and refine: Continuously monitor your AI chatbot’s performance and make necessary adjustments to improve its effectiveness and efficiency.
    • Foster collaboration: Encourage collaboration between human testers and AI chatbots to leverage the strengths of both.

    Benefits of Applying AI Chatbots to Continuous Testing

    • Improved test coverage and accuracy: AI chatbots can execute a large number of tests simultaneously, leading to better test coverage and increased accuracy. By automating repetitive and complex tasks, AI chatbots can effectively handle edge cases and efficiently test various scenarios, thereby reducing the likelihood of undetected issues in the software.
    • Enhanced defect detection and early issue identification: AI chatbots can quickly identify defects and potential issues early in the development process, reducing the overall cost and time spent on fixing them. By leveraging machine learning and pattern recognition, AI chatbots can predict potential problems and bring them to the attention of developers, allowing for proactive resolution and improved software quality.
    • Efficient resource allocation and increased productivity: By automating repetitive tasks and reducing human intervention, AI chatbots enable teams to allocate resources more effectively. Human testers can focus on higher-level tasks that require creativity, critical thinking, and domain expertise. This leads to increased productivity, as the team can concentrate on delivering high-quality software and improving user experiences.

    Conclusion

    AI chatbots are transforming the landscape of continuous testing, offering unprecedented opportunities to improve software quality and speed up development cycles. By understanding the urgency, opportunities, pitfalls and best practices associated with integrating AI chatbots into continuous testing processes, software managers can effectively harness the potential of these intelligent agents and drive their teams toward success.

  • 5 Best Practices for Using VMs on Azure Cloud

    5 Best Practices for Using VMs on Azure Cloud

    When beginning a cloud improvement/optimization project, an easy place to start is to focus on the initial low-hanging fruit of your virtual machine (VM) environments. This article takes a closer look at these steps, using a Microsoft Azure VM environment as an example.

    Here are five best practices that can be easily achieved when using VMs on Azure cloud.

    1. Properly Size Your Virtual Machines: To maximize performance and minimize costs, it’s important to size your VMs appropriately. You can use the Azure portal to determine the right size for your workloads and then select the right VM size based on the CPU, memory and storage requirements of your application. For example, you can use the Azure VM sizing calculator tool to get an estimate of the virtual machine size based on your workload requirements.

    Let’s say you want to host a web application that requires 2 vCPUs, 8 GB of memory and 50 GB of storage. You can use the Azure VM sizing calculator tool to determine the appropriate VM size based on these requirements. The tool may suggest using a “Standard B2s” VM which has 2 vCPUs, 4 GB of memory and a maximum disk size of 32 GB.

    In this case, you would need to increase the disk size to 50 GB. You can do this by adding a data disk to the VM or using a larger VM size with enough disk space. For example, you could use a “Standard B4ms” VM with 4 vCPUs, 16 GB of memory, and a maximum disk size of 64 GB.

    It’s important to note that the actual VM size may vary based on your workload requirements and the specifics of your application. The Azure VM sizing calculator tool provides a helpful starting point, but you should also perform your own testing and validation to ensure that the VM size meets your needs.

    2. Use Managed Disks: Managed disks provide increased reliability, scalability and security compared to traditional storage accounts. For example, you can use managed disks to automatically scale the disk size and performance as the data grows and to replicate data for disaster recovery.

    For example, to create a 100 GB managed disk, follow these steps:

    • In the Azure portal, go to the “Disks” section and click on “Add.”
    • Select “Blank disk” as the source and specify the disk size as 100 GB.
    • Choose the appropriate storage account type (Premium or Standard), replication options and disk type (HDD or SSD).
    • Give the disk a name and create it in the same resource group as your VM.
    • Once the disk is created, you can attach it to your VM by going to the virtual machine’s “Disks” section, clicking on “Attach,” and selecting the newly created disk. By using managed disks, you benefit from automatic disk management and replication as well as improved reliability and security compared to traditional storage accounts. Additionally, managed disks simplify the process of attaching and detaching disks to and from VMs, making it easier to manage your storage resources.

    3. Enable Monitoring and Diagnostics: To monitor the health and performance of your VMs, you can use Azure Monitor which provides real-time insights into resource utilization, application performance and other key metrics. You can also configure alerts to notify you of potential issues and diagnose problems using Azure Log Analytics. For example, you can set up an alert to notify you if the CPU usage of a VM exceeds a certain threshold.

    You can also use Azure Monitor to gain real-time insights into the virtual machine’s resource utilization, application performance and other key metrics by following these steps:

    • In the Azure portal, go to the virtual machine’s “Monitoring” section.
    • Click on “Diagnostic settings” and then click on “Add diagnostic setting.”
    • Give the diagnostic setting a name, select the VM you want to monitor and choose the metrics and logs you want to collect.
    • Choose the storage account you want to use to store the monitoring data and specify the retention policy for the data.
    • Click “Save” to apply the changes.

    By enabling monitoring and diagnostics for your virtual machines, you can proactively monitor the health and performance of your VMs and quickly identify and resolve potential issues. Additionally, you can use the collected data to generate reports, visualize trends and perform analysis to gain deeper insights into the performance of your VMs.

    4. Implement Security Best Practices: To secure your virtual machines, you can use Azure Security Center to implement security best practices and monitor for potential threats. You can also use Azure Active Directory to control access to VMs and secure your identity management. For example, you can use Azure Security Center to assess the security of your VMs and implement security recommendations such as enabling network security group (NSG) rules to restrict inbound and outbound traffic.

    If you have a VM that you want to connect to other resources in your Azure environment, you can use a managed virtual network to provide a secure and scalable networking solution for your VM.

    Here is how to create a managed virtual network in Azure:

    • In the Azure portal, go to the “Virtual network” section and click on “Add.”
    • Give the virtual network a name, select the appropriate subscription and resource group and specify the address space.
    • Create one or more subnets within the virtual network, and specify the subnet address range and subnet name.
    • Associate the virtual network with a network security group (NSG) to control inbound and outbound traffic.
    • Create a network interface for your VM and associate it with the virtual network and subnet you created.

    By using a managed virtual network, you can create a secure and isolated network environment for your VM and connect it to other resources in your Azure environment. Additionally, you can use the virtual network to control and manage network traffic and implement advanced networking scenarios such as load balancing, VPN connectivity and more.

    5. Keep Virtual Machines Up-to-Date: Regularly updating your VMs with the latest security patches and software updates helps ensure that they are protected against potential threats and vulnerabilities. You can use Azure Update Management to automate the update process and keep your VMs updated. For example, you can schedule regular updates for your VMs to ensure they always have the latest security patches and software updates installed.

    When planning public cloud environments, two commonly used words are “progress” and “results.” Following the best practices above will help position your cloud journey for success.

  • Orgs Shift Toward Centralizing Automation Initiatives

    Orgs Shift Toward Centralizing Automation Initiatives

    A survey published today found that 75% of respondents recognized that automation silos hamper their ability to unify cloud operations across functions.

    Conducted by CloudBolt Software, the survey polled 350 senior IT and DevOps leaders at organizations with more than 3,000 employees. On a positive note, the survey found 57% of respondents were starting to pursue a more centralized approach to automation, with a total of 88% acknowledging that having all previous and new automation centralized for the entire organization would ensure compliance, bolster security, enable business continuity, encourage reuse and reduce risk.

    Rather than taking a more holistic approach, well over half of respondents (57%) reported automation efforts are limited to specific silos. On average, organizations are employing 27 different automation tools their organizations have deployed, using one or a few as they see fit, with little to no consistency across teams. More than half (55%) of respondents said they have four or more separate automation teams, with 95% noting that each of those teams operates in their own silo.

    CloudBolt CTO Rick Kilcoyne said that lack of continuity clearly creates inefficiencies and redundancies that conspire to raise the total cost of IT. The challenge is that each team tends to favor one approach to automating a silo with little to no regard for a larger overall strategy to create an automation standard, he said.

    That approach also creates issues whenever a member of one of those teams leaves an organization, he noted. In fact, the survey found 77% of respondents reported that continuity is at risk any time a vital member of the team leaves.

    CloudBolt has been making a case for a federated automation platform that can be invoked either via application programming interfaces (APIs) or a graphical user interface (GUI) that provides access to low-code tools. The goal is to make the platform equally accessible to DevOps teams or IT administrators that tend to lack programming skills, and do so in a way that doesn’t require individual teams to replace their automation platform of choice. Instead, each of the automation platforms can be programmatically invoked via a central framework, said Kilcoyne. That approach eliminates any political debate over the potential need to replace one team’s favored automation platform with another, noted Kilcoyne.

    Regardless of who is accessing the platform, most organizations would be well-advised to develop a center of excellence for automation, he added.

    DevOps teams have always been committed to ruthlessly automating as many IT processes as possible, but in many cases, that has resulted in a plethora of automation tools being employed. In effect, automation may have become too much of a good thing. One approach to regaining control over those platforms is to create a platform engineering team that centralizes the management of DevOps workflows.

    Regardless of approach, Kilcoyne said the most important thing for any team to do before automating an IT workflow is to first understand how to manually set it up. Too many IT teams are trying to apply automation to processes they don’t really understand with mixed results, he added.

    The one thing that is certain, especially with the rise of artificial intelligence (AI), is the management of IT is going to become more automated.

  • CodeSee Extends Reach of Code Visualization Platform

    CodeSee Extends Reach of Code Visualization Platform

    CodeSee updated its code visibility platform to enable instant mapping of application services, directories, file dependencies and code changes.

    CodeSee CEO Shanea Leven said CodeSee Enterprise 2.0 should extend the appeal of the platform beyond developers to include software engineers managing DevOps workflows.

    CodeSee Enterprise 2.0 provides real-time visibility across multiple repositories regardless of whether the application is a monolith or based on a microservices architecture, she noted.

    In addition, a Code Automations module enables developers to set granular conditions and actions down to the function level, requiring checklists to be complete before allowing developers to move on.

    CodeSee Maps now includes the ability to click to view code directly, while a streamlined Review Maps module has decreased code review time by 30%. Developers can easily share maps to discuss proposed changes or keep necessary code changes as automatic permanent artifacts.

    Additional languages including C#, VB.NET, ASP.NET, Blazor, Java, JavaScript, Go, Python and TypeScript are now supported.

    Finally, CodeSee is making available a dedicated solutions engineering team that provides guidance to connect an organization’s Datadog or OpenTelemetry trace data to CodeSee in less than an hour without storing code or having to first dive deep into traces, noted Leven.

    The core open source CodeSee tool was created because it takes too long today for most developers to pore over a codebase to understand where they might contribute. The larger a codebase becomes, the longer it takes for a developer or software engineer to be onboarded to a new project.

    The overall goal is to improve developer productivity, noted Leven. That’s become a critical issue because many organizations are hesitant to hire additional developers during uncertain economic times; they first want to ensure they maximize the utilization of the teams they already have.

    Application development, of course, is now a team sport. The days when a lone developer cared for an entire application are long over. The issue is finding a way for teams of developers to collaborate more easily in an era where many of them may never have met in person.

    In the longer term, Leven said she also expects that generative artificial intelligence (AI) platforms such as ChatGPT will supplement code visualization tools. Many developers are already starting to use these tools to help generate code faster. That code should, in theory, have fewer errors because it has essentially been copied from other previously validated sources. CodeSee provides a means to visualize that code before deploying it to ensure it will function as promised in increasingly complex application environments.

    One way or another, the tools being provided to developers to boost productivity are advancing. It’s not clear what metrics should be employed to track developer productivity, but the amount of code simultaneously moving through DevOps workflows is going to increase. The challenge DevOps teams face now is keeping track of all the dependencies that exist in that code as application environments are continuously updated.

  • The Benefits of a Streaming Database

    The Benefits of a Streaming Database

    Streaming databases offer an innovative approach to data processing that combines the familiarity of traditional models with a powerful data transformation engine. This hybrid system provides DevOps and DataOps teams with extremely fast results for complex SQL queries, aggregations and transformations that are impossible or take hours to process in the traditional batch computation model.

    By pre-specifying query results upfront (in materialized views) and then incrementally updating them as new data comes in, streaming databases offer a valuable alternative to traditional databases that require complex ETL pipelines or overnight batch processing.

    As the demand for faster results continues to rise, streaming databases are emerging as a fundamental new building block for data-driven organizations.

    streaming database

    History

    Streaming database concepts originated in capital markets, where fast computation over continuous data is highly valued. The first products were basic event processing frameworks that addressed specific needs within hedge funds and trading desks. However, their creators quickly recognized that SQL works as the declarative language for streaming data just as well as it does for traditional static databases.

    Today, modern streaming databases are most often used downstream of primary transactional databases and/or message brokers, similar to how a Redis cache or a data warehouse might be used.

    Trade-Offs

    Experienced engineers understand that no software stack or tooling is perfect and comes with a series of trade-offs for each specific use case. With that in mind, let’s examine the particular trade-offs inherent to streaming databases to understand better the use cases they align best with.

    Unique Features

    • Incrementally updated materialized views – Streaming databases build on different dataflow paradigms that shift limitations elsewhere and efficiently handle incremental view maintenance on a broader SQL vocabulary. Other databases like Oracle, SQLServer and Redshift have varying levels of support for incrementally updating a materialized view. They could expand support, but will hit walls on fundamental issues of consistency and throughput.
    • True streaming inputs – Because they are built on stream processors, streaming databases are optimized to individually process continuous streams of input data (e.g., messages from Kafka). Scaling streaming inputs involves batching them into larger transactions, slowing down data and losing granularity. In traditional databases (especially OLAP data warehouses), larger, less frequent batch updates are more performant.
    • Streaming outputs on queries – Many databases have some form of streaming output (e.g., the Postgres WAL), but what’s missing is output streams involving any kind of data transformation. Streaming databases allow for streaming output of complex joins, aggregations and computations expressed in SQL.
    • Subscribe to changes in a query – As a side effect of streaming outputs, streaming databases can efficiently support subscriptions to complex queries: Updates can be pushed to connected clients instead of forcing inefficient polling. This is a key building block for pure event-driven architectures.

    Missing Features

    • Columnar optimization – OLAP databases have advanced optimization techniques to speed up batch computation across millions of rows of data. Streaming databases have no equivalent because the focus is on fast incremental updates to results prompted by a change to a single row.
    • Non-deterministic SQL functions – Non-deterministic functions like “RANDOM()” are common and straightforward in traditional databases. But imagine running a non-deterministic function continuously, resulting in chaotic noise. Therefore, streaming databases don’t support non-deterministic SQL functions like “RANDOM().”

    Performance Gained

    • Minimized time from input update to output update – The time between when data first arrives in the streaming database (input) and when changes to results reflect the change (output) is sub-second. Additionally, it keeps up as the dataset scales because results are incrementally updated.
    • Repeated read query response times – When a query or query pattern is known and pre-computed as a persistent transformation, reads are fast because they require no computation: You’re just doing key-value lookups in memory, similar to a cache like Redis.
    • Aggregations – The resources needed to handle persistent transformations are often proportionate to the number of rows in the output, not the scale of the input. This can lead to dramatic improvements in performance in aggregations in a streaming DB versus a traditional DB.

    Performance Sacrifices

    • Ad-hoc query response times – While running ad-hoc queries in a streaming database is possible, response times will be much slower because the computation plan is optimized for continuously maintaining results, not answering point-in-time results.
    • Window functions – A window function performs calculations across table rows that are related to the current row. They are less performant in streaming databases because updating a single input row requires updating every output row. Consider a “RANK()” window function that ranks output by a computation. A single update can force an update to every row in the output.

    Factors Impacting Scalability

    • Throughput of changes – The changes or updates to input data are what triggers work in the system, so changing data will often require more CPU than data that changes rarely.
    • Cardinality of the dataset – The total number of unique keys will slow down read queries in traditional databases. In streaming databases, high cardinality increases the initial “cold-start” time when a persistent SQL transformation is first created and requires more memory on an ongoing basis.
    • Complexity of transformations – Unlike the on-request model in a traditional DB, SQL transformations are always running in a streaming database in scale in two ways:
      • Memory required to maintain intermediate state – Imagine how you would incrementally maintain a join between two datasets: You never know what new keys will appear on each side, so you must keep the entirety of each dataset in memory. This means that joins over large datasets can take a significant amount of memory.
      • Quantity and complexity of transformations – When a single change in inputs needs to trigger a change in outputs in many views, or when many layers of views depend on each other, more CPU is required for each update.

    Use Cases

    Like any software primitive, there are many use cases. Here are some categories of products and services particularly well-suited to streaming databases:

    • Real-time analytics – Use the same ANSI SQL from data warehouses to build real-time views that serve internal and customer-facing dashboards, APIs and apps.
    • Automation and alerting – Build user-facing notifications, fraud and risk models, and automated services using event-driven SQL primitives in a streaming database.
    • Segmentation and personalization – Build engaging experiences with customer data aggregations that are always up-to-date: personalization, recommendations, dynamic pricing and more.
    • Machine learning in production – Power online feature stores with continually updated data, monitor and react to changes in ML effectiveness – all in standard SQL.

    Conclusion

    Streaming databases offer a powerful yet accessible way for data and software teams to leverage stream processing capabilities. By using familiar SQL DB concepts and a stream processor to compute SQL transformations, data and software teams can focus on shipping complex data-driven products quickly, with improved performance and scalability. With a streaming database, organizations have the power to transform data in real-time and build the applications of tomorrow.

  • npm is Scam-Spam Cesspool ¦ Google in Microsoft Antitrust Thrust

    npm is Scam-Spam Cesspool ¦ Google in Microsoft Antitrust Thrust

    Welcome to The Long View—where we peruse the news of the week and strip it to the essentials. Let’s work out what really matters.

    This week: The npm registry suffers spam infestation, and Microsoft makes Google sad. (more…)

  • Salesforce Spring 2023 Release: Out With the Old, A Lot of the New

    Salesforce Spring 2023 Release: Out With the Old, A Lot of the New

    Salesforce is the connector and enabler of so many critical business functions. But that doesn’t mean it doesn’t come with its headaches. The environment is so complex that it really takes a conscious, focused effort to properly leverage all that Salesforce has to offer, as well as stay up-to-speed on everything that’s new and evolving.

    The Salesforce spring ‘23 release brought a lot of change. Some old tools disappeared and new products, dashboards and automation tools were introduced that admins will have to adapt to. There’s a lot to catch up on.

    Combing through the 600+ pages of release notes, there are three main themes represented in the spring release that will be useful to the entire organization, from DevOps and RevOps to sales and marketing teams, including: 1) new admin and developer tools and dashboards, 2) doubling down on low-code/no-code with enhancement to Flow and 3) commitment to security and permissions best practices.

    Admin and Developer Updates

    From an administrator’s and developer’s perspective, there are some exciting new features that will undoubtedly improve DevOps’ day-to-day. For instance:

    • Flows – allows you to migrate your old automations.
      • Connect to external data source (beta)
      • Support for lookup fields
      • Reactive screens (reduce the number of “Next” clicks)
      • Removal of “Iteration Limit Exceeded” governor limits
      • Element descriptions are now visible on the canvas
      • Migrate to Flow from Process Builder

    • DevOps Center – Still in V1, but it provides developers with a new interface.
      • Getting on the software development life cycle bandwagon so we can all say goodbye to change sets – finally!
    • Dashboards – Now you can insert text and graphics around charts.
      • Collections – organize reports and dashboard into logical collections that are free from their folder hierarchy. While they will still “live” in their folders, they can be accessed from a collection as well.
      • Add image and text components in your Dashboard to make better experiences with additional information, descriptions, instructions or whatever you want.

    These updates are not only useful for DevOps but, from an executive viewpoint, are extremely useful to showcase the business’s data with a clearer perspective. In other words, the new dashboards have more options to provide additional context and insight. In general, the user interface is not only more organized but can be navigated at a significantly faster rate than before.

    Doubling Down on Flow

    As the old adage goes, “Out with the old, in with the new;” Salesforce will be retiring the automation tools Workflows and Process Builders and converting them to Flow. The reason Salesforce is making this move—and ultimately forcing users to Flow—is because Workflows and Process Builders don’t have the flexibility or functionality that Flow does. Flow can create automation and provide great screen experiences that derive a far greater bandwidth of context and situational logic. The additions made to this much-anticipated migration tool will help administrators convert their current automation into Flow with less stress and hassle than rebuilding them all from scratch.

    So what is the timeline for this migration? Salesforce plans on blocking the ability to create new Process Builders in the Summer ‘23 release but has admitted that it’s not a hard date and will look at the success of customers’ migrations to Flow and feedback from the community. They have not yet announced a date for complete retirement but expect it to come sometime in 2025. That said, users should start doing this now. With any major change to your Salesforce environment, a plan is always recommended, especially with such a huge migration like this one. Given the amount of data and processes most organizations already have in place, we suggest taking time to strategize and test your migration prior to releasing it directly to Flow to make sure your order of operations for your automation is clear and follows best practices. Analyze your business processes and confirm with your users that these processes are still accurate.

    Commitment to Security

    As organizations lean more on Salesforce as their primary business operating system, Salesforce is becoming a critical piece of infrastructure rather than just software that businesses consume. It is also the “build-and-develop” nature of Salesforce that has more companies treating Salesforce as software they build rather than just software they use. The ripple effect is that as companies build within Salesforce, more developers are responsible for deploying and managing data. With that comes the responsibility for security and compliance.

    This has traditionally been handled as an administrative task, but now, Salesforce has created the tools for true enterprise infrastructure security and data management with permission sets and permission set groups. Even though permission sets have been around a while, the introduction of permission set groups and the growing need to transition permissions into more complex structures have changed the way permission sets are being consumed. Permission sets were previously used for basic exceptions to the permissions provided by profiles, but now they are front and center, providing even more organizational capability with Permission Set Groups (and their muting capability, but that’s a different story).

    Salesforce has taken note and announced the partial end of permissions within profiles as they lean into the new, better way to manage permissions. Profiles won’t be gone entirely, as they will still be needed for basic defaults, i.e., defining users’ default app selections. However, while Permission Sets will still have the responsibility for what apps you have access to, it will be the Profile that states which one is your default. This is also true for other types of assignments where there needs to be a single source of truth, like page layout assignments.

    Salesforce said they will be enforcing this plan in 2026 but are beginning to make sure everyone gets on board now by releasing great new tools to make this transition smoother, including user access policies and access to Permission Sets when adding new fields (currently only available for profiles). For large organizations, three years is just around the corner when it means implementing major overhauls in technology and philosophy to the business. While some are heading to building Permission Sets based on each object, I’d recommend basing them on features or functional areas to have the most control and the clearest overview of your new vast area of Permission Sets.

    Next Salesforce Release

    Overall, the spring ‘23 release was jam-packed with content to boost productivity, strengthen security, enhance the user experience and improve the overall business functionality. There are two Salesforce releases still to come in 2023, and I’ll be dissecting them both to highlight the most critical changes that can help you better your business. I’m looking forward to seeing what the summer ‘23 release has in store – any predictions on what Salesforce will come up with next? I’ve got a few guesses…