Mid-last year our team switched from doing Agile to doing DevOps. As we forayed into the journey trying to learn about DevOps and practice it at the same time, a lot of questions arose in the team. How was this different from agile and most importantly How were we going to be successful?
That’s when we wrote down what would be the success criteria for our team: “Ship code frequently without causing a customer outage“.
As the team matured we started evaluating a more granular way to track success. Could the team mantra be broken down into quantifiable success metrics that could be represented in a scorecard? Based on our experience the DevOps scorecard should contain these 9 metrics to track DevOps team success:
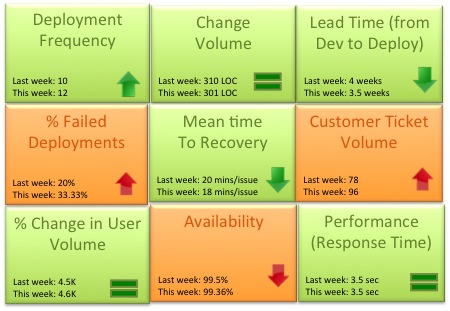
- Deployment frequency: How often were we deploying code and getting new code in the hands of our customers? This metric should trend up or remain stable from week to week. Example: Twice a week, 50 times a day
- Change volume: For each deployment how many user stories and new lines of code were we shipping? Example: 3 new features per day, Average 500 lines of new code per week. Another parameter to consider in addition to volume is complexity of change.
- Lead Time (from Dev to Deploy): How long does it take on an average to get the code from development complete through a cycle of A/B testing to 100% deploy and upgrade on production? Lead time should reduce as the team gets a better hold of the lifecycle.
- Percentage of failed deployments: What percentage of deployments failed causing an outage or a negative user reaction? This metric should decrease over time. Example: 9% deployments failed this month as opposed to 15% last month. This metric should be reviewed in combination with the change volume. If the change volume is low or remained the same but the percent of failed deployments increased, then there maybe a disfunction somewhere.
- Mean time to recovery: When we did fail, how long did it take us to recover? This is a true indicator of how good we are getting with handling change and this should ideally reduce over time. You can expect some spikes in this number due to complex issues not encountered before. Example: On an average it took the team 15 minutes to resolve each last week, 14 minutes this week.
- Customer Ticket Volume: Number of alerts generated by customers to indicate issues in the service. This is a basic indicator of customer satisfaction. Example: 54 tickets were generated this week as opposed to 38 while the user volume remained steady is not a good thing
- % Change in User Volume: Number of new users signing up, interacting with my service and generating traffic. As new users sign up is my infrastructure able to handle the demand? Example: This week the number of customers spiked by 30% due to an external event causing volume of requests to go up
- Availability: What is the overall uptime for my service and did I violate any SLAs? Example: 99.9% uptime consistently for the last 3 months even with change in user volume
- Performance (Response Time): Is my service performing within my predetermined thresholds? This metric should remain stable irrespective of % change in user volume or any new deployment. Example: Sub 5 second response time from all geographies and devices
Would love to hear thoughts on what other critical metrics DevOps teams are using
Hi,
One that I find quite practical and critical as well to offer a good feedback of the overall quality of the deliveries is the amount a new incidents or bugs reported by testers and categorize them by environment (assembly, pre-prod., prod.)
That also allows us to usually get an overview on what we are doing right and where to enhance tests and change people’s focus. Typically, if we see more bugs in pre-prod. than in QA, that means we do have a serious testing problem in that specific environment (wrong config, wrong set of tests, environment failure, lack of competency…).
it’s usually a lot more useful in the beginning of a project but it’s always good to have.
Regards,
B.
Hi,
I am very interested in DevOps Performance indicators, but I have no idea how to collect them, may I use a automated tool or what process can I use.
We wrote scripts to track the metrics by pulling data from Jenkins, Chef, Rational , Github, APM tool and ticket management.
I’m confused by the first sentence. “Mid-last year our team switched from doing Agile to doing DevOps.” Can’t I use them together? You would think that they would complement each other.
Yes, See my comment above.
The premise of this article is disheartening. You don’t “switch” from doing agile to doing DevOps. DevOps is an Engineering culture of mutual understanding, shared business objectives, communication, collaboration and empathy that enables the business to be more effective which “sometimes” has the side affect of resulting in continuous deployment, continuous integration and automation.
DevOps can happen in any development methodology whether it’s waterfall, agile, scrum or kanban.
The reason I said switched from doing Agile to doing DevOps is that when we were practicing “Agile” we were shipping very 3 – 6 months – there were still silos between Dev and Ops. As we adopted the DevOps culture we were able to speed up our delivery, shipping code as often as multiple times a week or day.