This article’s purpose is to compare the “big two” in the log analytics world—Splunk and the ELK Stack. But before we go into details, a short introduction to the competitors is required.
Splunk is the “Google for log files” heavyset enterprise tool that was the first log analysis software and has been the market leader ever since. The open-source ELK Stack of Elasticsearch, Logstash and Kibana is an up-and-coming rival that is a consolidated data analytics platform. The two compete in terms of features, usability and cost.
Overview
Splunk and the ELK Stack use two different approaches to solve the same problem. People typically choose one or the other based on how their organizations are structured and how much time they want to devote to log analytics. Splunk takes a pile of data and allows people to search through the information to extract what they need. ELK requires more work and planning in the beginning, but the value extraction is easier at the end.
The three key components of Splunk are its forwarder, which pushes data to remote indexers; indexer, which has roles for storing and indexing data and responding to search requests; and search head, which is the front end of the web interface where these three components can be combined or distributed over servers. Splunk also supports the integration of its functionalities in applications via SDKs. Common use cases include operational monitoring, security and user behavior analytics. Splunk is a paid service wherein billing is generated by indexing volume.
The ELK Stack is a set of three open-source products—Elasticsearch, Logstash and Kibana—all developed and maintained by Elastic. Elasticsearch is NoSQL database that uses the Lucene search engine. Logstash is a data processing and transportation pipeline used to populate Elasticsearch with the data (though also it supports other destinations including Graphite, Kafka, Nagios and RabbitMQ). Kibana is a dashboard that works on top of Elasticsearch and facilitates data analysis using visualizations and dashboards.
Both Splunk and the ELK Stack can be used to monitor and analyze infrastructure in IT operations as well as for application monitoring, security and business intelligence.
ELK vs. Splunk
Loading Data
Shipping data to Splunk is fairly easy. After installation, the forwarders come pre-configured for a wide selection of data sources such as files and directories, network events, windows sources and application logs, and they are used to import data into Splunk as shown:

In the ELK Stack, Logstash is used to ship data from the source to the destination. However, Logstash needs to be configured so that each field is identified before the data is shipped to Elasticsearch. This kind of configuration can be tricky for those who do not work with scripting languages (such as Bash, Python or Ruby), but there is good support online that can be found quite easily.
Visualizations
The Splunk web UI includes flexible controls that allow you to edit and add new components to your dashboard. Management and user controls can be configured differently for multiple users, with each having a customized dashboard. Splunk also supports visualizations on mobile devices with application and visualization components that are easy to customize using XML.
Kibana is the visualization tool in the ELK Stack, and like Splunk, the platform supports the creation of visualizations such as line charts, area arts and tables and the presentation of them in a dashboard. The search filter is always shown above the different views: If a query is used, it is automatically applied on elements of the dashboard. Splunk also has a similar option, but it involves configuration in XML. Still, Kibana does not support user management, but hosted ELK solutions provide it out of the box.

Search Capabilities
The search function is a key capability of any log management platform. Both the Splunk and ELK Stack’s web UIs support searching using a dedicated search field. The query syntax on Kibana is based on the Lucene query syntax while Splunk uses its own Splunk Search Processing Language (SPL). Those familiar with scripting languages may already be familiar with Lucene while SPL is proprietary and must be learned.
One other difference is that Splunk offers dynamic data exploration to help users to find and extract everything as a searchable field when formatted in a manner that allows searching for non-configured fields. Elasticsearch fields, on the other hand, need to be defined in advance to use aggregation over the log properties.
Here is one example of a query for each platform.
Kibana:
(beat.hostname: ES1 AND metricset.name: process) AND (system.process.username: root OR system.process.username: admin)
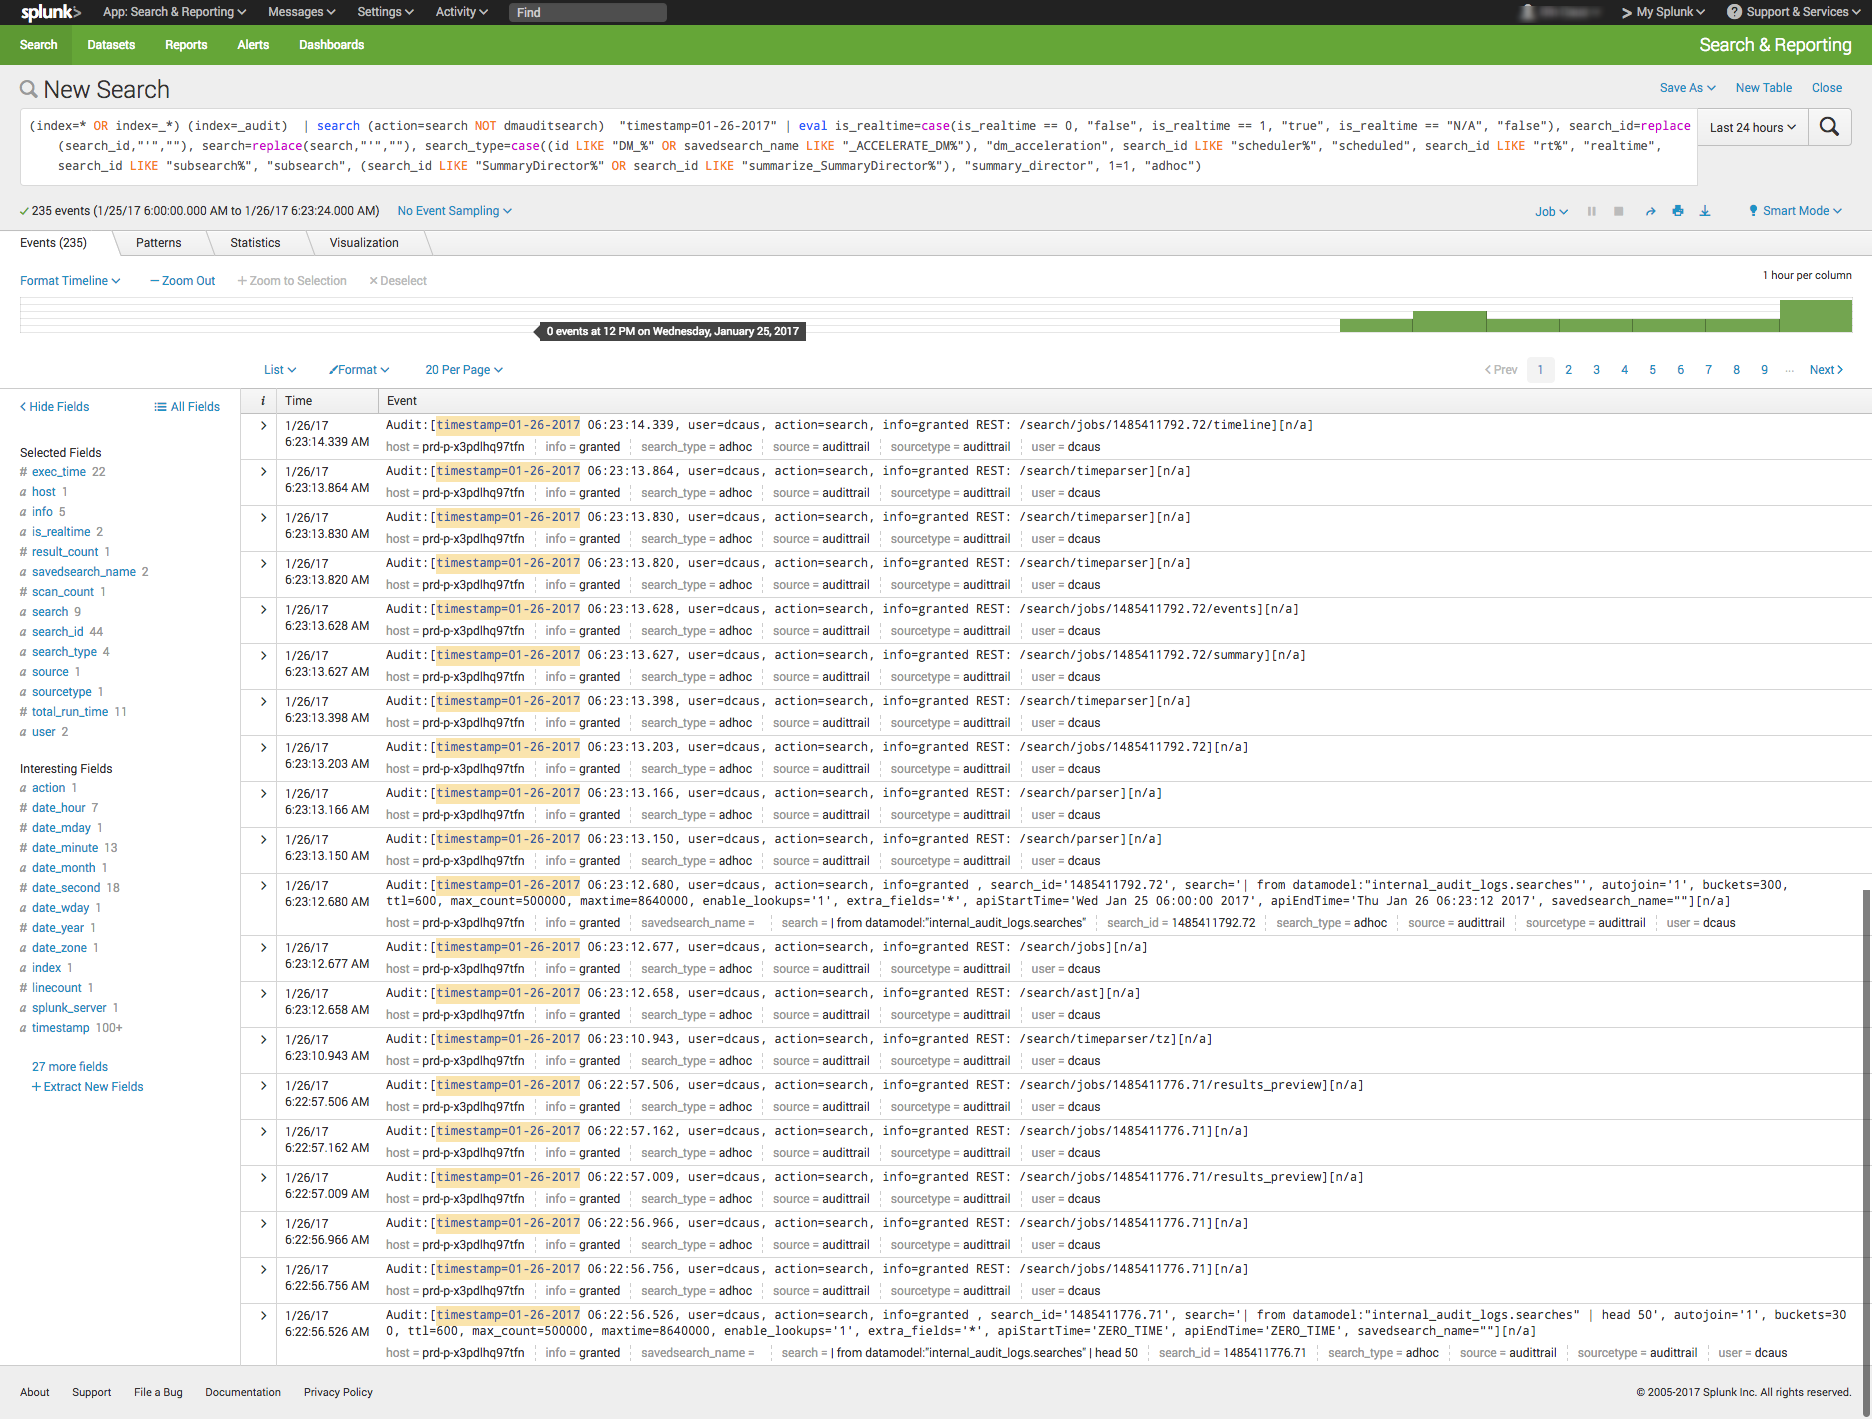
Splunk:
(index=* OR index=_*) (index=_audit) | search ( action=search NOT dmauditsearch ) "06:54"
The difference between SPL syntax and Lucene queries is that SPL supports the search pipeline (as in the example above) in which consecutive commands are chained together using a pipe character that allows the output of one command to be used as the input of the next one. Lucene query syntax is more straightforward and can work to generate the output from the query without additional transforming.
Traction and Community Support
Both Splunk and ELK Stack have large communities of users and supporters. ELK also has its own clear and extensive documentation for each separate tool, making it easy to get started. In addition, Elastic itself offers educational sessions worldwide.
In addition to having good documentation and a forum, Splunk, too, has customer and support platforms that offer various professional services. Splunk’s education program and instructors are available virtually or on site.
The Learning Curve
The ELK Stack’s learning curve is flat for what it’s meant to do. Elastic offers paid courses, but there is a lot of free material online due to the popularity of the open-source platform.
For Splunk, the learning curve is moderate in size, especially when carrying out more specialized analyzes. The company offers a trial period with extensive documentation, but the advanced Splunk educational courses are fairly expensive.
User Management
The ELK Stack provides role-based security as a separate paid tool. Splunk and managed-ELK services offer user management out of the box with user auditing included.
Pricing Levels
As already mentioned, Splunk is proprietary software with a price tag. After one integrates several data sources with the platform, the cost will increase greatly as data is continuously generated.
The open-source ELK Stack is free, but the true picture is not so black and white. The cost of the platform’s hardware and maintenance also adds up. To lower the cost of using ELK, features, plugins and tools must be developed.
Vendor Lock-In
Splunk’s high price tag comes with the benefit of offering an overall, well-rounded product. Users might be locked into a vendor, but that one vendor is all that is needed to do nearly anything. The open-source ELK Stack is seemingly free, but it does not provide many functionalities such as alerting out of the box—and it costs money to develop and maintain them.
Spunk is Splunk. There are many varieties of ELK:
- The open-source ELK Stack platform (Elastic)
- Hosted Elasticsearch (AWS)
- AI-powered ELK on an enterprise-grade platform (Logz.io)
One way to look at the Splunk-versus-ELK discussion is to frame it as the old Microsoft-versus-Linux debate. If you like Microsoft, you will probably prefer Splunk. If you like Linux, you will likely want to use the ELK Stack.
Final Thoughts
When one decides between these solutions, the ultimate choice should reflect not only on the platform but also on the customer’s specific needs.
Both Splunk and the ELK Stack are currently popular. But what might the future hold?

According to Google Trends, the ELK Stack has now overtaken Splunk in terms of the proportion of Google searches. But ELK’s traction does not stop there. As mentioned earlier, Splunk self-reports 12,000 total users. Elasticsearch is reportedly downloaded 500,000 times every single month. In IT departments, then, it is far more likely to meet people who are familiar with ELK than with Splunk, meaning that the adoption rate of the ELK Stack could “snowball” and increase even more in the future whenever ELK users join new companies or teams. People tend to use whatever software they already know or is already being used.
It’s clear that many functionalities are being added to the open-source ELK Stack. This, in turn, is shrinking the gap between it and Splunk. hose features currently found only in Splunk are likely to be added to ELK at some point in time.
So, if a more mature product is what you need, go with Splunk. But if you like a product that is more flexible, ELK is the way. Either way, it’ll be interesting to see how these two continue to compete.
Good read but there are a couple of your comparisons I would like to expound on. As way of introduction I’m formerly an employee of LLNL where I did devops with Splunk.
Splunk’s Search processing language (SPL)
Your analysis is fairly correct in trend that it is its own language, however the learning curve for the language is very short. Moreover the design of the language gives developers like myself the ability to create custom commands. This is invaluable when performing logical manipulation of data rather than statistical. I’ve found the best way to look at Splunk’s Search language is my like to a coding language like python, then to a normal query language.
Final thoughts
I would highly warn against comparing count of customers against number of downloads. One thing that can considerably affect those numbers are release cycles. Splunk typically operates on a quarterly release cycle, where I’ve found that elastic had a much faster cadence.
This leads me to a question I have for anyone reading: for those of you who run on elastic, how is the build quality at release? It do you normally wait for maintenance releases?
Cheers everyone!
Great insight Alex, thanks for commenting!
The fast release cycle of ELK is its weak point IMO. They have investors they need to impress every few months with press releases and shiny video presentations, I get it, but the quality control of the releases is lacking.
The forced interdependence of the major components within ELK land has lead to some disastrous experiences for me. A few months ago I upgraded an ELK stack to implement some Kibana functionality, which meant upgrading Elasticsearch and in turn Logstash. But that release of Logstash had broken some functionality which I needed, I needed an earlier version which wouldn’t talk to my Elasticsearch instance, so that had to be downgraded (and reindexed), but now Kibana wasn’t working properly.
Tl;Dr I ended having to use ELK components which were two years old to get versions that did what I needed and actually talked to each other.
Another point to make is that neither Splunk nor Elastic (ELK for simplicity sake) are silo’d to monitoring which is the only (quote) “same problem” they would address.
Splunk is frequently utilized in cases around compliance and security, particularly network tapping and intrusion prevention, may not even enter the realm of applications.
Elastic is extremely common in the data science community (big data visualization and machine learning feature analysis are common) as well as being a bolt/pipe for streaming data for general compute (the application logic itself), not to mention Elastic being one of the most feature rich and fast site search or enterprise search options on the market.
For the (arguably) very narrow cross section where Splunk and ELK can be compared you’ve likely already made your decision of choosing ELK or Splunk based on their very different broader use cases.
If all you care about is logging, monitoring of those logs, and reporting/visualizations of (again) the logs only – perhaps you’re looking here because you prefer over-engineering just in case you need xyz feature.
If haven’t cared to look at what your business actually needs for a software choice yet and your looking for a panacea, good luck, let me know when you’ve found it and maybe point me in the direction of the holy grail you’ve stashed away last week too. #loveu2
Well, this is just another of the many Splunk vs Elk comparison I’ve already read. Every time I’m always a bit disappointed because I’ve always wanted something more deep and detailed.
Since I’ve been working, developing and teaching Splunk since 2009, I’m a bit more on the Splunk-side, and I recognized you pointed out one of the main ELK failure: the need to know in advance the structure and meaning of the data you’re collecting and sending to Elasticsearch, where instead Splunk doesn’t bother of the semantic of the data. In Splunk you can add knowledge on the data at any further stage, in a collaborative way. This is a great value and capability if you consider the even more emerging case of Splunk not just an IT/Security Tool to collect and analyze IT Data, but as an enterprise wide data repository.
This last feature, the ability to create value even from IT data, is one of the main feature I’ve always pointed out during my classes and when talking about Splunk to prospect Customers. And it’s something I don’t see much in ELK, even if people are often enchanted by some nice Kibana graphs.
Last but noi least, the “app” structure of Splunk (and all it’s echosystem) is something unique you don’t find in ELK that saves you so much time!!!
Marco
Hey mate, you can ingest any data in any structure to Elasticsearch without it being mapped, this blog author knows nothing worth reading.
The only time you map an index in advance with Elasticsearch is if you want specific fields to be treated in a specific way or utilise some feature (like geo) and even when you use a mapping any fields you push are still accepted even if they’re not included in the mapping.
Again, this author is misleading and as you said incomplete
Splunk is dead. The company is in business for over a decade and didn’t succeed to make $1 yet. That’s not a startup anymore, that’s a failed organisation. Their losses are double the size of their sales, increasing their price list isn’t an option. Customers are paying an arm and a leg to this bleeding company to have log analysis that is for free in Elastic. I predict when their funding will dry up they will be picked up on the cheap by IBM or Oracle and nobody will care. Elastic is the only way to go. X-Pack (The new functionality added in Elastic) is the final nail on the coffin of Splunk.
What a completely full of shit troll comment. Splunk’s value is in the flexibility of the product and the support. They spend a lot of money on it, and they make enough of it back to keep investing in it. Is elastic worth 9 billion? The founder and original developer of the product produces webinars by staring awkardly into a camera in what appears to be his wife’s craft room – they have a LONG way to go – and they’ll get there. There are equal and reasonable use cases for both in the same business environment. There’s plenty of room for both to exist and be successful.
As it is almost always happens, new and better technologies make an appearance sooner or later. We have found a hidden gem which we are using for security and ITOPS called X15. Compared to Splunk it’s orders of magnitude more performant on the same identical hardware.
Open source is definitely an important factor, whether we consider the price or the security implications. But performance is also very important, and not many tools can provide high-performance for free. One tool that is available as a free, open source software is NXLog – https://nxlog.co/products/nxlog-community-edition -, which is famous for its high-performance and that it can scale to thousands of servers while keep maintaining its performance too. It’s also multi-platform, so it collects logs from Linux, Windows, Android and more. And does all this for free, since the download is available on its website. It really worth to discuss NXLog as an alternative to the mentioned log management solutions. Great article though, thanks a lot!