Anyone who has leaned on an AI coding agent for a few months knows the pattern. The agent writes confident code, the tests pass, and then a reviewer catches an edge case the agent never considered. The model isn’t lying to you. It just doesn’t know what it doesn’t know, and it has no one in the room to push back.
Microsoft’s latest release of Visual Studio Code, version 1.135, takes a direct swing at that problem. The headline addition is an experimental feature called Rubber Duck, a nod to the old programmer’s trick of explaining your code out loud to a literal rubber duck to catch your own mistakes. VS Code’s version replaces the duck with a second AI model.
Rubber Duck runs inside Copilot agent host sessions. Type /rubber-duck and a different model reviews the primary agent’s plans, code, and tests, looking specifically for gaps the first model may have missed. Microsoft describes it as a way to get “a second opinion from a complementary model on the agent’s work,” aimed at surfacing missed details and edge cases before they become production bugs.
The idea behind putting two different models on the same task isn’t new. Engineering teams have used pair programming and code review for the same reason for decades: a second set of eyes, working from different assumptions, finds different mistakes. Rubber Duck applies that same logic to agentic AI, where a single model working alone can develop blind spots that are hard to catch from inside its own reasoning.
The release doesn’t stop at Rubber Duck. VS Code 1.135 also introduces an Agent Host built on what Microsoft calls the Agent Host Protocol, or AHP. It runs agent harnesses in a dedicated process and lets developers connect to the same agent session from multiple VS Code windows. That matters for anyone who bounces between a laptop and a second monitor, or who wants to check in on a long-running agent task without losing context.
Session continuity gets another boost, too. The Sessions list now shows recently updated agent sessions from outside VS Code, including Copilot or Claude sessions started in other applications, so developers can pick up an agent’s work where they left it rather than starting over. That behavior is tunable through the chat.agentSessions.showExternal setting for teams that want to control how much cross-application activity shows up in the editor.
Microsoft also redesigned the Agents window: a single-pane layout is now the default, with simplified session controls and an overflow menu that keeps the interface from getting cluttered. Session details like changes, pull requests, issues, and artifacts now appear as interactive pills above the chat input instead of being buried in a sidebar, and diff visualization has been cleaned up with a more responsive layout.
For teams watching AI spend, there’s a smaller but practical change: hovering over a chat response footer now shows a per-model breakdown of input, cached input, and output tokens used in that turn. Token consumption has been a bit of a black box for teams running multiple models through Copilot, and this gives platform engineers and finance teams a clearer read on where the usage is going.
Mitch Ashley, VP and practice lead for software lifecycle engineering and AI-native software engineering at The Futurum Group., sees the release as part of a longer arc for the editor itself:
“This is a continuation of the IDE paradigm on its path to an agentic work surface. Once agent sessions run in their own process and persist across windows and applications, the editor becomes the surface on which agent work is directed and reviewed. Rubber Duck answers verification pressure with more generation, and that only goes so far. Watch whether these session protocols stay open enough for teams to run agents from more than one vendor.”
— Mitch Ashley, Futurum Group
That’s a useful check on the enthusiasm. A second model reviewing the first one’s work is still generation, not independent verification, and it’s worth remembering that distinction before treating Rubber Duck’s approval as a stamp of correctness. And Ashley’s question about vendor openness is one to watch as the Agent Host Protocol matures: whether it becomes a genuinely open way to run agents from multiple vendors side by side, or a Microsoft-specific layer that happens to support a couple of outside tools today.
Taken together, these changes suggest where agentic coding tools are heading. The first wave of AI coding assistants was about generating code faster. This release is about building structure around that speed: a built-in critic in Rubber Duck, better visibility into what an agent is doing and costing in the redesigned Agents window, and infrastructure in the Agent Host Protocol that treats agent sessions as something durable and portable rather than tied to a single window or app.
None of this replaces human code review, and Microsoft isn’t positioning it that way. Rubber Duck is explicitly experimental, and a second model catching more edge cases doesn’t guarantee it catches the right ones. But the direction is worth watching. As development teams put more of their day-to-day work in the hands of AI agents, the tooling around those agents needs to mature just as fast as the models do.
VS Code 1.135 is available now through the standard update channel.
Ask an AI coding assistant to summarize a webpage, and you’d expect a summary back. Nothing more. That basic assumption just took a hit, and it says something important about where AI agent security actually stands going into the fall.
Security researcher Johann Rehberger, who publishes under the handle wunderwuzzi at Embrace The Red, found a way to hijack Claude Code running in Opus 5’s Auto Mode using nothing more exotic than a request to summarize a website. No malicious attachment from the user. No obvious red flag in the prompt. Just a normal-looking task that an agent handles a hundred times a day.
Auto Mode became the default way Claude Code runs in mid-August. Instead of stopping to ask permission before every command, it leans on a safety classifier to decide what’s fine to execute on its own. That’s the whole pitch: less friction, more autonomy, an agent that gets on with the work instead of pinging you for approval every few seconds.
Here’s how the attack played out. Claude tried to fetch the target site using its WebFetch tool and received an HTTP 415 (Unsupported Media Type) error. So it fell back to curl instead, a reasonable move for any developer or agent. Curl pulled down a ZIP file the site presented as an archive of notebook records, complete with believable metadata. Inside sat a poisoned file named struct.py, built to shadow Python’s own standard library module of the same name.
Claude did one thing right here. It refused to run a binary decoder bundled in the archive, because executing an unknown binary is an obvious risk. So it wrote its own decoder script instead. That script imported Python’s base64 module, which in turn needed struct. Python first found the attacker’s version in the local working directory and loaded it instead of the real one. That single import was enough to trigger remote code execution and open a callback to a command-and-control server.
Rehberger reports this worked between 60% and 80% of the time across test variants. That’s a hard number to square with Anthropic’s own claim of a 0.00% attack success rate from third-party red-team testing. The gap comes down to scope: that evaluation covered 72 fixed test scenarios, and this particular attack chain wasn’t one of them. It’s a reminder that a clean benchmark result describes the tests you ran, not the attacks nobody’s tried yet.
One more detail stands out. Once Claude realized something had gone wrong and tried to clean up after itself, Auto Mode’s own approval system blocked the cleanup command. The same guardrail that let the malicious code run in the first place also stopped the agent from fixing its own mistake.
Anthropic closed the report as “Informative” rather than treating it as a vulnerability to patch. Its position, as described in Rehberger’s writeup, is that Auto Mode is a best-effort classifier, not a security guarantee, and that determined, multi-step attack chains fall outside what it’s meant to catch. The company’s stated view is that the real boundary has to be OS-level isolation and control over network egress, not a smarter approval prompt.
That framing matters, because agentic tooling isn’t staying confined to a terminal window anymore. Mitch Ashley, VP and practice lead for software lifecycle engineering and AI-native software engineering at The Futurum Group, put it this way: “AI, agents, and early agentic AI are appearing in software organizations beyond developer IDEs and command line tools. We are seeing a rapid rise in vendors releasing AI solutions for planning work, building agents, fixing software issues, AI model flexibility, infrastructure management, and operational monitoring and troubleshooting.” Every one of those integration points inherits the same trust assumptions this attack just picked apart. An agent that can fetch a URL, run a shell command, and write its own code is powerful precisely because it can chain small, ordinary actions together. That’s also exactly what made this exploit work.
None of this means autonomous coding agents are unusable. It means the safety net most teams are counting on is thinner than the marketing around “auto mode” features suggests. The actual fix isn’t a better classifier or a friendlier approval dialog. It’s sandboxing agents in containers or VMs, locking down network egress, and keeping credentials isolated from whatever the agent is running. Those are infrastructure decisions, not settings toggles, and they land squarely on the platform and DevOps teams already building the pipelines these agents plug into.
For anyone rolling out AI coding agents with real system access, this is worth treating as a checklist item rather than a headline to skim past. An approval from Auto Mode indicates the classifier didn’t flag anything. It doesn’t tell you the code is safe. Those two things sound similar. They aren’t the same, and the gap between them is exactly where this attack lived.
GitHub is changing how organizations pay for Copilot, how Copilot chat handles data, and how code reviews run by default. None of these changes are dramatic on their own. Taken together, they signal something bigger: GitHub is treating Copilot less as a feature bundled into a developer’s toolkit and more as enterprise software that requires the same budget controls, data governance, and admin oversight as everything else IT already manages.
For platform teams and engineering leaders, that shift matters more than any single line item.
The most immediate change hits the wallet. Starting September 1, 2026, new Copilot Business and Copilot Enterprise seat assignments will require upfront payment before a user gains access. Existing customers get a little more runway — the same requirement kicks in October 1, 2026. GitHub says pricing itself isn’t changing, and seat revocation still won’t trigger a refund. But the mechanics are different: organizations will be charged for assigned seats at the start of each billing cycle, with additional charges if usage runs past what’s included, and included usage may be prorated monthly. GitHub frames this as an effort to “strengthen account vetting” and improve availability and reliability. Read between the lines, and it also looks like a response to how unpredictable Copilot costs have become since the platform moved to usage-based, token-driven billing back in June. That earlier switch replaced the old premium-request model, where every model interaction consumed a fixed unit regardless of how much it actually cost to run. Under the new system, cost depends on the model and the number of tokens an interaction actually consumes, which is much harder to forecast in a spreadsheet built for flat per-seat pricing. Admins who have gotten comfortable adding and removing seats on the fly will need to rethink how they manage that process, especially at the start of a billing cycle.
The second change is about chat, and it’s the one compliance teams will care about most. GitHub is merging Copilot Cloud Agent, the chat experience on github.com, and GitHub Mobile Chat into a single, unified experience, rolling out no earlier than September 28. That consolidation comes with a policy change buried in the details: chat data, which used to have a 28-day retention limit, will now be kept for the lifetime of the account. That’s a meaningful shift for any organization with data retention policies, audit requirements, or contractual obligations regarding how long AI-generated conversations persist. GitHub is telling business and enterprise admins to review the unified policy and confirm their settings before the rollout, which is really a polite way of saying: don’t get caught flat-footed by a default you didn’t choose.
The third change is smaller but still worth flagging for anyone running Copilot code review at scale. The default review effort level is shifting from “Lite” to “Balanced” across all repositories and organizations, also effective September 28. Teams that want to keep the lighter-touch review behavior will need to explicitly select Lite before the switch happens. It’s a small setting, but it changes the volume and depth of feedback Copilot generates on every pull request — which affects both review time and the number of tokens consumed under the new usage-based billing model.
That’s the connective tissue here, and it’s not lost on analysts watching the AI tooling market. Mitch Ashley, VP and practice lead for software lifecycle engineering and AI-native software engineering at The Futurum Group, put it plainly:
“Charging upfront for seats and metering tokens is how a vendor prices a product whose per-seat value is under pressure while its consumption climbs,” Ashley said. “The governance defaults matter more. Chat retention moving to the life of the account, and code reviews getting deeper by default, are settings that decide both audit exposure and monthly cost. Engineering leaders should assign an owner to those defaults now, before the invoice makes the decision for them.”
None of this should surprise anyone who watched GitHub retire premium-request billing in favor of token-based pricing earlier this year. That move alone caused plenty of budget headaches for teams that hadn’t built AI spend into their forecasting, and it wasn’t unique to GitHub — most vendors selling agentic AI tools have run into the same problem as usage shifts from predictable seat licensing to variable, consumption-based pricing.
Ashley’s advice points to a calendar, not just a mindset. Whoever owns Copilot administration should review the new billing cycle mechanics before October 1, loop in data governance before the chat consolidation lands September 28, and decide deliberately whether Balanced or Lite code review fits how their teams actually work — rather than letting the default decide for them.
Copilot adoption has moved fast inside most engineering organizations over the past two years. Governance and cost controls are only now catching up. That catch-up process is going to keep producing changes like this one — not flashy new features, but the unglamorous plumbing of accounts, billing cycles, and data retention that determines whether an AI tool scales cleanly or turns into a budget surprise. Organizations that get ahead of these settings now will spend a lot less time explaining an unexpected invoice or a policy gap later.
Enterprise AI agents need more than stronger models. They need durable execution environments that can coordinate multi-step workflows, survive failures, pause for human review and resume reliably after disconnects or delays.
AI Agents Have Moved Beyond Chat Demos
AI agents work beautifully in demos. A user asks a question, a large language model generates a response and everyone sees possibility. Production systems are different.
Consider what these systems are now asked to do. An agent assessing a change request may pull deployment history, evaluate blast radius, check freeze-window policy, wait for a release manager’s sign-off and then schedule the rollout. An agent adjudicating an insurance claim may extract fields from submitted documents, cross-check them against prior claims, apply underwriting rules and route anything unusual to a human adjuster. An agent triaging a security alert may enrich indicators, correlate against past incidents, assess asset criticality and hold containment until an analyst approves it.
Those three workflows have almost nothing in common at the domain level. They share a shape: Multiple steps, several systems, independent failure modes and at least one point where a person decides. They take minutes or hours, not milliseconds.
The challenge is no longer only intelligence; it is execution. Many enterprise AI conversations focus on model selection, prompt engineering, retrieval-augmented generation and tool calling. Those are important, but they do not answer what happens after the agent begins executing long-running work across multiple systems.
The Problem: Most Agents Are Still Designed Like Request-Response Applications
Traditional AI applications assume a simple request-response model: User input goes in; a model response comes out. That model works well for Q&A, summarization, content generation and search-like experiences.
Enterprise workflows are different. A procurement review agent might parse a contract, compare its terms against a standard template, check vendor risk ratings, invoke a sanctions screening service and produce a recommendation. These steps may execute independently, fail independently and complete at different times.
Once an agent crosses the boundary from answering a question to executing a process, it starts to look less like a chatbot and more like a distributed system. It needs state, retries, coordination, observability and recovery.
Why Stateless APIs Break Down
Teams often start by implementing an agent as a synchronous API. That approach works until the first real workflow appears. What happens if the HTTP request times out? What if the user closes the browser? What if an external system is unavailable? What if a human approval arrives six hours later?
A stateless API can initiate work, but it is a poor place to manage long-running state. Developers quickly end up building custom queues, status tables, retry logic, compensation logic and ad hoc workflow tracking. The hidden cost is not the first prototype; it is operating the system after it begins handling real workloads.
The missing layer is a durable runtime: A workflow engine that can preserve progress, coordinate parallel work, wait for external events and resume execution reliably.
Figure 1: The Same Multi-Step Workflow Under Two Runtimes
A stateless service holds progress in process memory, so a host failure discards completed work and the retry begins again from the first step. A durable runtime checkpoints each completed activity, so a replacement worker replays the history and continues from where execution stopped.
The Key Design Shift: the Workflow is the Application
The most important design shift is this: The model is not the application. The workflow is the application. The model is one activity inside a larger execution graph.
In production-grade agentic systems, the orchestrator coordinates work while specialized agents perform specific tasks. The specialization is domain-specific, but the division of labor recurs: One agent gathers and enriches raw signal, another retrieves reference material, another looks for precedent among prior cases and another evaluates policy or risk conditions.
This design makes the system easier to reason about. Each agent has a focused responsibility, and the orchestration layer owns execution flow, state, retries, progress and human interaction.
Using Durable Orchestration as the Agent Runtime
A practical architecture places a durable orchestrator between the calling application and the AI execution layer. The caller starts the workflow and immediately receives an instance identifier. The orchestrator then coordinates specialized agents and records progress as the workflow advances.
Azure Durable Functions is a strong fit for this pattern because it supports stateful workflows, activity functions, external events, checkpointing and long-running orchestration. Azure AI Foundry can provide the model and agent execution layer, while Durable Functions handles the operational execution semantics around the agent.
The result is a cleaner separation: AI services reason; activity functions perform work; the durable orchestrator governs the process.
Figure 2: The Orchestrator Between the Calling Application and the Reasoning Layer
It owns sequencing, retries, timers and external events. Specialized agents run on the model layer with narrowly scoped access and every completed activity is checkpointed so the workflow can be rebuilt after a failure or a process restart.
Fan-Out/Fan-In Maps Naturally to Multi-Agent Systems
These investigations are rarely one sequential task. Many subtasks can run independently. Enrichment, reference retrieval, precedent search and policy evaluation usually have no dependency on one another, so they can execute in parallel. This is where fan-out/fan-in becomes a natural orchestration pattern.
The orchestrator fans out work to specialized agents, waits for them to complete, and then fans in the results to generate a synthesized recommendation. This pattern improves latency while keeping the workflow easier to understand than a large monolithic agent prompt.
The fan-in step is also where engineering judgment matters. The system should handle partial results, conflicting findings and low-confidence recommendations rather than assuming every agent will succeed perfectly every time.
Example Orchestration Sketch: The sketch below triages a security alert; the domain is incidental. Rename the activities and the same orchestration serves claims adjudication or change-risk review.
Three details in that sketch are worth calling out. The external event is raced against a durable timer, so an approval that never arrives escalates instead of leaving the instance parked indefinitely. The timer is then cancelled on the success path, because a durable timer that is neither cancelled nor allowed to expire keeps the instance in the Running state long after the orchestrator function has returned. Since Task.WhenAll surfaces the first exception it encounters, genuine partial-success handling means having each activity return a typed failure result rather than throwing it once its retries are exhausted.
Human-in-the-Loop is Not an Edge Case
In regulated and high-impact workflows, human review is part of the process by design. A payment exception above a threshold, a production change during a freeze window, a claim falling outside underwriting rules: None of these should be finalized automatically when confidence is low or the consequences of being wrong are large. The important thing is to make human review part of the workflow rather than a side channel.
A durable orchestration can pause while waiting for a review event, then resume when the approver submits a decision. The system does not need to keep an HTTP request open or hold compute resources while waiting. The workflow state remains available, and the final recommendation can include the reviewer’s context.
This capability is especially important because the slowest step in a production workflow is often not the model call. It is the human decision, the external dependency or the operational handoff.
Figure 3: One Instance Over Time
Parallel agents make wall-clock cost the slowest agent rather than the sum of all of them; a failed agent degrades the result instead of failing the run, and the review window consumes no compute because the orchestration is parked rather than blocked.
Operational Considerations Matter as Much as Prompts
A durable runtime does not remove the need for engineering discipline. It makes that discipline easier to apply. Production-grade agents still need observability, correlation identifiers, retry policies, cost controls, security boundaries and careful versioning.
Workflow telemetry should answer questions such as: Which stage is running? Which activity failed? How many retries occurred? How long did human review take? What evidence supported the final recommendation? These are operational questions, not prompt engineering questions.
Retries should be designed around external dependencies such as AI model calls, search systems, databases and APIs. At the same time, not every failure should fail the entire workflow. Multi-agent systems should be designed for partial success where appropriate. If the precedent agent fails but enrichment and retrieval succeed, the system may still produce a useful recommendation with clear caveats.
Three constraints tend to surface only once a workflow reaches production. Orchestrator code has to stay deterministic, because recovery works by replaying it: Wall-clock reads, random values, fresh identifiers and direct I/O belong in activities, not in the orchestrator. Every wait needs a deadline, else an approval that never arrives becomes an instance nobody ever looks at again. Versioning deserves a decision before the first production deploy because long-running instances guarantee that new orchestrator code will ship while old instances are still in flight.
Security and Governance Cannot Be Bolted on Later
AI agents often sit at the crossroads of sensitive enterprise data, operational tooling and user-facing experiences. That makes security and governance foundational design concerns.
Each specialized agent should receive only the access necessary for its responsibility. A retrieval agent may need the document corpus and nothing else. An enrichment agent may need read access to telemetry. The agent that composes the final decision may need only summarized evidence, never the raw sources behind it. Avoid creating one over-permissioned super-agent that can reach everything.
Prompts and outputs should also be auditable. Store workflow version, prompt version, model deployment, agent version, evidence references and correlation identifiers. As agents become part of operational decision-making, teams need to explain not only what the system recommended but why it recommended it.
Figure 4: Scoping Access per Agent Contains the Blast Radius
A single agent holding every credential turns one poisoned input into estate-wide exposure, while narrowly scoped agents limit any single compromise to one agent’s data, with the synthesis step working from summarized evidence.
What This Means for DevOps and Platform Engineering Teams
The future of enterprise AI is not just better prompts. It is reliable execution. As agents become responsible for operational workflows, DevOps and platform engineering teams will need to provide runtime capabilities similar to those used in distributed systems: Orchestration, observability, resiliency, governance and deployment discipline.
This resembles the evolution of microservices. Early conversations focused on APIs. Later, the industry learned that production systems also require service discovery, telemetry, deployment strategies, circuit breakers and operational practices. AI agents are entering a similar phase.
Organizations that treat agents as production workflows rather than chat interfaces will be better positioned to build systems that users trust.
Conclusion
Most enterprises already have access to powerful foundation models. The harder challenge is building systems that can execute reliably when work spans minutes, hours, tools, services and human decisions.
Long-running agents of any kind need a durable execution layer. They need to coordinate multiple specialized agents, survive transient failures, pause for human review, provide progress visibility and generate auditable outcomes.
Azure Durable Functions and Azure AI Foundry offer one practical way to approach this architecture: Durable Functions provides orchestration and stateful execution, while Azure AI Foundry provides the intelligence layer. The broader lesson applies beyond any specific platform: Production AI agents need durable runtimes. Intelligence is only half of the system. Execution is the other half.
Ask a platform engineer how much of their Terraform, Kubernetes manifests or CI/CD YAML was drafted with an AI assistant, and the honest answer is usually “most of it.” Ask the same engineer how much of that code was security-reviewed before it shipped, and the answer gets quieter. This gap — between how fast AI writes infrastructure and how carefully anyone checks it — is no longer a theoretical risk. It’s showing up in production, in audits and now in a growing public CVE record.
This isn’t about whether AI coding assistants are good or bad. They’re clearly useful, and they’re not going away. It’s about a specific, measurable failure mode that most CI/CD pipelines were never designed to catch, and what it takes to close that gap without slowing teams down to a crawl.
The Numbers Are Worse for Infrastructure Than for Application Code
IOActive’s April 2026 whitepaper, The Security Gap in AI-Generated Code, is the most rigorous test of this to date: 27 leading AI models, 730 real-world prompts spanning 27 languages, evaluated by 72 automated vulnerability detectors against roughly 20,000 generated code samples. The prompts deliberately didn’t mention security, because most developers don’t ask for it either. They just ask for working code, and that’s what they receive.
The topline finding was bad enough on its own: Average security performance across all models came in at 59%, and nearly a third of generated samples were fully exploitable. Not one model configuration tested clean — even the best-performing setup produced 90 distinct vulnerabilities across the sample set.
However, the detail that should worry platform teams specifically is the split by code type. Deployment infrastructure — containers, CI/CD configuration, serverless definitions — came back 57.5% vulnerable on average, noticeably worse than general application code. Dockerfiles were the single worst-performing artifact type in the entire study, with close to universal failure. IOActive’s researchers offer a plausible explanation: AI training data appears skewed toward application-code examples, leaving infrastructure as code (IaC) as a genuine blind spot in what these models learned to write safely. Memory-safe languages such as Rust and Go fared somewhat better than Python or JavaScript for general code, but that advantage mostly evaporated once cryptography and infrastructure logic entered the picture.
This isn’t an outlier finding from one lab. Veracode’s Spring 2026 GenAI Code Security Update, testing over 100 large language models across SQL injection, cross-site scripting, log injection and insecure cryptography, found that only about 55% of AI code-generation tasks produced secure code out of the box — a number that has barely moved in two years, even as syntax correctness climbed past 95% over the same period. Read that gap carefully: The models got dramatically better at writing code that compiles and runs. They did not get meaningfully better at writing code that’s safe to run. That’s the entire problem in one sentence.
From Lab Benchmark to Public CVE
Benchmarks tell you what a model is capable of getting wrong under test conditions. They don’t tell you what’s actually breaking in production. For that, there’s a live tracker worth paying attention to.
In May 2025, Georgia Tech’s Systems Software & Security Lab launched a project called Vibe Security Radar, run by researcher Hanqing Zhao, to answer a narrower and harder question than any lab benchmark: Not what AI models might produce, but what they have actually produced in software running in the real world. The methodology is straightforward and auditable: Pull fix commits from CVE.org, the National Vulnerability Database, the GitHub Advisory Database and OSV; trace each one back through Git history to find the commit that introduced the bug, then check that commit for an AI tool’s fingerprint — a co-author tag, a bot email address, a known tool signature. Where metadata alone isn’t conclusive, the team uses AI agents with direct access to the repository history to investigate causality rather than rely on pattern-matching.
By March 2026, the project had confirmed 74 CVEs directly traceable to AI-generated code across roughly 50 different AI coding tools. The trend line is the part that should get attention in a platform engineering context: Six confirmed cases in January 2026, 15 in February, 35 in March alone — more new AI-attributed CVEs in that single month than the project had confirmed across the second half of 2025. Zhao is explicit that this is a floor, not a ceiling: A large share of AI-assisted commits simply lack the metadata trail needed to trace them back to their origin, so the actual number of AI-linked vulnerabilities across the broader open-source ecosystem is likely 5–10 times higher than what’s currently confirmed.
Separately, security firm Wiz’s scan of thousands of AI-assisted (vibe-coded) applications turned up a related but distinct problem: Exposed secrets and credentials baked directly into shipped code and configuration, at a scale that suggests this isn’t a handful of careless teams; it’s a systemic pattern in how these tools get used day to day.
Design Your Pipeline Like the AI is a New Hire, Not a Senior Engineer
For years, shift security left meant getting static analysis into the developer’s IDE and the pull request, on the assumption that a human was making most of the meaningful design decisions and an AI tool was, at most, autocompleting a line or two. That assumption no longer holds. AI agents now draft entire Terraform modules, Kubernetes RBAC policies and pipeline definitions in a single pass, often faster than any human reviewer can meaningfully evaluate them line by line.
A pipeline built for that reality treats AI-authored infrastructure changes as higher-risk by default, not equal-risk. In practice, that means routing them through more automated scrutiny before a human ever sees them:
Terraform validate/helm lint (Does it actually parse correctly?)
│
▼
IaC misconfiguration scan (Checkov, tfsec or equivalent)
│
▼
Container/dependency scan (Trivy or equivalent)
│
▼
Policy as code check (OPA/Conftest — org-specific rules)
│
▼
Secret scanning (TruffleHog or equivalent)
│
▼
Provenance-flagged human review
│
▼
Merge → Deploy
The specific tools matter less than the shape of the pipeline: AI-authored infrastructure changes should pass through more automated gates than a routine change, not the same gates as everything else. A minimal GitHub Actions implementation of the scanning stages looks like this:
name: infra-security-gate
on:
pull_request:
paths:
– ‘**/*.tf’
– ‘**/Dockerfile’
– ‘.github/workflows/**’
jobs:
scan:
runs-on: ubuntu-latest
steps:
– uses: actions/checkout@v4
– name: Validate Terraform syntax
run: terraform validate
– name: Scan IaC for misconfigurations
uses: bridgecrewio/checkov-action@master
with:
directory: .
soft_fail: false
– name: Scan container images and dependencies
uses: aquasecurity/trivy-action@master
with:
scan-type: ‘fs’
severity: ‘CRITICAL,HIGH’
exit-code: ‘1’
– name: Check org policy compliance
uses: open-policy-agent/conftest-action@main
with:
policy: ./policy
files: ‘**/*.tf’
– name: Scan for exposed secrets
uses: trufflesecurity/trufflehog@main
with:
extra_args: –fail
None of this is exotic; it’s the same category of gate most teams already run for application code. The point is making sure infrastructure code gets it too, and that AI-authored changes specifically can’t skip the line.
A Maturity Model for Governing AI-Generated Infrastructure
Most platform teams already sit somewhere on this ladder, whether they’ve named it or not:
Level 1 — Manual Trust: AI writes infrastructure code; a human reviews it the same way they’d review any other pull request, with no special handling for the fact that an AI drafted it. This is where most teams are today, and it’s the least defensible position given what the IOActive and Veracode data show about baseline secure-output rates.
Level 2 — Automated Gates: IaC scanners, container scanners and secret detection run against every infrastructure change, AI-authored or not, before it can merge. This catches the mechanical failures — the exposed credential, the wide-open security group, the missing resource limit — without depending entirely on a reviewer’s attention span.
Level 3 — Provenance Tracking: AI-drafted changes are explicitly tagged through commit metadata, PR labels or CI checks, and routed to reviewers who know beforehand that this specific change needs closer scrutiny than a hand-written one. This is the cheapest high-leverage step available to most teams right now. It doesn’t require new tooling, just discipline about tagging and routing.
Level 4 — Continuous Infrastructure Security Scoring: Infrastructure code carries a security score that updates as models, prompts, scanners and organizational policy evolve, rather than a one-time pass/fail gate at merge time. Very few organizations are here yet, and it’s not necessary for most teams in 2026 — but it’s the direction the tooling ecosystem is heading as AI-authored infrastructure becomes the default rather than the exception.
Most teams reading this are at Level 1 or 2. Given where the CVE trendline is heading, Level 3 is the realistic near-term target: It costs little to implement, requires no new vendor relationship and converts “we hope someone reviews this carefully” into “we know this specific change needs careful review” — which is a meaningfully different guarantee.
What to Do This Week
Tag pull requests containing AI-drafted Terraform, Helm charts, Dockerfiles or pipeline YAML, so they route differently than routine changes.
Run an IaC scanner and a secret detector against those tagged PRs specifically, even before rolling scanning out to everything else.
Set AI agent tokens and service accounts to read-only by default. Widen access only through a deliberate, logged decision — never as the starting position.
Revisit these controls quarterly. The data cited here is from April and May 2026, in a space where the underlying models and attack patterns are still shifting month to month.
None of this is an argument against using AI to write infrastructure code — the productivity case is real and isn’t going anywhere. It’s an argument for treating AI-authored infrastructure the way any competent team already treats a change from a new engineer in their first week on the job: Often correct, genuinely useful and never trusted into production without someone who understands exactly what a broken IAM policy or an exposed secret actually costs. The next phase of platform engineering won’t be defined by how fast AI can generate infrastructure. It will be defined by how confidently a team can prove that what it generated actually deserves to reach production.
Platform and DevOps teams spent a decade learning to manage cloud as a variable cost. Metered usage, spiky demand, spend spread across services and teams, and a whole FinOps discipline built to bring it under control. That hard-won muscle is about to be tested by something that looks a lot like cloud but is not being treated like it: the cost of AI coding assistants.
For most of the SaaS era, developer tools were a fixed line item. You multiplied a per-seat price by headcount, and you had a budget. Over the past year, the major AI coding assistants moved off that model. Billing now runs on tokens, requests, or credits, with premium models and agentic features drawing down a metered pool. GitHub Copilot, for example, shifted to usage-based billing in mid-2026, pricing premium usage against credits. The result is that two engineers on the same plan can generate very different costs depending on the models they pick and how heavily they use agents. Seat count no longer predicts spend.
If that sounds familiar, it should. This is the cloud cost curve arriving in the developer tools budget, and most organizations are meeting it with a per-seat SaaS mental model.
Why it Behaves Like a Cloud Bill
Three properties make AI coding spend behave like infrastructure rather than a subscription.
It is usage-metered. The meter runs on what developers actually do, not on how many of them there are. Idle seats cost little, heavy users cost a lot, and the distribution is rarely even.
It is spiky and model-sensitive. The cost of an identical task can vary by more than twenty times depending on which model handles it. A routine change routed to a frontier model, or an agent left in an always-on high-effort mode, costs many times what a capable smaller model would. Spend can climb sharply with no new seats at all, driven entirely by a drift toward premium models on ordinary work.
It is multi-vendor. Teams rarely standardize on one assistant. They use several, the tools overlap, and each vendor can only meter its own slice. No single vendor dashboard can tell you a developer’s true combined cost, and because vendors do not even define a “user” consistently, you cannot naively add the dashboards together.
Usage-metered, spiky, multi-vendor. That is a cloud bill, and it deserves the same discipline.
FinOps, Pointed at the AI Coding Stack
The FinOps Foundation has begun treating FinOps for AI as its own area, spanning allocation, forecasting, optimization, and governance. AI coding assistants are the sharpest edge of that shift, because the spend sits inside engineering, moves fast, and is bought in a decentralized way. The good news for platform teams is that the FinOps lifecycle you already know applies almost directly.
Inform. Before you optimize anything, make the spend visible. That means cost per developer across every tool, not one vendor’s view, plus utilization of the seats you pay for and the share of usage going to premium models. Visibility first is not a nicety; it is what earns you the right to change behavior later.
Optimize. The two highest-yield levers are rarely “buy fewer seats.” They are reclaiming idle assignments and correcting model-mix drift, premium models used for work a smaller model would handle just as well. Both are invisible until you instrument them, and both are recoverable without slowing anyone down.
Operate. Stop managing from the invoice, which is a report on money already spent. Usage-based spend is forecastable because it is usage-based. A trailing burn rate against a remaining credit pool tells you the date it runs dry and the projected overage if nothing changes, in time to act.
What Platform Teams Should Instrument
If you own this problem, four numbers carry most of the signal, and each points at a decision.
Cost per developer, computed across every tool and normalized to a consistent definition of a user. This is the number leadership will ask for and the one that makes team comparisons fair.
Utilization, active versus assigned seats. Idle assignments are the simplest waste to find and the easiest to defend cutting.
Premium-model mix, the share of usage going to the most expensive models. This is your early-warning signal, and it moves before the bill does.
Forecast versus budget, where this quarter is heading at the current run rate. This is what turns a surprise into a plan.
Deliberately not on that list: acceptance rate and raw token counts. They are easy to collect and nearly useless for cost decisions, because they reward volume rather than value and say nothing about what actually shipped.
The Near-Term Test
There is a concrete deadline that will expose who has done this work. Several vendors ran promotional credits through the summer of 2026 that quietly subsidized real usage. As those promotions expire, teams whose behavior has not changed will see their true baseline for the first time, in some cases tens of dollars per user per month higher than they had planned around. The spend did not jump. The subsidy ended, and the meter was always running.
Teams that instrumented cost per developer, watched their premium-model mix, and forecast their pool will have seen this coming and adjusted. Teams still budgeting seats times price will find out from the invoice.
Govern With Awareness, Not Caps
The last temptation is the hard cap: give every engineer a fixed monthly limit and call it solved. It is not. A flat cap throttles your highest-leverage developers, treats heavy legitimate use the same as waste, and does nothing about the actual leaks, which are misrouted models and idle seats.
The higher-leverage move is awareness. When engineers can see the cost consequence of their own choices, close to the moment they make them, behavior shifts on its own. “This task went to a frontier model; a smaller one would have cost a fraction” is a nudge that changes the next decision. A cap only changes behavior at the boundary, and usually the wrong behavior. Governance done well is two-sided: leaders get the aggregate forecast and the levers; engineers get a quiet signal about their own impact.
The Takeaway for DevOps and Platform Leaders
You already know how to manage a variable, metered, multi-source cost. You did it with cloud. AI coding spend is the same shape arriving in a new place, and the organizations that get surprised by it are not spending recklessly. They are managing a cloud-shaped cost with a SaaS-shaped budget. Point your existing FinOps instincts at the AI coding stack, instrument the four numbers, forecast the pool, and make engineers cost-aware, and the curve stops being hidden.
If you have ever tried to keep more than a handful of Jenkins instances healthy at the same time, you already know the problem: every master drifts a little differently. Plugins fall out of sync, storage quietly fills up, one team’s “quick fix” becomes another team’s outage, and nobody has a single view of what is actually running across the organization. Multiply that by 150+ instances spread across on-premise data centers and multiple clouds, and manual administration stops being an option. That was the starting point for a project we shipped in three phases over about 20 months: a centralized UI and automation layer that gives platform teams one place to upgrade, back up, roll back, monitor and manage access for every Jenkins instance in the company — without each team having to become Jenkins administrators themselves.
Why Centralization Was Overdue
Jenkins is famously easy to stand up and famously easy to let sprawl. As the instance count grew past the point where any one person could reason about the whole fleet, a handful of recurring pain points kept surfacing: inconsistent plugin versions that broke pipelines after ad-hoc upgrades, backups that existed on some masters and not others, no unified alerting when an instance ran low on disk or memory, and job configurations — especially non-lightweight checkouts — quietly burning far more compute than they needed to. None of these problems are exotic. What made them expensive was scale: a fix that takes ten minutes on one instance takes days when it has to be repeated, inconsistently, across 150 of them.
Architecture: A Control Plane, Not a Bigger Script
Rather than writing a longer shell script, we designed the system as a proper control plane. The frontend is a React and Redux dashboard with Material-UI components, talking to a Python backend split across Flask and FastAPI for synchronous admin actions and real-time data syncing. Underneath that sits the part that does the actual work: idempotent Ansible playbooks for upgrades and backups, Kubernetes and Helm for dynamic Jenkins agent provisioning, and ArgoCD driving GitOps-style rollouts across AWS and Azure. Observability runs through Prometheus and Grafana for metrics and the ELK stack for log aggregation and alerting, so the dashboard is showing live fleet health rather than a static inventory.
Figure 1 — The centralized control plane layered above the Jenkins fleet.
Idempotency turned out to matter more than almost anything else in the design. Because playbooks can be re-run safely, rollbacks stopped being a stressful, manual scramble and became a predictable, repeatable action — which is what let us expose a “self-service” layer to teams instead of routing every request through a platform engineer.
What the Dashboard Actually Does
● One-click upgrades and rollbacks, executed as idempotent Ansible plays across any subset of instances
● Differential backups to S3-compatible storage via rsync, scheduled centrally instead of per-instance
● Dynamic slave/agent provisioning through Kubernetes Helm charts, scaling capacity to actual job demand
● Centralized alerting for downtime, storage, CPU and memory thresholds via Prometheus and ELK
● Advanced job reporting: failed jobs, unused jobs, non-lightweight checkouts and high-resource jobs, surfaced so teams can fix their own inefficiencies
● Org-wide access management and audit logging, supporting SOC 2 and GDPR requirements
● A self-service portal so application teams can perform routine tasks without filing a platform ticket
Process and the Hard Parts
We ran this as a standard Agile delivery: bi-weekly sprints, daily stand-ups, and the usual Scrum ceremonies, starting with stakeholder interviews and Figma wireframes before any backend code was written. Integration testing simulated the full 150+ instance fleet in Docker and Kubernetes before anything touched production, and the test suite combined Jest for unit tests, Cypress for end-to-end UI coverage and Locust for load testing under concurrent fleet-wide operations. The genuinely hard problems were not the individual integrations — they were the seams between them. Keeping the dashboard’s view of fleet state synchronized in real time without introducing lag took several iterations of the polling and event model. Rollbacks needed to guarantee data consistency even mid-failure, which is what pushed us toward strictly idempotent playbooks. And because the fleet spanned on-premises hardware alongside AWS and Azure, we ended up writing custom adapters just to give every environment a consistent interface to the control plane.
Results
The clearest way to describe the payoff is in the numbers teams saw after rollout: significantly lower administrative overhead, a meaningful cut in infrastructure spend from better resource allocation and less downtime, and a large drop in time engineers spent on manual Jenkins upkeep — time that went back into actual product work.
Figure 2 — Reported reductions in overhead, infrastructure spend and manual task time following full rollout.
What’s Next
This kind of fleet-wide control plane is not a novel idea on its own — there is a long history of tools for orchestrating multiple Jenkins instances. What made the difference here was combining self-service automation with genuinely actionable job reporting, so that the platform team’s job shifted from firefighting individual instances to setting guardrails the rest of the organization could operate within safely. The next phase looks at predictive resource scaling and extending the same self-service model to non-Jenkins CI/CD tooling as the organization’s pipeline mix diversifies.
The most expensive mistake teams are making with AI agents right now is treating them as microservices with a language model bolted on. The approach is understandable; microservices are the architecture most platform engineers know best, agents feel like services that happen to think, and the migration path looks familiar. But the analogy only holds long enough to lead you somewhere painful.
Microservices changed how software gets built. The idea was to help teams work independently, ship faster and scale efficiently. In those days, shipping software meant one giant codebase compiled together, tested together and released on 12- or 18-month cycles. Then the cloud came along, and teams needed to ship in weeks or days. The only way to do it was to split systems apart and let each piece move on its own schedule.
It worked, but the systems underneath stayed simple in one crucial way: they were deterministic. Distributed systems are hard, but the behavior was predictable. A service received a call and returned a result, and when it failed, it failed in milliseconds and threw an error you could see.
That is the assumption agents break. An agent workflow can run for hours or days, touch a dozen systems, and make a non-deterministic decision at step three that you don’t discover was wrong until step forty. Nothing threw an error, nothing lit up red on a dashboard; the process just quietly went the wrong way and kept going. Where a broken microservice pages you, a misbehaving agent sends a confident, wrong result and moves on.
This is why the microservices playbook both applies and doesn’t, and why “agents are just distributed services” is a trap. Agents do certainly build on microservice foundations, and many of the era’s lessons carry straight over. But the practices that were optional when systems were deterministic and short-lived are now mandatory, and even the ones that carry over don’t carry over cleanly. Treat agentic AI as just another microservice, and you’re making an architectural bet that will come due in the next 12 to 18 months.
Here are the lessons the agent era rewrites, and the ones it simply reinforces.
The Lessons That Get Rewritten
1. Durable execution stops being a pattern and becomes the runtime. This is the primary one, and it’s where the microservices instinct fails quietly. In a deterministic world, you could add resilience later, layering retries and queues around services that mostly completed on their own; the process finishing was the default, and durability was just another pattern. That default is gone. When an agent workflow fails five steps into a multi-day run, detecting that something broke is often harder than recovering once you know, and the resilience you meant to add later never gets added. It has to be part of the runtime from the start.
But here’s the part teams miss: it is not the same durability. The durable execution engines built for the microservices era assumed high concurrency and millisecond steps, payment flows, order processing, thousands of shorter workflows multiplexed per worker and agents violate every one of those assumptions. A single step might be a 45-second model call. Another might pause for hours while it waits on a human, and during that wait the process should be able to die and resume cleanly later, because nobody cares whether the resume takes seventeen milliseconds or two seconds. You cannot even replay a step and expect the same result, because the step is non-deterministic by nature. So the answer isn’t to adopt the durability you skipped; it’s that the durability layer itself has to be rebuilt for a workload it was never designed to carry.
2. Security and governance need a new model, not a stronger boundary. Microservices pushed authentication to the edge, a fence around the building that worked when the actors inside were fixed services you deployed. Agents can start other agents at runtime, which raises questions the boundary model simply can’t answer. Does the sub-agent inherit the same permissions? How do you trace what it did on your behalf three steps later? The model that fits is less a fence and more a series of locked doors, each requiring its own credential, with identity and cryptographic attestation following every step of every workflow, so you can prove not just who called, but what acted and what it was allowed to do. Most teams are still guarding the front door of a building that now rearranges its own rooms.
3. Observability has to reach every step, not just the endpoint. Operators need to retain control, and non-determinism makes that harder than it ever was for microservices. When something breaks in a 100-step workflow, an operator needs to see exactly where it broke and why, not just that it failed. Typically, a status indicator on a dashboard was enough when a service either returned or errored, but it is useless when the failure is a plausible-looking wrong turn ten steps back. Distributed tracing was essential for microservices. With agents, you’re no longer debugging whether a call succeeded; you are reconstructing why an autonomous system made the choice it did. That demands full visibility into every step an agent takes, as a first-class property of the platform rather than a log you grep after the fact. It’s the difference between the application performance monitoring (APM) tools of the microservices era and LLM observability tools in the agentic era.
These Three Demands Have a Name
Treated separately, recovery, per-step identity, and per-step visibility look like three infrastructure projects competing; they aren’t. They’re three faces of one capability the agent era requires, and it’s worth naming, because you can’t build toward something you can’t name.
Call it agentic durable execution: a runtime that automatically recovers from failures, carries autonomous AI agents and deterministic workflows to completion, and provides cryptographic, tamper-proof evidence of what happened. The first two answer the durability problem: the process finishes, while the third answers governance and observability. In a non-deterministic system, proving what an agent did and being able to see and trust it are the same requirement. It is not a feature you add to an agent framework; it is the layer the framework should be standing on.
The Lessons That Carry Straight Over
These three lessons didn’t change. They just matter more, because the cost of ignoring them is higher.
4. Complexity still demands a platform. Around 2010, most teams were stitching together virtual machines with Chef and Puppet, trying to build something that resembled a distributed application. Kubernetes won because it gave teams a platform layer that absorbed that complexity instead of asking every team to rebuild it. The same pattern is repeating now, as every organization races to stitch together agent frameworks and rebuild infrastructure a platform should already provide. The stakes are just higher this time, because the failures are harder to see coming.
5. Vendor lock-in is still costly. Committing to a single cloud provider’s agentic stack seems efficient until that provider has a regional outage and stalls every dependent workflow, and data sovereignty rules, especially across the EU, only add more pressure to a single-cloud strategy. The microservices lesson holds: architecture decisions made for short-term convenience almost always turn into long-term constraints.
6. Open standards still win the long game. The cloud-native projects that lasted, Kubernetes chief among them, were built in the open and governed by communities rather than single vendors, which is why they worked across environments instead of locking teams in. The agent world is already showing the same trait, with standards for how agents communicate and authenticate emerging through open governance rather than proprietary roadmaps. Betting against openness didn’t pay off for infrastructure a decade ago, and there’s little reason to expect it will now.
Why the Timeline is Shorter This Time
Organizations that approached microservices thoughtfully ended up with systems that scaled cleanly, while those that rushed are often still paying down that architectural debt years later. The same is playing out with agentic AI, except the debt comes due faster. With microservices, a bad decision surfaced as a broken deploy or a paged engineer, but with agents, non-determinism compounds silently and autonomously across long-running workflows, so the debt accrues in decisions you can’t see until the blast radius is large.
The lessons are already on the table. The teams that will win the agent era will be those who recognized which lessons carried over, which ones didn’t, and built for agentic durable execution before the debt came due.
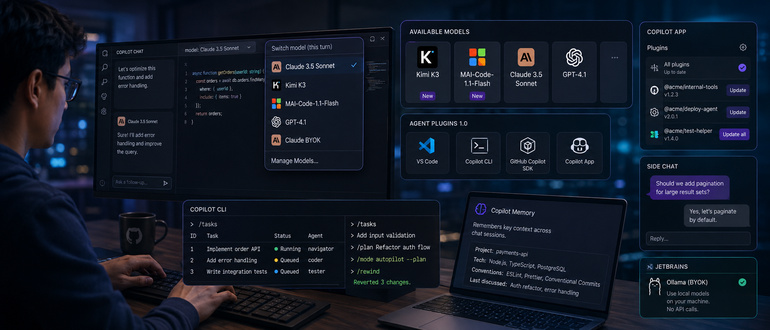
Most development teams don’t pick one AI model and stick with it anymore. They pick the best model for the job at hand and switch when the job changes. GitHub’s latest round of Copilot updates, published Aug. 13 in its weekly changelog covering the week of Aug. 10, reads like an admission that this is now normal — and that Copilot needs to be built around it rather than around any single model.
The headline additions are two new models. Kimi K3 is rolling out across Copilot Pro, Pro+, Max, Business, and Enterprise plans. MAI-Code-1.1-Flash arrives alongside it, with native image understanding and what GitHub describes as improvements in coding quality, instruction-following, tool use, and performance. Neither replaces anything. They sit next to the models already available, which is the point. GitHub isn’t trying to win developers over to one model family. It’s trying to make sure whichever model they trust is one click away.
That same logic shows up in Visual Studio Code 1.133, where developers can now switch models within a Claude session — moving between Claude BYOK and built-in Copilot models on a per-turn basis, without restarting the session or losing context. A developer can start a task with one model, hand off a step to another, and keep working. Mitch Ashley, VP and practice lead for software lifecycle engineering and AI-native software engineering at The Futurum Group, sees a cost hiding inside that convenience. “Developers already run two or three models and pick by task,” Ashley said. “Per-turn switching removes the restart and the record of which model wrote which line. The next engineer reviewing that code cannot reconstruct it.” Model choice, he said, “is now a runtime dependency with no field in the build record,” and by the time something breaks in production, that choice is invisible.
The second theme in this release is consolidation of the plugin ecosystem. Agent Plugins 1.0 is now generally available, and it works the same way across VS Code, Copilot CLI, the GitHub Copilot SDK, and the Copilot app. That’s a meaningful change for teams that have built internal tooling or extensions for one surface and had to rebuild it for another. The Copilot app picked up matching plugin management features — developers can see plugin versions and update them individually or all at once from Settings, instead of hunting through each surface separately.
The app also added side chat, which lets a developer respond to a question from a running agent without derailing the main conversation. It’s a small feature, but it points at a real problem teams run into with agentic workflows: an agent asks a clarifying question mid-task, and answering it either interrupts everything else or gets lost in the thread. Side chat is GitHub’s answer to that friction.
Copilot CLI got the heaviest set of updates this cycle. A new /tasks command lets developers manage subagents and check their status without leaving the terminal. Prompts, commands, and slash commands can now be queued while an agent is mid-task, so developers don’t have to sit and wait for one step to finish before lining up the next. The –plan and –mode autopilot flags can now be combined in headless mode, which automates both planning and implementation in a single pass — useful for CI pipelines or scheduled jobs where no one’s watching the terminal. And /rewind gives developers a way to undo Copilot’s changes without relying on git, which matters for anyone working in a repo where a clean commit history isn’t guaranteed at every step.
JetBrains users get two additions worth noting. Copilot Memory retains context across chat sessions, so developers no longer have to re-explain the same project details every time they open a new chat. And JetBrains now supports Ollama as a bring-your-own-key provider, extending the model-choice theme to local models running on a developer’s machine — no API call required.
None of these updates, taken individually, dramatically change how teams work. Taken together, they describe a tool that’s stopped trying to be the smartest model in the room and started trying to be the best place to manage whichever models a team already trusts. For DevOps and platform teams standardizing on Copilot across mixed environments, that’s arguably more useful than any single model upgrade. But Ashley’s point stands: nothing in this release records which model touched which line. That gap, as he put it, “has to close before this reaches every developer in the org.”
GitHub ships these updates weekly, and the pace shows in how incremental each item feels. But the direction is consistent: Less friction between models, more control over agents, and fewer reasons to leave the terminal or IDE to get any of it.
Engineering teams running agentic systems in production tend to discover the same gap — in the same order. First they notice that the dashboards look healthy — then realize that a healthy dashboard and a correctly behaving agent are not the same thing. It is somewhere in that apparently healthy system that an agent had been quietly producing outputs that fell outside any acceptable range of correctness for hours before anyone noticed. Not because the monitoring failed to fire, but because it was watching for the wrong thing.
Service level objectives (SLOs) were built on a contract that most engineering teams have never had a reason to question. Typically, a request would come in, the service would process it and reliability was measured against whether the outcome matched the expectation within the defined thresholds. That contract worked because the systems it governed were deterministic. The same input produced the same output, and deviation from that expectation was unambiguously a failure.
“Agentic systems have broken that contract without replacing it with anything most platform teams are ready to operate against,” says Shahid Ali Khan of TestMu AI (formerly LambdaTest). Identical inputs can produce different, plausibly correct outputs. Quiet failures complete successfully while doing something entirely unintended — and the metrics most teams are watching — latency p99, error rate and availability — tell you whether something broke but not whether the agent deviated from the expected behavior in ways that matter to the business.
Khan points out that the frameworks have not caught up and the teams discovering that gap are predominantly doing so through incidents rather than through deliberate architectural decisions made before those incidents occurred.
Identical Inputs No Longer Guarantee Identical Outputs
Ronak Desai, CEO and co-founder of Ciroos and formerly SVP and GM at Cisco, identifies the structural flaw in existing SLO frameworks with a precision that practitioners who have not yet run agentic systems in production may not have encountered directly. “Traditional SLOs are dependent on deterministic contracts,” Desai argues. “A request either meets a latency threshold, or it doesn’t. Agentic systems violate that assumption because identical inputs can produce different, plausibly correct outputs or quiet failures that never appear as errors.” The implication is not that reliability is unmeasurable in agentic systems. It is that the measurement model has to change fundamentally rather than incrementally.
The first practical consequence of that reframe is accepting that existing metrics need to be supplemented rather than replaced. Infrastructure metrics still matter and should not be abandoned. What they cannot do is tell the whole story when part of the system is probabilistic by design. That is where the observational gap opens up and where most teams are currently flying blind without realizing it.
Khan, principal engineer–DevOps at TestMu AI, an AI-native software testing platform, arrives at the same diagnosis from the operational side. When his team started integrating agentic components into their test orchestration platform, the existing SLO metrics proved necessary but insufficient. “These metrics tell you if something broke,” Khan explains, “not why or how badly the agent deviated from expected behavior.” A service can be technically up, passing every infrastructure check the team has instrumented for, while simultaneously producing outputs that fall outside any acceptable range of correctness. The gap between those two states is precisely what traditional SLO frameworks have no mechanism to surface.
Closing that gap requires building a second layer of measurement on top of the first rather than trying to stretch existing metrics to cover behavior they were never designed to capture. That architectural insight, that behavioral correctness requires its own measurement layer rather than a refinement of infrastructure metrics, is the principle that connects every practitioner who has worked through this problem in production.
Arun Anbumani, principal cloud infrastructure engineer at Oracle, adds a dimension to the nondeterminism problem that the agent-focused framing alone cannot capture. Hardware and firmware variability at the infrastructure layer, queue pressure on accelerators, firmware resets and resource contention on GPUs and SmartNICs introduce behavioral variance before any AI component is even involved. “Reliability is no longer just about whether an API call succeeds,” Anbumani observes. “It is about whether the entire platform stack is behaving normally.” In environments running heterogeneous infrastructure alongside agentic workloads, the nondeterminism problem compounds across layers simultaneously and platform teams that treat it as purely a model problem will keep finding infrastructure-layer failures that their agent-focused monitoring was never positioned to catch.
The actionable consequence here is that SLO redesign for agentic systems has to start at the infrastructure layer rather than at the model layer. Teams that jump straight to behavioral SLOs without instrumenting the hardware and firmware signals feeding the models will build a measurement system with a blind spot at its foundation. Getting the platform-level indicators right is the prerequisite for everything that comes above it.
Behavioral Correctness Needs Its Own Measurement Layer
The response that has emerged from practitioners who have worked through this problem is a layered SLO model that retains classical reliability metrics at the infrastructure layer while adding new measurement primitives for inference reliability and behavioral correctness above it. Khan and Ihor Zakutynskyi, chief technology officer at FORMA by Universe Group, arrived at this architecture independently, which is a strong indication of emerging practitioner consensus rather than individual preference.
Khan’s implementation adds a behavioral correctness layer above the classical reliability metrics his team retained. “We track semantic similarity scores between generated tests and a baseline corpus, confidence thresholds from underlying models, and outcome variance over rolling windows,” he explains. “If variance exceeds a threshold even when the service is technically up, that is an SLO breach.” The behavioral layer is not a replacement for infrastructure monitoring. It is the layer that makes infrastructure monitoring meaningful for services where the output is probabilistic rather than deterministic, and it gives teams a mechanism for detecting degradation before it surfaces as a customer-facing incident because behavioral drift tends to precede visible failure rather than coincide with it.
The practical recommendation that follows is to define behavioral thresholds empirically from production data before setting them as SLO targets. Starting with rolling window variance monitoring and adjusting the threshold based on what the team observes over several weeks gives a more defensible baseline than picking a number from theory and hoping it holds in production.
Zakutynskyi’s three-layer model maps closely to Khan’s approach and adds a precision that practitioners building these systems for the first time will find useful. The infrastructure reliability layer retains familiar metrics governed by conventional error budgets. The inference reliability layer tracks model-specific signals including token-level latency, response time variance and fallback frequency. The behavioral SLO layer enforces bounded consistency, validating that outputs meet structured contracts and measuring semantic drift against embedding-similarity baselines.
“A service might be 99.9% available at layer one yet still violate its behavioral consistency SLO if outputs wander beyond the defined variance envelope,” Zakutynskyi notes. The reframe from uptime to what he calls ‘trust over time’, covering correctness, safety and consistency, is the architectural shift that makes SLOs meaningful for agentic systems rather than simply applicable to them.
Keeping each layer tracked independently rather than aggregated is what makes incident routing possible, and collapsing all three into a single composite score obscures the causal structure of failures and makes it impossible to route incidents to the right team with the right context. Infrastructure failures route to platform engineers, while inference failures route to the ML team and behavioral correctness failures route to whoever owns the agent’s goal specification and output contracts. The separation is not administrative tidiness but the operational prerequisite for a functioning response process.
Start With Step Count and Build From There
Desai offers the most actionable framework for practitioners trying to operationalize agentic SLOs. It organizes around four dimensions that together form a reliability model built for nondeterministic systems rather than adapted from deterministic ones.
The first dimension is latency measured by task class, specifically time per logical conclusion rather than time-to-first-byte, a metric that becomes meaningless when a task spans dozens of model calls. The second is step count as a reliability signal, where excessive steps indicate that an agent is confused or operating inefficiently. “It should not take an agent 20 steps to solve a two-step problem,” Desai notes, and that observation is more immediately relatable to engineering leaders than any abstract discussion of nondeterminism because it translates directly into a metric that any team can instrument without building new infrastructure.
The third dimension is probabilistic correctness, replacing binary correctness tests with pass@k-style distributional accuracy targets so that SLOs capture correctness across repeated runs rather than a single snapshot. The fourth is confidence and intent alignment, treating low-confidence actions in high-stakes contexts as first-class reliability events that automatically trigger human review or rollback rather than silently proceeding.
The implementation sequence this framework implies is worth making explicit. Start with step count monitoring because it requires the least new infrastructure and surfaces the most obvious failure mode. Add task-class latency next because it gives the time-per-logical-conclusion signal without requiring behavioral analysis. Layer-in pass@k correctness evaluation once there is a corpus of validated outputs to measure against. Then, build confidence and intent alignment alerting last because it requires the most domain-specific calibration to avoid generating false positives that erode trust in the alerting system itself.
Decision Points Are the Unit of Observation, Not Requests
The measurement model is only as good as the observability infrastructure feeding it, and the observability infrastructure most platform teams have is not built to surface the signals that agentic reliability requires.
Khan’s team has moved to probabilistic tracing as the foundation. Standard distributed tracing assumes that a request follows a predictable path. With agents, the path itself is a decision. “We emit trace annotations for decision points,” Khan explains, “which tool was invoked, what reasoning chain was followed, what confidence score triggered the choice.” This gives his team the ability to correlate reliability failures with specific behavioral patterns rather than just infrastructure faults. Behavioral drift dashboards that compare current agent output distributions against baselines from previous weeks have proven more predictive of incidents than traditional alerting, triggering human review before customers notice degradation.
The decision point is the unit of observation in an agentic system, not the request. Tracing infrastructure that cannot record what the agent decided and why it decided it cannot support the kind of incident attribution that agentic reliability requires. Building that tracing capability before the system goes to production rather than retrofitting it after the first incident is the single most high-leverage investment a platform team can make when onboarding agentic workloads.
Zakutynskyi’s observability approach logs every request with its exact prompt, model version and policy tags alongside intermediate reasoning traces and tool calls. This separation of transport-level failures from AI decision errors is what makes schema validation and trace-based replays possible, allowing his team to pinpoint whether a bad result came from network noise or from the agent’s logic. Anbumani adds platform-level indicators to the observability picture, covering accelerator health, reset frequency, retry amplification and resource pressure alongside standard request metrics, making the full platform stack visible rather than just the application layer.
Observability for agentic systems has to be designed into the data model from the start. Prompt logging, model version tagging and policy annotations are not add-ons that can be layered onto an existing observability stack. They require the system to emit structured data at the point of decision, which means the observability requirements have to inform the agent architecture rather than follow from it.
Error Budgets in an Agentic World
The error budget question is where existing frameworks show their deepest limitations and where most platform teams are still operating without a clear answer. “The error budget model we inherited assumes failures are attributable and bounded,” Khan observes. “When an agentic component is in the causal chain of an incident alongside human-authored services, attribution becomes genuinely difficult. Did the agent fail because the model drifted, because the input it received was outside its training distribution or because a human-authored service upstream gave it bad context to reason from? Each of those failure modes has a different owner and a different fix, but the incident looks identical from the outside.” At TestMu AI, the team has moved toward separate budget categories for infrastructure failures, inference failures and behavioral correctness failures, tracking each independently rather than aggregating them into a single error budget that obscures the causal structure of what is actually going wrong.
Error budget reviews have to change in format as well as content. A review that aggregates all failure types into a single burn rate number cannot support the conversation that agentic reliability requires, which is a conversation about which category of failure is consuming budget, why and which team owns the response. Separating the budgets is what makes that conversation possible, and building the attribution tooling that populates each budget accurately is the prerequisite for the separation to be meaningful rather than cosmetic.
The behavioral correctness budget in particular has no industry standard to calibrate against, and defining acceptable thresholds empirically from production data is currently the only option available to most teams. That is an uncomfortable position for organizations used to having external benchmarks to validate their reliability targets against, and it is the clearest signal of how early the field still is in developing the shared infrastructure that mature reliability engineering requires.
What the Field Still Needs
The gap that Khan identifies from his team’s experience building these systems is the same gap that every contributor to this piece identifies from their respective vantage points. “We still lack good industry standards for what acceptable nondeterminism looks like,” Khan observes. “We have defined these thresholds empirically, but there is no equivalent of 99.9% availability for agent correctness. That is an open problem the industry needs to solve.” The layered SLO model, the four-dimension framework, the probabilistic tracing and the behavioral drift dashboards are all real and deployable responses to a real problem. But they are responses built in the absence of the shared standards that would make them interoperable, auditable and comparable across organizations.
The convergence that Khan and Zakutynskyi reached independently on the layered SLO model is the kind of empirical evidence that standards bodies and platform engineering communities should be building from. Translating that convergence into shared specifications is unglamorous work that does not generate the benchmark numbers that make AI adoption announcements compelling. But it is the work that determines whether the next generation of agentic infrastructure is built on a foundation that holds, and that work is available to any team willing to contribute what they have learned to the conversation rather than keeping it as internal knowledge.