Author: Mike Vizard

  • CNCF Adopts Meshery to Advance Service Mesh Management

    CNCF Adopts Meshery to Advance Service Mesh Management

    The Cloud Native Computing Foundation (CNCF) announced this week during the ServiceMeshCon/KubeCon + CloudNativeCon conference that Meshery, a service mesh management plane created by Layer5, has become a sandbox-level project.

    In addition, Layer5 has also donated Service Mesh Performance (SMP), a set of tools for measuring the efficiency of a service mesh, to the CNCF. SMP provides an open source framework to define standardized benchmarking practices, performance test configurations and measurements as part of an effort to create a MeshMark index for rating a service mesh. A set of service mesh performance methodologies will also be published by the IEEE later this month, developed in collaboration with engineers from Layer5, Intel, Red Hat and HashiCorp.

    Layer5 CEO Lee Calcote said the goal is to make it simpler for IT teams to determine which service mesh to employ based on their specific use case requirements.

    Several service mesh platforms are starting to gain traction as a means to both manage application programming interfaces (APIs) and provide a layer of abstraction between lower-level networking and security APIs that makes those services more programmatically accessible to developers.

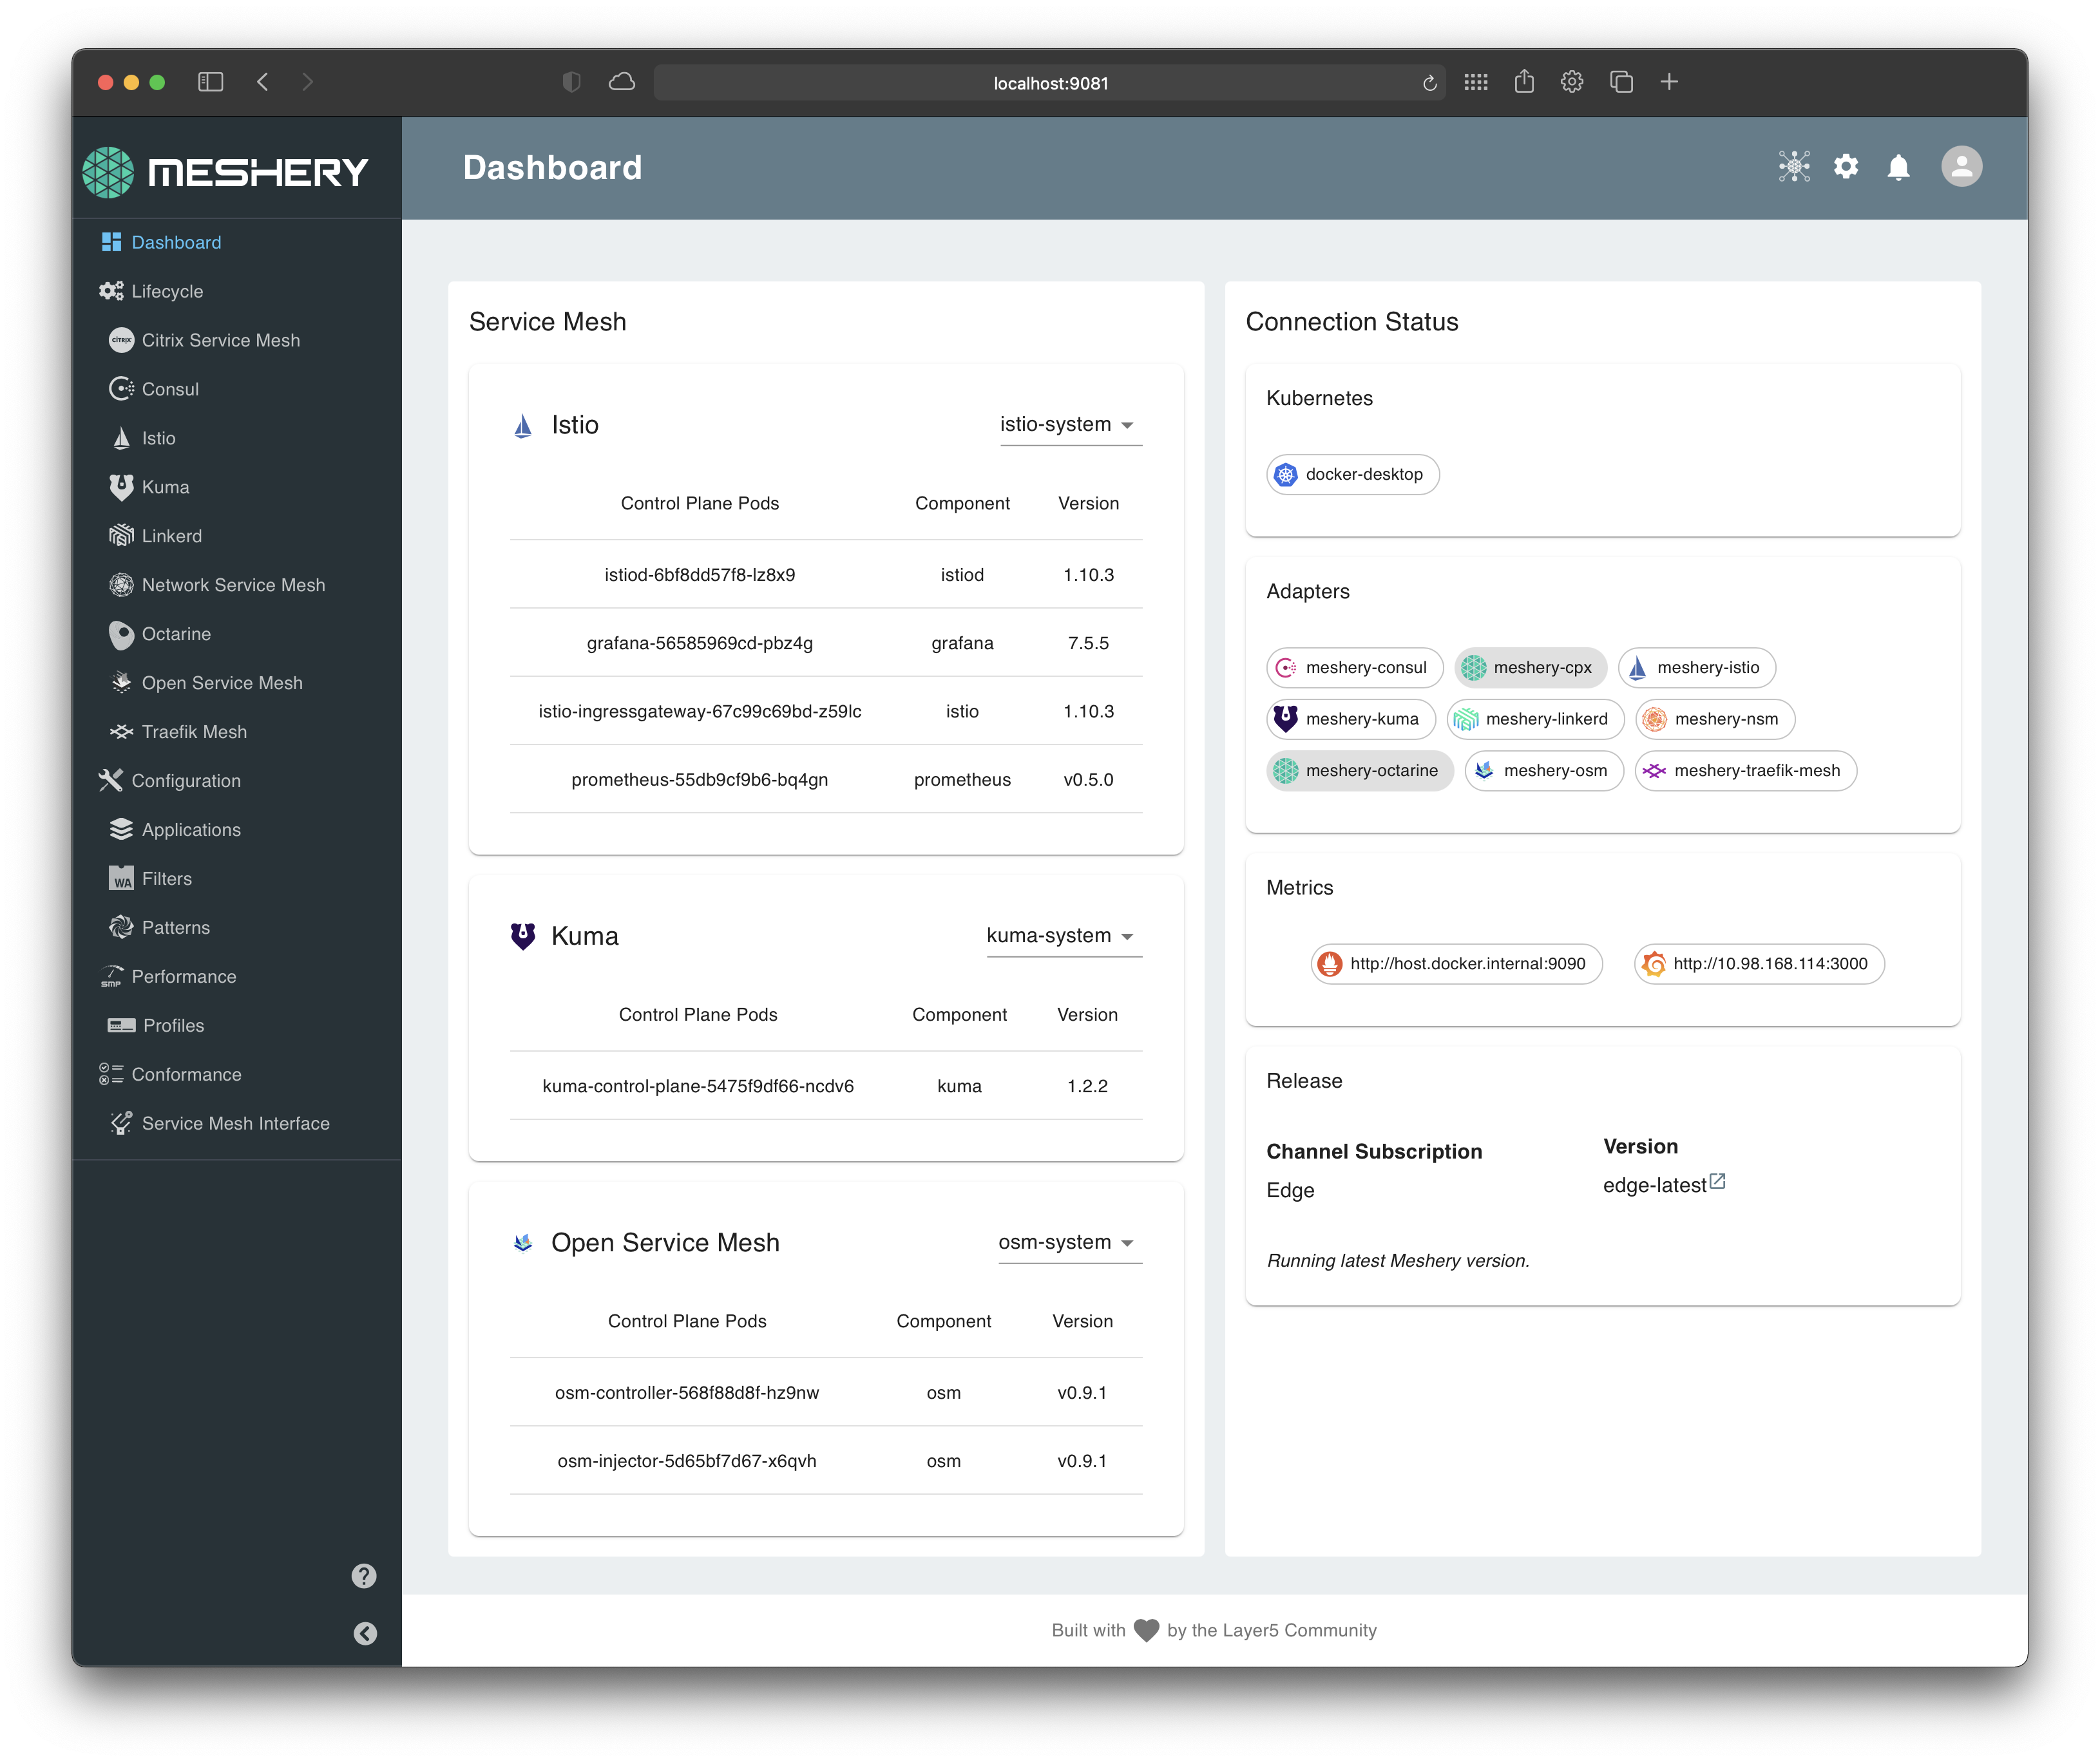
    Meshery itself is an implementation of SMP and the conformance tool created for the Service Mesh Interface (SMI), a separate CNCF project to promote interoperability between service meshes. Meshery is based on a set of microservices that are designed to make the platform easily extensible.

    That approach makes it possible to manage multiple instances of service meshes that might be deployed on virtual machines as well as Kubernetes clusters using a range of management tools that are part of the Meshery project.

    Meshery supports AWS App Mesh, Citrix Service Mesh, HashiCorp Consul, Istio, Kuma, Linkerd, Network Service Mesh, NGINX Service Mesh, Open Service Mesh and Traefik Mesh. Meshery also provides IT teams with more than 60+ best practices in the form of templates that can be used to deploy a service mesh.
    It’s still early days as far as adoption of service mesh in the enterprise is concerned. Most IT teams still rely on either proxy software or a gateway to manage APIs. However, as the number of APIs that need to be managed steadily increases, it won’t be long before many IT teams start to at least evaluate a service mesh.

    In the longer term, the impact those service meshes are likely to have on the management of IT could be profound. It is becoming apparent that a service mesh also provides a higher level of abstraction for invoking networking and security services. In fact, the service mesh may wind up playing a key role in driving the convergence of network and security operations with DevOps best practices.

    In the meantime, IT teams will need to decide to what degree they may want to standardize on a single service mesh versus letting individual teams implement their own preferred platform that could one day be centrally managed via Mashery. One way or another, the way APIs are managed and invoked will soon fundamentally change forever.

  • New Relic I/O Aims to Simplify Instrumentation

    New Relic I/O Aims to Simplify Instrumentation

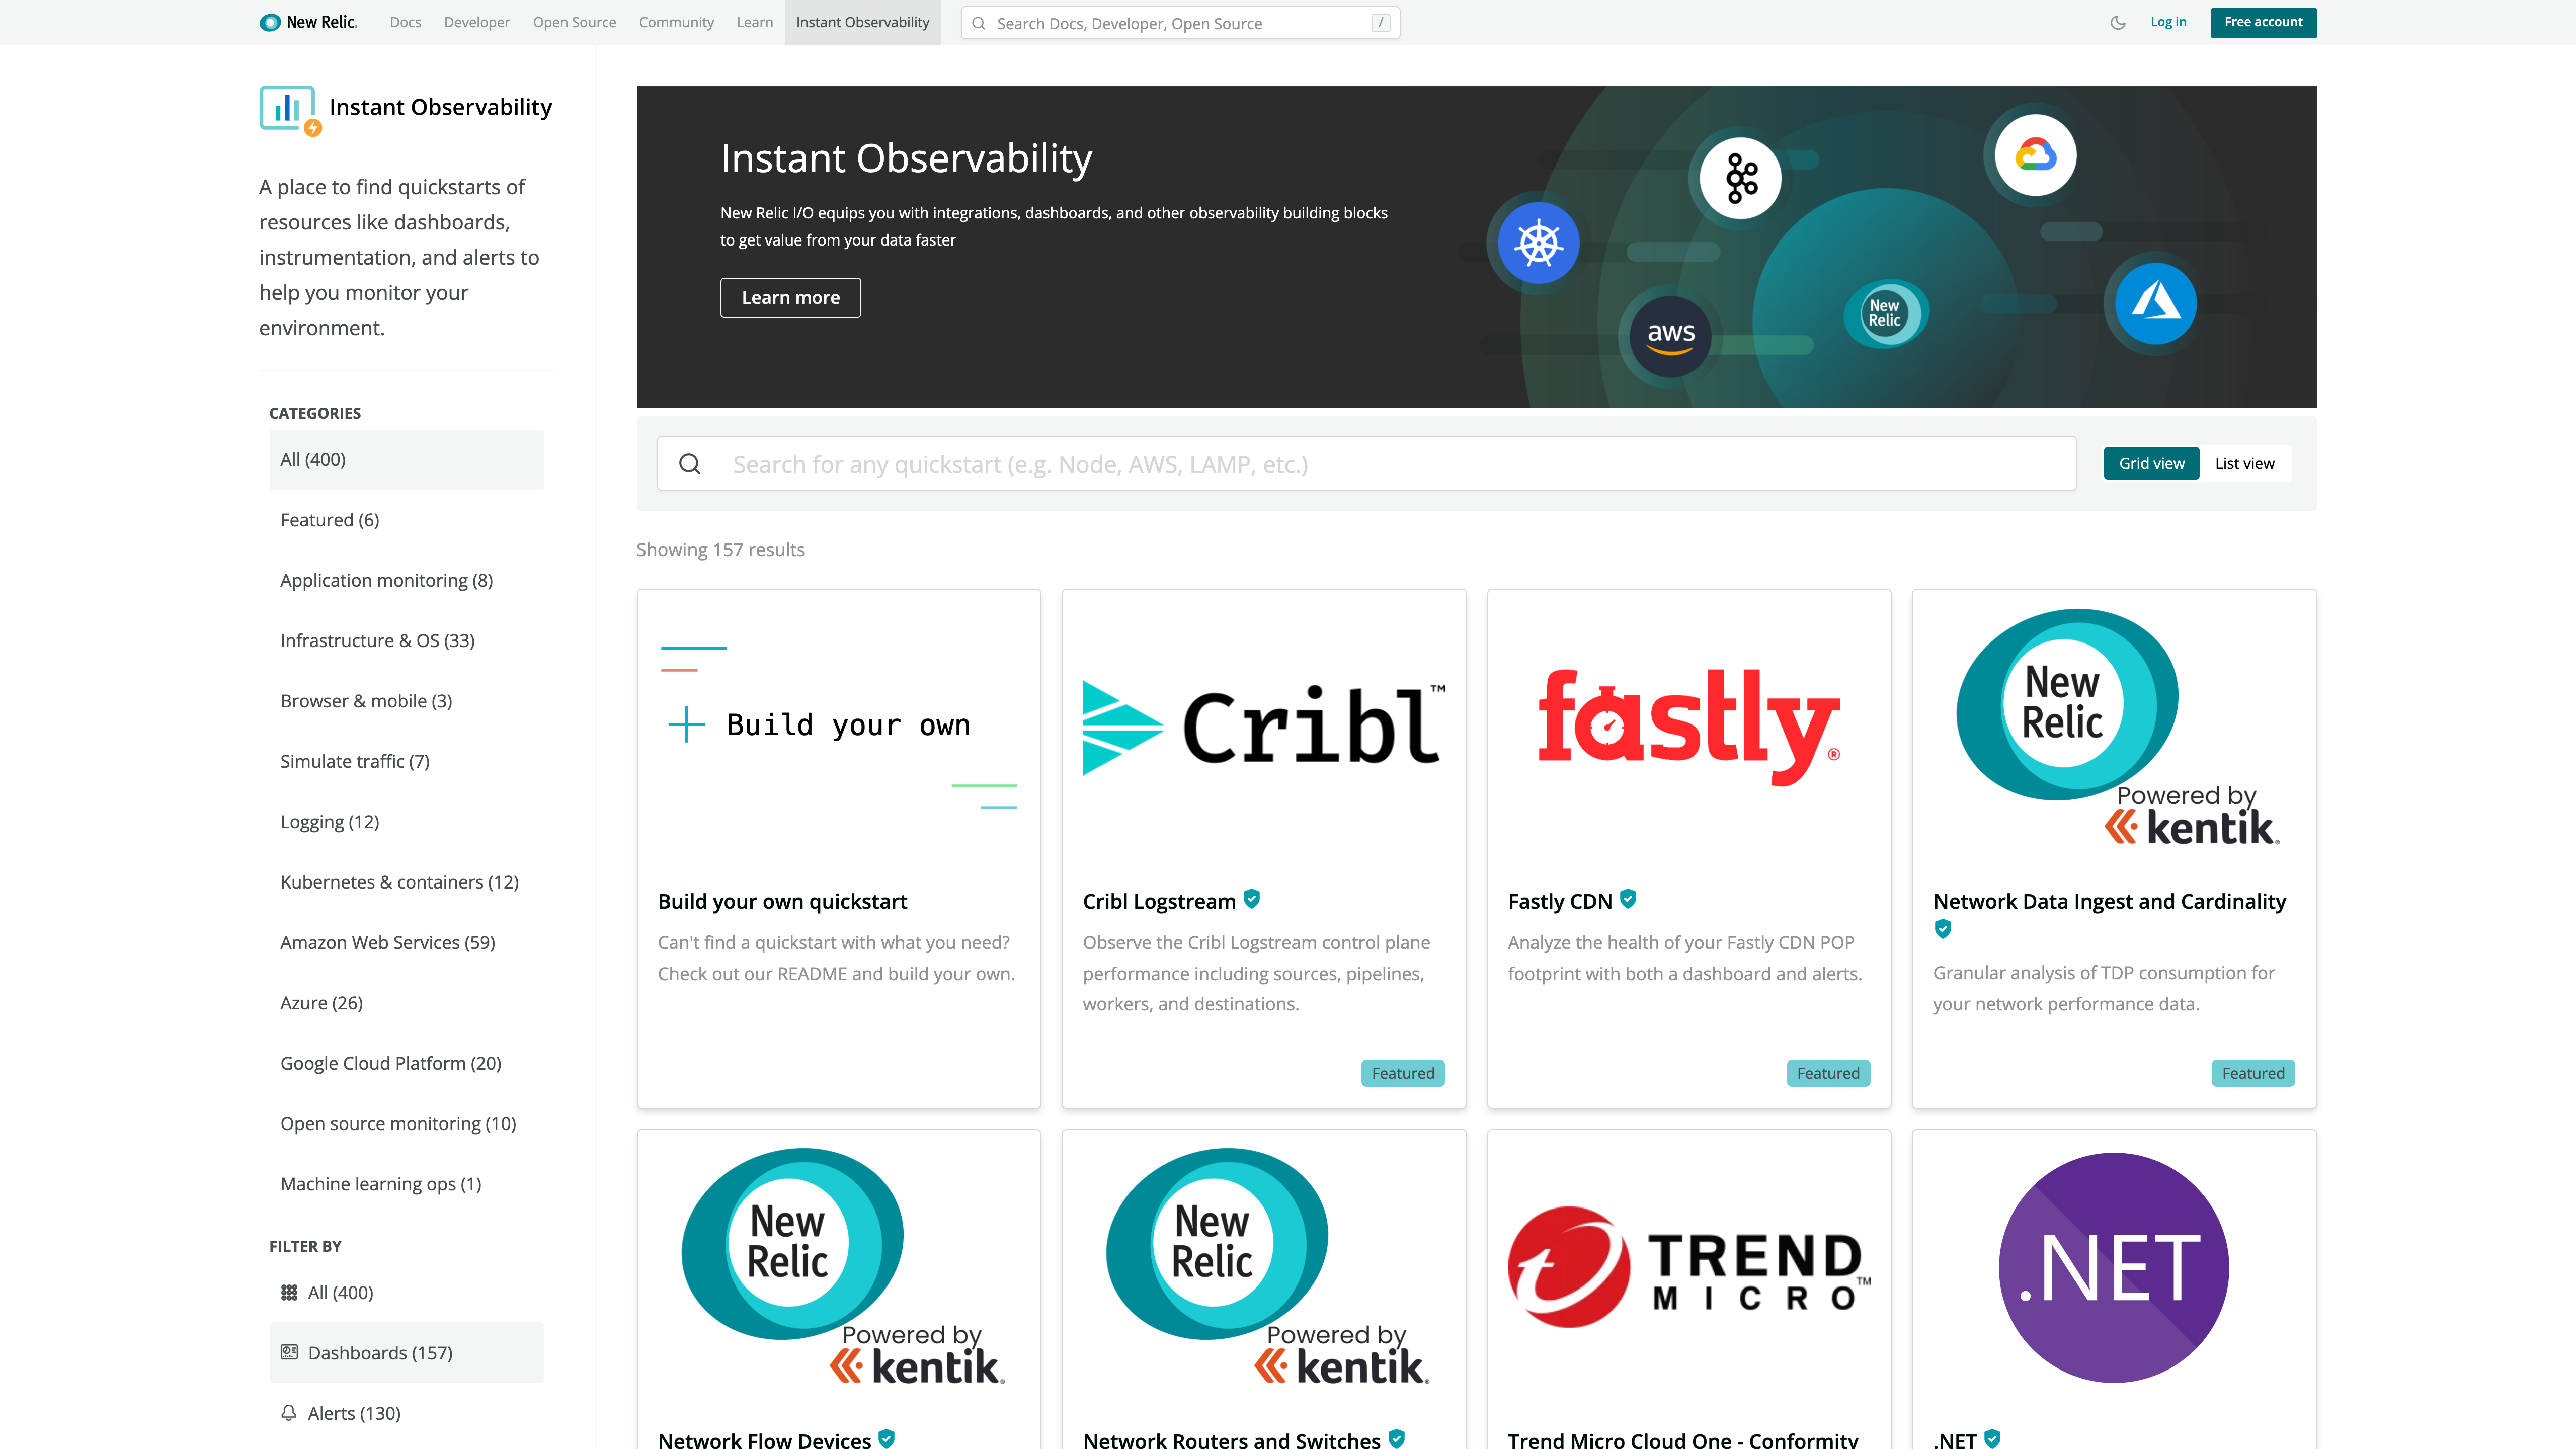
    New Relic today at the KubeCon + CloudNativeCon North America conference launched a New Relic Instant Observability (I/O) initiative through which it is making available open source tools to simplify application instrumentation.

    Marck Robinson, senior vice president for engineering at New Relic, said the catalog of tools will help DevOps teams instrument a much wider range of applications. New Relic will make those tools available as part of the free tier of its observability platform delivered via the cloud. DevOps teams will be able to use more than 400 pre-configured quickstarts to both instrument applications and create dashboards, Robinson said.

    New Relic itself is contributing quickstarts for cloud services, open source tools and platforms such as Kubernetes, Istio and Cassandra. Third-party vendors that have already contributed to the catalog include Cribl, Fastly, Gigamon, Kentik, Lacework and Trend Micro. Each contribution is being vetted by New Relic as part of an effort to foster the development of a larger open source observability ecosystem, noted Robinson.

    Robinson said overall, New Relic is trying to make it easier for DevOps teams to close an instrumentation gap that is impeding IT organizations from moving beyond monitoring to embrace true observability of their IT environments. The recent New Relic 2021 Observability Forecast report notes only a quarter of respondents (26%) have a mature observability practice, with the most commonly cited barriers to observability being a lack of resources (38%) and skills gaps (29%).

    As a result, DevOps teams often encounter a last-mile observability challenge when it comes to both instrumenting applications and then building their dashboards, said Robinson.

    As part of a larger effort to make it easier to instrument applications, New Relic has open sourced agent software, standardized on the OpenTelemetry tools being advanced under the auspices of the Cloud Native Computing Foundation (CNCF) and contributed the Pixie observability platform for Kubernetes environments to the CNCF.

    Observability in one some or another has always been a core tenet of any DevOps best practice. Initially, DevOps teams focused on continuous monitoring as the most effective way to proactively manage application environments. However, it can still take days, sometimes weeks, to discover the root cause of an issue. However, observability platforms are emerging that correlate events in a way that makes it easier for analytics tools to identify anomalous behavior indicative of a root cause of an IT issue. Armed with these insights, it becomes a lot simpler for IT teams to resolve issues faster.

    In contrast, monitoring focuses on predefined metrics to identify when a specific platform or application is performing within expectations. The metrics tracked generally focus on, for example, resource utilization. Observability, on the other hand, combines metrics, logs and traces—a specialized form of logging—to instrument applications in a way that makes it simpler to troubleshot issues without having to rely solely on a limited set of metrics that have been pre-defined to monitor a specific process.

    With the rise of microservices-based applications, the shift to the cloud and more end users than ever working remotely, the need for observability has never been more critical. The issue now is finding a way to make it much simpler to achieve.

  • LF Networking (LFN) Adds to Open Source Portfolio

    LF Networking (LFN) Adds to Open Source Portfolio

    At the online Open Networking & Edge Summit + Kubernetes on Edge Day event LF Networking (LFN), an arm of the Linux Foundation focused on networking, today added several projects that promise to make it simpler to programmatically manage networking services based on open source software.

    Walmart is contributing a L3AF project for managing network applications that make use of an extended Berkeley Packet Filter (eBPF) capability that allows applications to run in a sandbox at the microkernel level of an operating system. Intel and Aarna Networks, meanwhile, are donating the seed code from an EMCO project that provides a universal control plane to securely connect and deploy workloads across distributed computing environments that span everything from the edge to the cloud.

    Arpit Joshipura, general manager for networking, edge and internet of things (IoT) for the Linux Foundation, said the L3AF project adds a control plane for managing those applications to the LFN portfolio that addresses load balancing, rate limiting, traffic mirroring, flow exporter, packet manipulation, performance tuning and other management tasks. Earlier this year, the Linux Foundation set up a separate eBPF Foundation to further advance development and adoption of eBPF across multiple operating systems.

    At the same time, LFN also revealed today that Project Alvarium, a tool for measuring how well data is being delivered to devices that was originally created by Dell, and eKuiper, an existing open source lightweight IoT data analytics and streaming platform, are now part of the LF EDGE portfolio of projects.

    Finally, an open source mobile edge computing project, dubbed Edge Gallery, that was originally created by Huawei has been contributed to the Linux Foundation.

    Joshipura said the LFN continues to gain momentum as more vendors contribute core technologies that, ultimately, don’t provide them with enough differentiated value to continue to develop on their own. The LFN today also revealed that VMware and F5 Networks have joined the LF EDGE consortium as premier members, while mimik and Veena, Inc. have become general members of LFN and the Eclipse Foundation has become an associate member.

    The LFN also provides a mechanism that promotes adoption of those technologies more widely than any one vendor can achieve on its own. The total cost of delivering next-generation edge computing platforms based on wireless 5G networks will also be sharply reduced as LFN projects continue to mature, said Joshipura.

    In general, the rate at which various LFN projects are updated continues to accelerate, said Joshipura. The Akraino project for creating blueprints for edge computing platforms recently delivered its fifth update to address use cases involving smart cities, cloud-native multi-tenant environments and vehicular networks. An EdgeX Foundry project for IoT platforms, meanwhile, recently revamped its application programming interfaces (APIs) to make them more secure and enable more message-based communications. The Home Edge project will also soon issue a Drewberries update that will address code stabilization, scripting, APIs, data synchronization and security.

    It’s now only a matter of time before these LFN projects become more integrated with DevOps workflows as IT teams seek to give developers more programmatic control over network services. The issue now is deciding not so much whether to integrate network operations and DevOps teams but rather determining to what degree those teams will need to fold into each other.

  • Snyk Extends Tools Portfolio to Drive DevSecOps Adoption

    Snyk Extends Tools Portfolio to Drive DevSecOps Adoption

    During its online SnykCon 2021 conference this week, Snyk extended Snyk Code, a static application security testing (SAST) tool that already supports the Java, JavaScript and Python programming languages to include support for C#, Ruby, PHP and Go.

    At the same time, Snyk Open Source, a platform for remediating open source vulnerabilities, has been extended to provide native integration with Atlassian BitBucket and AWS CodePipeline platforms for driving DevOps workflows. Snyk has also tightened integrations with platforms from DigitalOcean and HashiCorp.

    Snyk also added support for the Elixir programming language and package managers Yarn 2 and Poetry alongside integration with a C++ scanning tool from FossilID, a provider of a software composition analysis (SCA) tool for open source code that Snyk acquired earlier this year.

    The Snyk Container platform is now integrated with the open source Trivy container scanning tools and with Snyk’s vulnerability database in addition to adding support for container registries such as Quay, GitHub Container Registry, GitLab, Google Artifact Registry and Harbor.

    The Snyk infrastructure-as-code platform now also makes it possible to detect configuration issues in Kubernetes manifests in Terraform code in a way that is compatible with cloud platforms from Amazon Web Services (AWS), Microsoft Azure and Google Cloud Platform (GCP).

    Snyk also is adding support for version 3 of OpenAPI, which the company reports is three times faster than the previous version. That API is also the foundation for Snyk Apps that the company will continue to roll out.

    Finally, Snyk launched both a new free developer security education program, dubbed Snyk Learn, through which developers can attain and measure their level of DevSecOps expertise and Snyk Impact, an effort to foster collaboration among developers involving a wide range of socio-economic issues.

    Company president Guy Podjamy said as DevsecOps continues to evolve, the primary focus remains on developers and DevOps teams. However, as an issue, DevSecOps is also becoming more important at both the C-level within organizations as well as individual security operations teams. As such, and in the wake of recent high-profile security breaches, the sense of urgency surrounding DevSecOps is now a lot higher. The fundamental challenge organizations are trying to address is finding a way to improve overall application security without slowing down the pace at which applications are built, noted Podjamy.

    Snyk itself revealed it has secured an additional $530 million round of funding to address those issues. The company has now raised a total of $775 million to date with a valuation of $8.5 billion. Snyk also revealed it has increased annual recurring revenue (ARR) by 154% year-over-year from a customer base that now spans more than 1,200 organizations, including Asurion, Google, Intuit, MongoDB, New Relic, Revolut and Salesforce. Snyk customers and users collectively have run more than 300 million tests in the last 12 months to fix more than 30 million vulnerabilities in a 90-day period of time, the company claims.

    It may be a while before most organizations have embedded security tools within every DevOps workflow. However, given the resources being poured into DevSecOps, it may be more a question when DevSecOps will be finally achieved rather than if.

  • BMC Acquires StreamWeaver to Advance AIOps Strategy

    BMC Acquires StreamWeaver to Advance AIOps Strategy

    BMC has acquired StreamWeaver, a provider of a platform that makes it simpler to capture streaming data in real-time, as part of an effort to extend the BMC Helix IT operations platform infused with artificial intelligence (AIOps). Financial terms of the transaction were not disclosed.

    Margaret Lee, general manager and senior vice president for digital service and operations management for BMC, said StreamWeaver brings with it a wide range of integrations with multiple data sources that BMC will use to both train AI models and improve overall observability. While connecting to data sources is relatively straightforward, the challenge now is collecting that data in real-time in a way that is easily repeatable for IT operations teams, noted Lee.

    In general, AIOps continues to gain traction as IT environments become increasingly complex. Most IT operations teams are not going to be able to manage highly distributed computing environments without augmenting their IT staff with some AI, said Lee.

    Naturally, many rote tasks that were once performed manually by IT operations professionals will become increasingly automated. However, there will always be a need for IT personnel, noted Lee.

    Arguably, there may come a day when IT professionals will not want to work for organizations that don’t have an AIOps platform in place simply because the tasks assigned to them would otherwise be considered archaic, especially if they involve a series of tedious tasks that not many IT professionals really want to perform.

    At the same time, AIOps should reduce overall risk by making it easier for IT operations teams to proactively identify issues before they disrupt an application service. That’s especially critical as IT environments—increasingly with microservices-based applications constructed using containers—and serverless computing frameworks are being deployed with greater frequency alongside legacy monolithic applications.

    BMC has been making a case for AIOps as far back as 2017. However, since then, a wave of startups and IT operations incumbents have either built an AIOps platform from the ground up or updated an existing platform with AI capabilities. It’s difficult to assess which vendors are now ahead in terms of the AIOps race, but one thing that is certain is that IT organizations now have plenty of options.

    From a cultural perspective, however, not every organization is entirely comfortable with AIOps. While some IT professionals remain skeptical, others view AI as an existential threat to their existence. Most IT teams are also concerned about the potential impact any flawed AI model might have on IT operations—it’s one thing for a human to make a mistake, but an AI model making a mistake at scale could be catastrophic.

    There are few IT organizations that are embracing AIOps across the board, but most do recognize that AIOps platforms, in one form or another, are inevitably here to stay. After all, machine learning algorithms never forget anything they learn. Nor do they ever take a day off or decide to leave when offered higher pay. The challenge is figuring out exactly where the interface between IT staff and algorithms is going to be—not just today, but also in the near future.

  • Verica Launches Database for Sharing IT Incident Reports

    Verica Launches Database for Sharing IT Incident Reports

    Verica, a provider of an incident management platform, announced this week it is making available a database to make incident reports publicly available via a single repository.

    Courtney Nash, senior research analyst at Verica, said the Verica Open Incident Database (VOID) initiative is part of an effort to enable organizations to learn from outages and failures caused by software. Today, reports about such incidents tend to be difficult to find because they are scattered all across the internet, she added.

    That lack of transparency makes it difficult to compare and contrast incidents in a way that surfaces meaningful insights, noted Nash.

    Launch partners for the VOID include Indeed, NS1, Adaptive Capacity Labs, Security Scorecard and Auxon. Each will provide support to help fund the development, research and dissemination of knowledge generated by the project.

    The VOID contains more than just standard company postmortems or status updates, added Nash. Verica is committed to applying metadata to better understand how individuals, companies, media and others reacted during an incident.

    One early finding already derived from this initiative is that mean-time-to-resolve (MTTR) is proving to be an inaccurate metric due to the varied distribution of incident data. Other findings include the fact that only one-quarter of incident reports took the time to identify the root cause of an issue, while less than 1% took the time to study incident reports of near-misses.

    In general, there’s now more riding on the performance and availability of IT environments than ever. Digital business transformation became all the rage in the wake of the economic downturn brought on by the COVD-19 pandemic. As the economy continues to recover, businesses now expect IT to respond and pivot to changing conditions no matter how sudden.

    DevOps teams have, of course, learned to expect the unexpected by embracing modern incident management based on DevOps best practices that enable IT teams to adroitly respond to any outage or sudden degradation in application performance. The most important thing to remember about incident management is that practice makes perfect. While practice runs may never precisely mirror an actual crisis, organizations that have processes that are well-known by their IT incident teams and that practice ‘fire drills’ tend to respond both faster and better. After all, the more muscle memory there is to call on the more resilient the organization will be.

    It’s not clear to what degree IT organizations will be willing to share incident reports. However, there is an opportunity for IT professionals to come together that is similar to how engineers from different airlines collaborated to make flying safer for the general public, said Nash. In fact, with so many processes now dependent on software, it’s amazing there have not been more catastrophic events due to software issues. It’s even arguable that it’s only a matter of time before such levels of collaboration are mandated.

    In the meantime, the first step toward achieving that goal may simply be sharing a report with colleagues so they can learn from previous mistakes.

  • Perforce Charts Testing Course After BlazeMeter Acquisition

    Perforce Charts Testing Course After BlazeMeter Acquisition

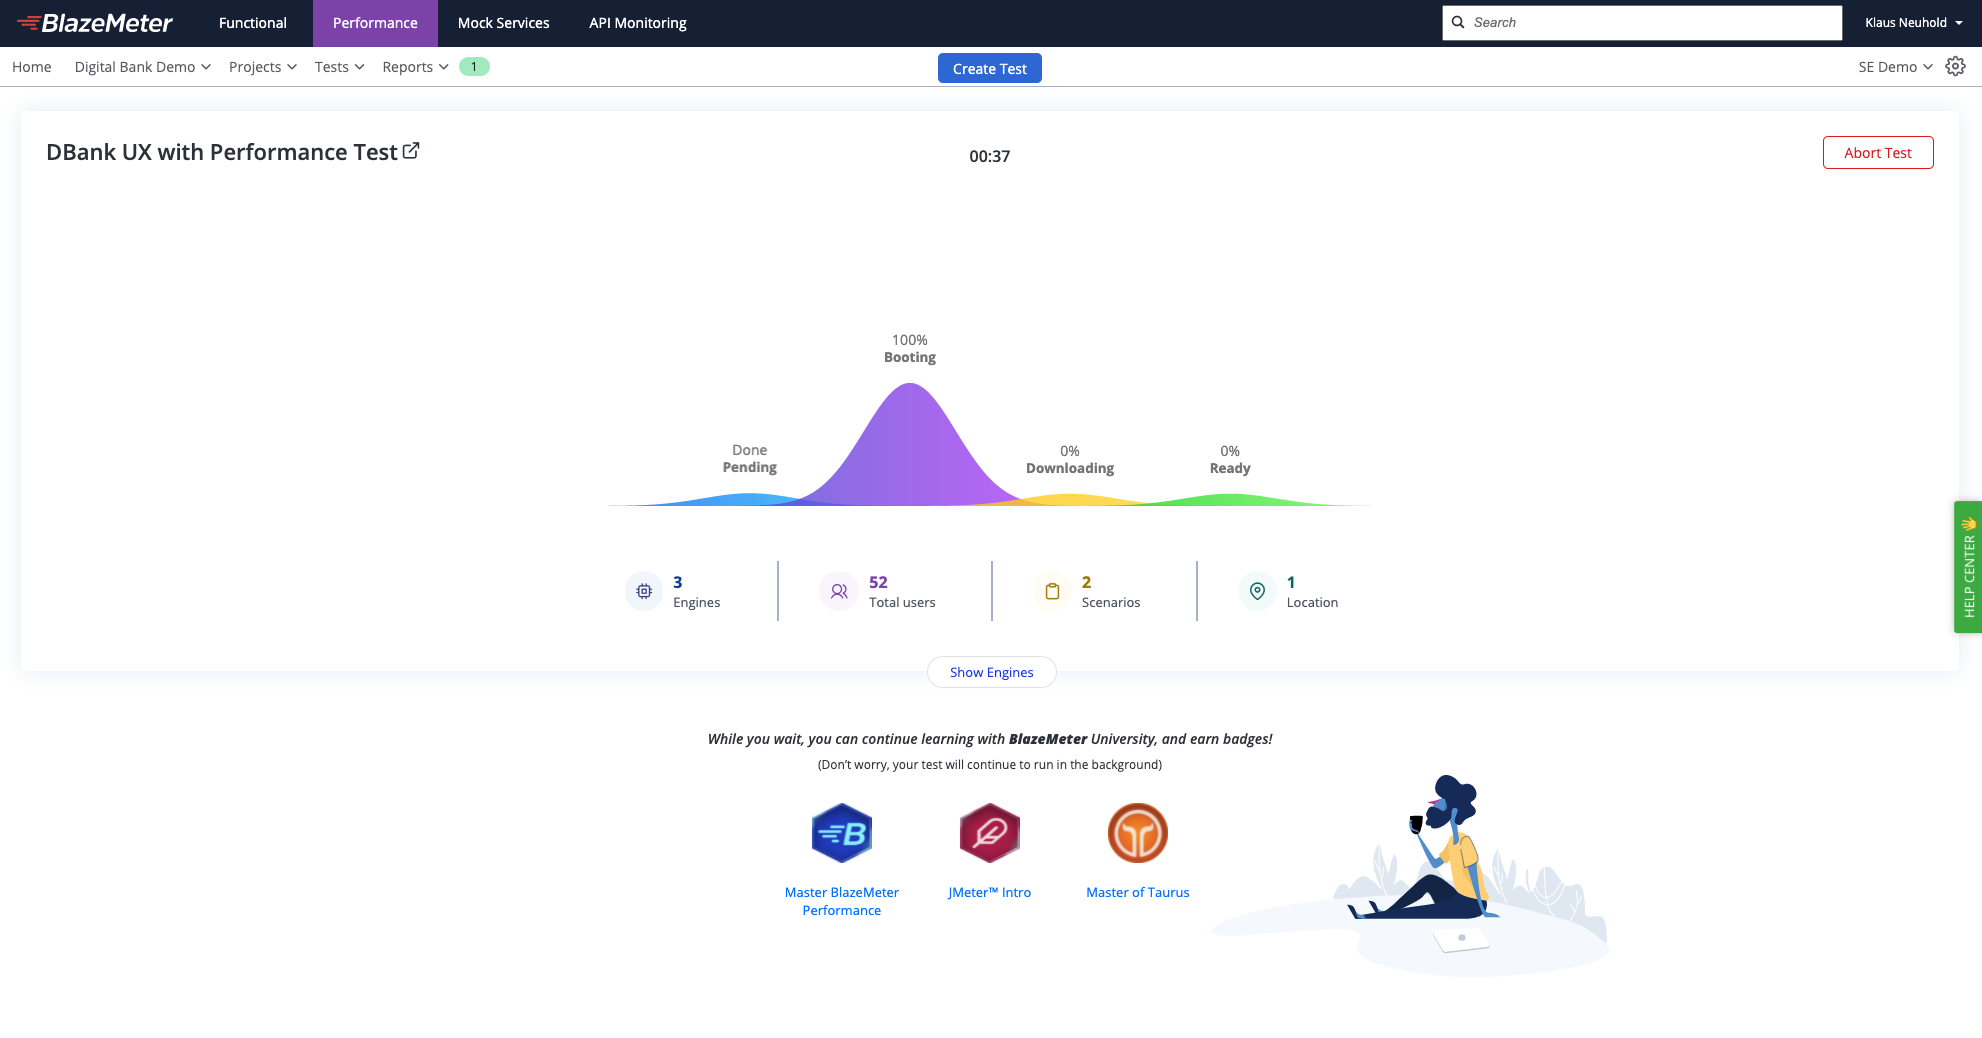
    Perforce Software has acquired BlazeMeter from Broadcom as part of an effort to extend the scope of its testing tools beyond the Perfecto tools for testing mobile and web applications it acquired in 2018.

    Broadcom gained control over BlazeMeter after it acquired CA Technologies in 2018. CA Technologies acquired BlazeMeter in 2016. Terms of the latest acquisition involving BlazeMeter were not disclosed.

    Tim Russell, chief product officer for Perforce, said BlazeMeter adds a complete platform that spans everything from load and performance testing to application programming interface (API) testing. The goal is to enable DevOps teams to push continuous testing further left as part of an effort to accelerate the development and deployment of applications, added Russell.

    The need for continuous testing has become more pronounced as more organizations launch multiple digital business transformation initiatives, noted Russell. The real challenge will be finding ways to embed continuous testing within DevOps processes at a sufficient level of scale, added Russell.

    In fact, the quality of the digital experience those applications provide ultimately determines the degree to which those efforts are likely to succeed, which Russell noted is why so many enterprise IT organizations are reengineering their application testing processes.

    In general, organizations are taking two paths to shift testing further left. Some are giving application performance testing tools to developers to employ during DevOps sprints while others are trying to bring application testers into the application development process earlier. In some cases, organizations are doing both as part of a comprehensive effort to discover issues before applications are deployed in a production environment. Those issue are naturally more expensive to fix after an application has been deployed.

    Perforce, for now, expects to continue to make BlazeMeter and Perfecto available as a set of complementary cloud-based services with some cross-pollination of capabilities occurring over time, said Russell.

    In the longer term, it’s apparent that more artificial intelligence (AI)-based analytics will be embedded within cloud-based platforms that can collect enough data to build meaningful models of development processes. IT teams should also expect to see testing tools make greater use of computer vision algorithms to surface issues.

    One away or another, the entire application testing process is about to become a lot more automated as more organizations are simultaneously building multiple applications. That may not necessarily reduce the need for either a developer or tester to create and manage that process, but it does mean the amount of testing time required for each application should continue to steadily decline in the months and years ahead.

    Hopefully, all that effort will lead to better application experiences being provided to end users more consistently. There is nothing quite as frustrating for any application development team than to discover that 90% of the functionality of an application is not being used because end users are not able to easily surface it. Worse yet, of course, is when an application turns out to be too slow once it is deployed. In either case, it’s difficult to regain that initial end-user enthusiasm for any new application experience after it’s been lost, simply because no one thought through all the use cases that should have been tested much earlier in the application development life cycle.

  • ReleaseIQ Adds Orchestration Tool for Multiple Instances of Jenkins

    ReleaseIQ Adds Orchestration Tool for Multiple Instances of Jenkins

    ReleaseIQ has launched an orchestration framework for the open source continuous integration/continuous delivery (CI/CD) environment that makes it possible for DevOps teams to orchestrate pipelines across multiple instances of Jenkins.

    Seetharam Param, ReleaseIQ CEO, said ReleaseIQ Essentials for Jenkins is an implementation of an existing orchestration platform that enables DevOps teams to orchestrate pipelines across heterogeneous CI/CD platforms.

    The challenge is that organizations that have standardized on Jenkins typically have multiple instances being used by not only different IT operations teams but also owners of, for example, ancillary quality assurance processes. ReleaseIQ Essentials for Jenkins provides an alternative approach to the orchestration tools that CloudBees, the original developer for Jenkins, provides, said Param.

    Jenkins today is being advanced independently of CloudBees as an open source project managed by the Continuous Delivery (CD) Foundation, which is an arm of the Linux Foundation. Founding members of the CD Foundation include CloudBees along with Alauda, Alibaba, Anchore, Armory, Autodesk, Capital One, CircleCI, DeployHub, GitLab, Google, Huawei, JFrog, Netflix, Puppet, Red Hat, SAP and Snyk.

    ReleaseIQ Essentials for Jenkins optimizes execution of jobs and pipelines and also provides DevOps teams with a no-code graphical interface to build pipelines.

    DevOps teams can also import and execute Jenkins pipelines and jobs in addition to being able to pre-merge pipelines.
    Finally, DevOps teams are provided insights based on key metrics the platform automatically tracks on their behalf. Those metrics make it possible to quickly discover and fix pipeline issues across multiple Jenkins instances via console log aggregation, noted Param.

    It’s not clear to what degree DevOps teams that have standardized on Jenkins might swap out one orchestration tool for another. However, Param said more organizations are either wary of becoming locked into a specific CI/CD platform or now find themselves in a position where they need to continue employing multiple CI/CD platforms from different vendors. The ReleaseIQ platform provides a means for orchestrating pipelines regardless of how many different CI/CD platforms are employed, noted Param.

    It’s clear the need to embrace orchestration tools is becoming more pronounced. DevOps teams are spending too much time manually maintaining DevOps pipelines. The need for tools to automate the management of DevOps workflows is becoming critical as the number of application development projects that are simultaneously being launched continues to grow. Arguably one of the reasons that DevOps processes are not as widely embraced as they might be is the level of expertise required today to manage all the pipelines that make up a workflow.

    Of course, the level of DevOps maturity varies greatly by organization. It’s not uncommon for even different teams within the same organizations to have significantly different levels of proficiency. The challenge and the opportunity now is to provide those DevOps teams with tools that operate at a high enough level of abstraction to make DevOps accessible to every IT professional regardless of the level of programming expertise they may or may not have.

  • Perforce Melds Artifact Package Manager with Version Control Platform

    Perforce Melds Artifact Package Manager with Version Control Platform

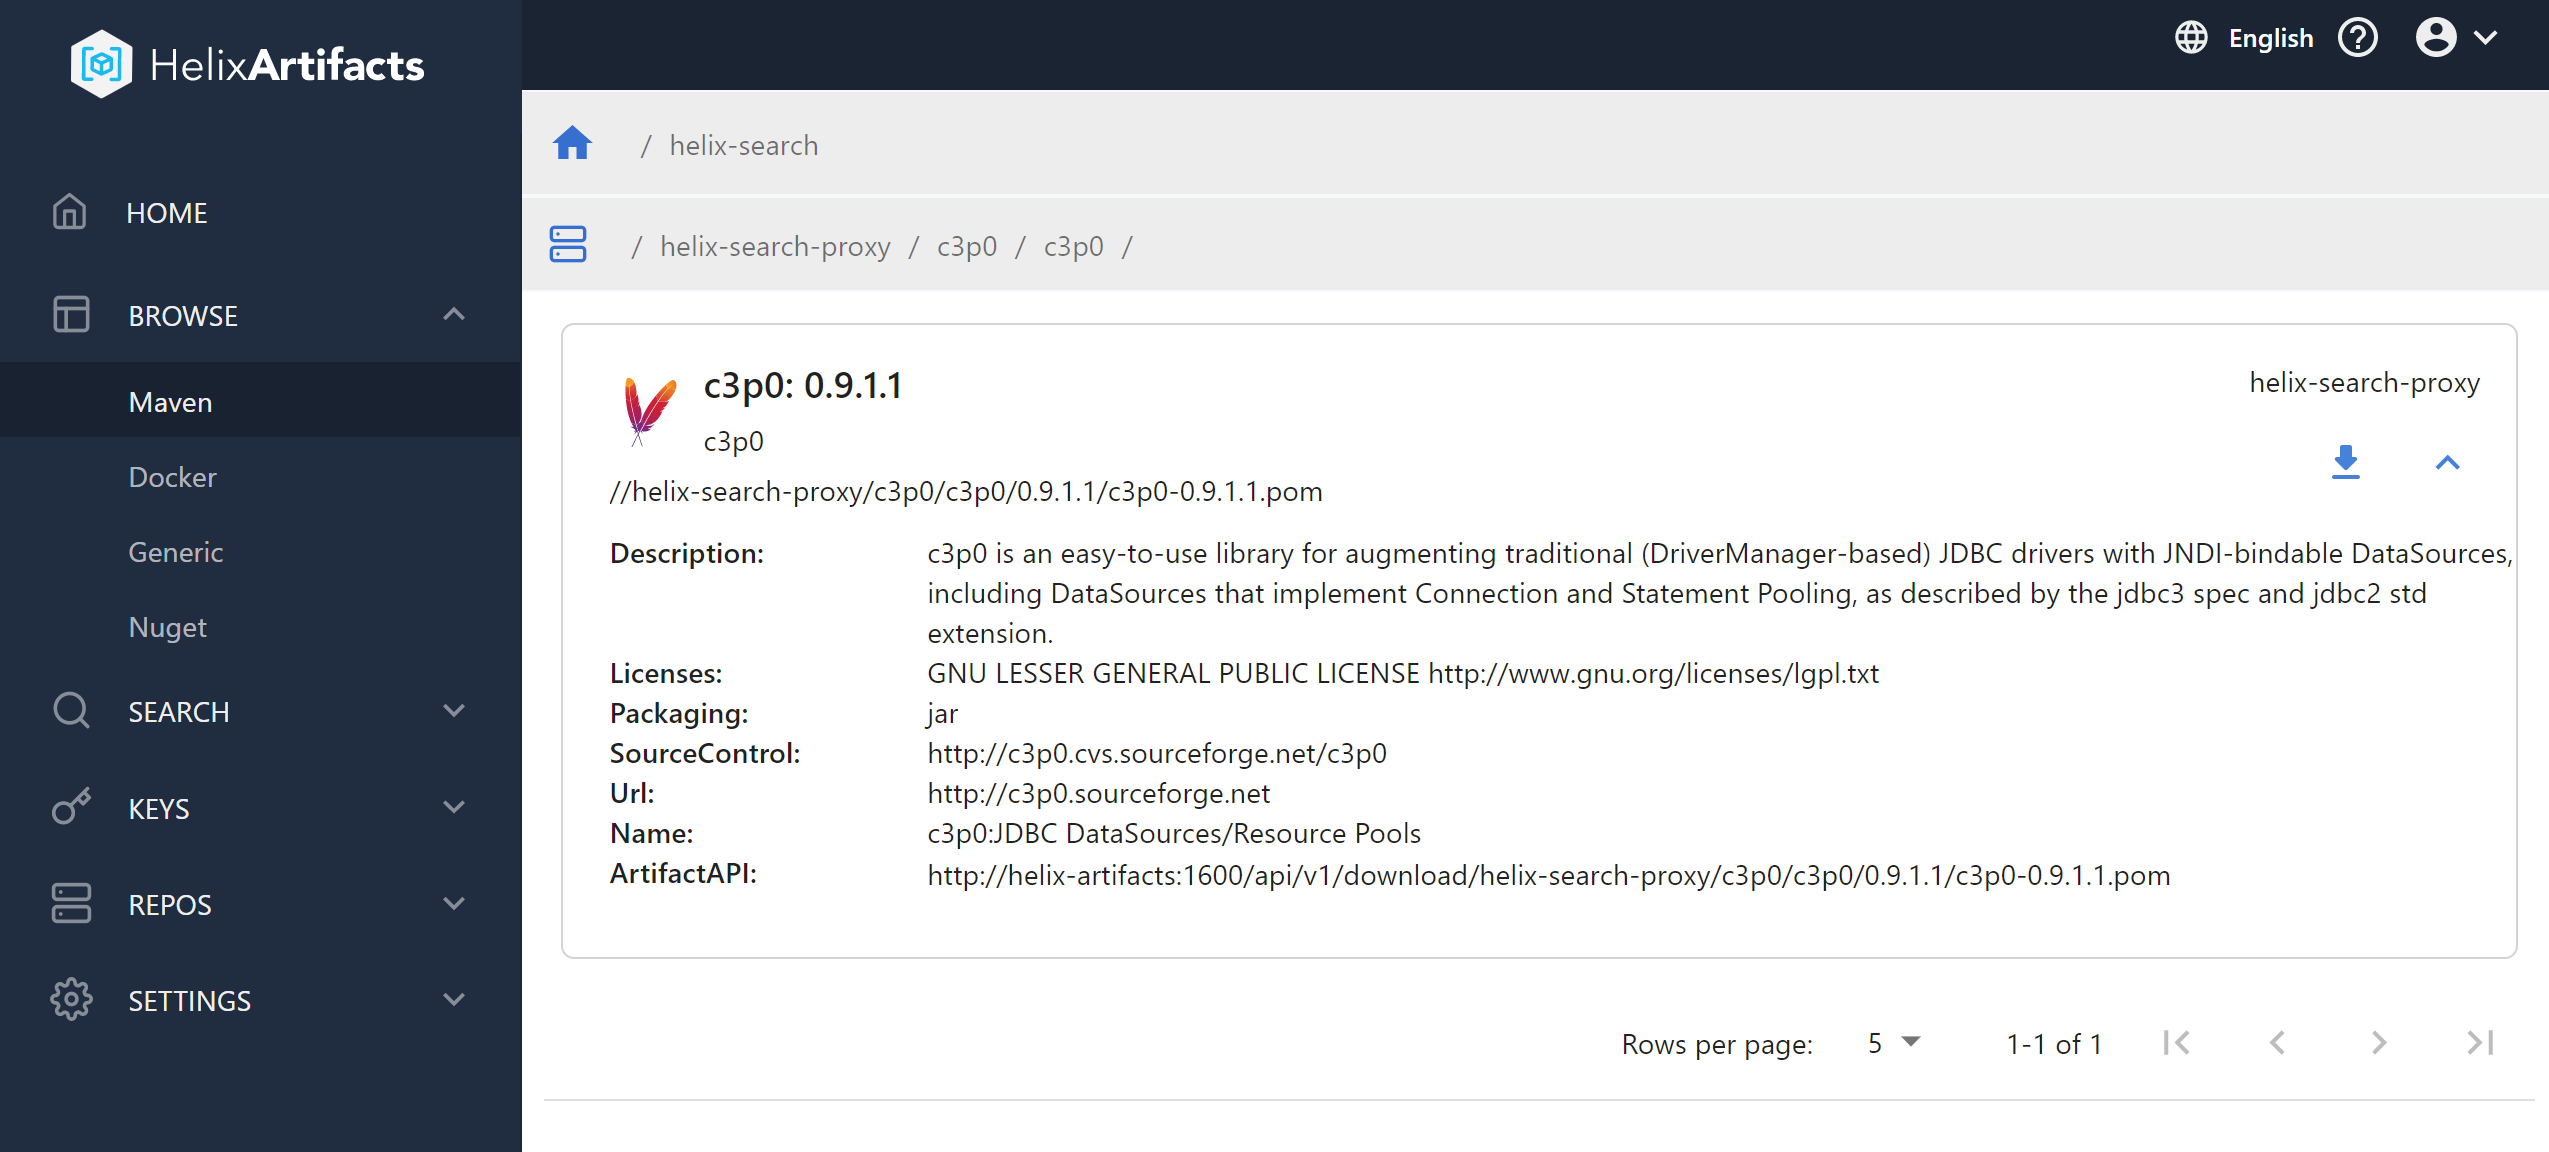
    Perforce Software has added a universal package manager, dubbed Helix Artifacts, to its portfolio that enables users of its Helix Core version control platform to store and track source code.

    Gerhard Krüger, product manager for Helix Core digital asset management at Perforce Software, said the goal is to enable DevOps teams that employ Helix Core to access a package manager without having to exit Helix Core.

    That approach also provides a more secure and cost-effective way to store, consume and distribute artifacts that also serves to improve developer productivity, he added. The ability to manage artifacts on top of a version control platform also means DevOps teams will not need to set up additional storage infrastructure or configure separate security permissions just to distribute software packages, noted Krüger.

    Perforce

    Helix Artifacts is a self-hosted package manager that functions as a translator for packages such as NuGet, Maven or Docker that enables them to communicate directly with Helix Core as well as build systems and integrated developer environments (IDEs). Helix Artifacts is made available via a per-server subscription model that costs substantially less than rival approaches to managing artifacts, Perforce Software claims.

    Most DevOps teams are trying to strike a balance between employing best-of-breed tools to build applications and the need to reduce complexity and, ultimately, cost. As such, any time a tool becomes a feature of another platform that a DevOps team uses, there will be a review of the processes being employed. Many DevOps teams are trying to reduce the amount of time they spent maintaining tool integrations.

    There’s also now a lot more focus on software supply chain security. Each new tool generally creates yet another set of credentials that need to be protected as cybercriminals continue to aggressively attempt to inset malware into applications before they are deployed in a production environment. It’s not clear to what degree DevOps teams are looking to consolidate toolchains, but given those rising security concerns, it’s only a matter of time before security teams start to ask why the DevOps toolchain attack surface is so wide.

    In the meantime, the number of organizations that have widely embraced DevOps best practices across the enterprise continues to steadily grow. Over the past decade, most organizations have had at least one application development team embrace DevOps. However, as the pressure to build software to drive digital business transformation initiatives has steadily increased since the onslaught of the COVID-19 pandemic, the need to apply DevOps best practices to accelerate application development has become more pronounced. As a result, more organizations than ever are looking to standardize their application development efforts on a smaller number of platforms to reduce friction.

    It’s too early to say whether the rate at which applications are being developed and deployed since the start of the pandemic has actually increased. The one thing that is certain, however, is the bulk of organizations are now trying to accelerate like never before.

  • Sumo Logic Extends Observability Scope and Reach

    Sumo Logic Extends Observability Scope and Reach

    During the online Illuminate user conference, Sumo Logic revealed how it is integrating capabilities it gained with the June 2021 acquisition of Sensu, a provider of open source monitoring tools, with its continuous intelligence platform in addition to adding support for data collected via open source OpenTelemetry software.

    Sensu Go, a set of tools for implementing monitoring-as-code, is now a core part of the Continuous Intelligence Platform. The company is also now making available in beta Sumo Logic OpenTelemetry Distro and Ecosystem Support, a single agent through which all logs, metrics and traces can be collected from instrumented applications. Sumo Logic is also supports the AWS OpenTelemetry Distro, an offering from AWS that provides similar capabilities. Sumo Logic has also increased the capabilities of Sumo Logic Free to include monitoring-as-code tools created Sensu.

    Bruno Kurtic, vice president of product and strategy, said as responsibility for managing applications shifts left toward developers it’s critical to provide observability capabilities that can be programmatically infused into applications. As part of that effort, Sumo Logic is now also offering Sensu Plus, which provides access to an analytics engine for the data the platform collects.

    Sumo Logic is also adding machine learning algorithms to provide more context to the alerts the platform generated via an Alert Response feature that is part of the core platform.

    The company is also adding support for the operator software that Red Hat created to make it simple to deploy Sumo Logic Continuous Intelligence Platform alongside the Red Hat OpenShift platform for building and deploying applications on top of Kubernetes clusters. In addition, Sumo Logic is also providing integration with a total of 38 either new or updated observability applications that integrate with a wide range of third-party platforms.

    Finally, Sumo Logic is extending the security observability platform it provides based on its platform to add support for containers and serverless computing functions alongside virtual machines and integrations with third-party endpoint detection and response (EDR), network detection and response (NDR), threat intelligence and managed detection and response (MDR) platforms. The company has also added or updated 26 applications for specific third-party platforms.

    Kurtic said Sumo Logic makes it possible for developers and IT operations teams alike to observe an IT environment on an end-to-end basis via a single pane of glass. In some cases, the members of an IT operations team will require a user interface to manage that environment. Developers, meanwhile, might prefer an application programming interface (API) through which observability data is made accessible from within a continuous integration/continuous delivery (CI/CD) platform.

    Regardless of the type of user, however, IT teams should not have to hire their own data science team to analyze observability data. Instead, the observability platform should embed machine learning algorithms that surface all the benefits of data science without the need to hire additional headcount, he said.

    One way or another, DevOps teams will soon routinely benefit from the additional levels of context that observability platforms provide. The challenge will then be determining how best to fix a raft of issues that many DevOps teams today simply didn’t know existed.