Category: Application Performance Management/Monitoring

  • Red Hat CEO: Out | Blind Users: Revolt | ARM: Google Joins Party

    Red Hat CEO: Out | Blind Users: Revolt | ARM: Google Joins Party

    Welcome to The Long View—where we peruse the news of the week and strip it to the essentials. Let’s work out what really matters.

    This week: Matt Hicks is the new Red Hat CEO, visual accessibility is in focus, and Google Cloud rolls out ARM instances. (more…)

  • CodeLogic Toolkit Increases Visibility Into App Dependencies

    CodeLogic Toolkit Increases Visibility Into App Dependencies

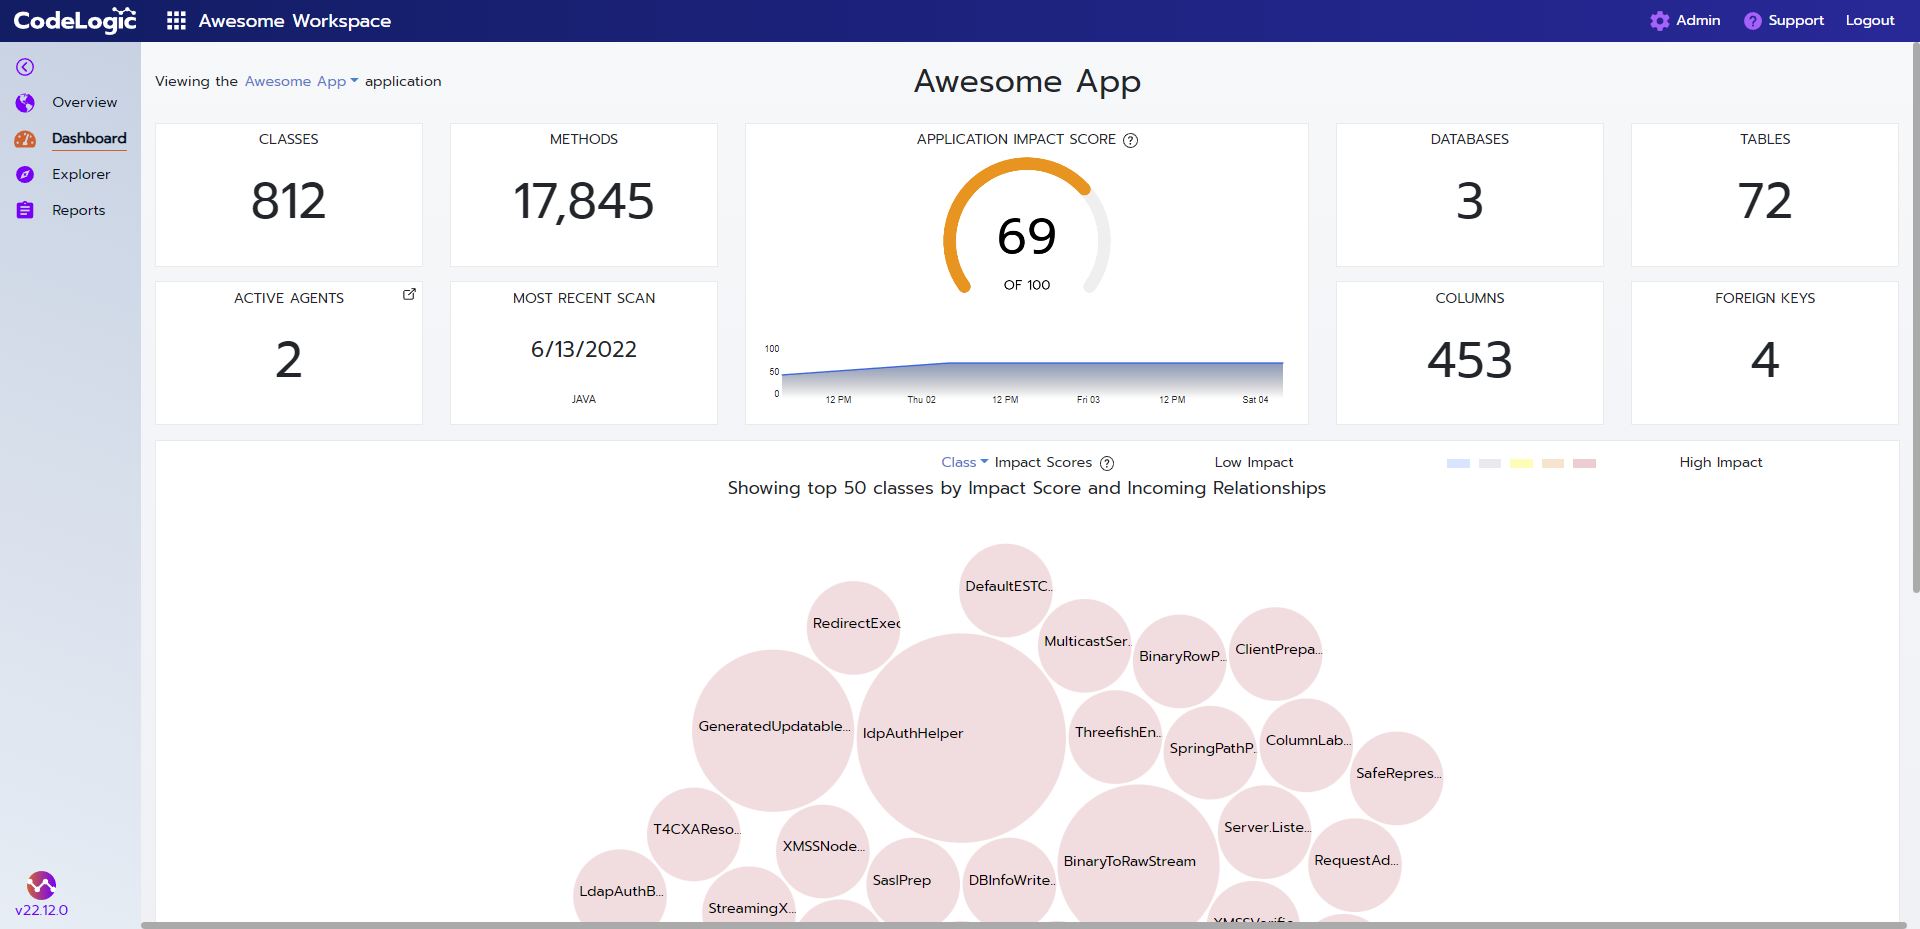
    CodeLogic launched today a toolkit that enables developers to scan binaries, runtime application behavior and database connections and then leverage graph technology to identify connections and dependencies in real-time.

    Brian Pierce, CodeLogic CEO, said the goal is to make it simpler for developers to identify the relationship between application elements to increase overall productivity and simplify the addition of new members to an application development project.

    In general, most developers add code to applications without really having much visibility into how that code might impact other components. The toolkit created by CodeLogic is an extension of the company’s existing continuous software intelligence (CSI) platform that employs server software to store and process data collected via its agent software. The goal is to make it easier for developers to directly consume those insights via a toolkit they can access directly from within, for example, an integrated development environment (IDE), said Pierce.

    As applications become more complex in the age of microservices, it becomes more challenging to understand all the dependencies between application components. Developers require greater visibility into applications to better manage the break/fix process that inevitably occurs when new code is added to any environment. The CodeLogic CSI platform provides an automated impact score for methods, classes and the overall health of an application as code is developed to provide that visibility.

    That information also plays a critical role in enabling IT teams to understand the implications any newly discovered vulnerability might have on the application environment, added Pierce.

    Overall, the level of technical debt that organizations accumulate over time saps developer productivity, he noted. The more difficult it becomes to add code to an application environment the less likely it is that developers will enthusiastically make the effort, said Pierce. Before too long, the number of updates made to an application environment starts to decline, he noted.

    Developer productivity has become a major issue simply because the number of applications that organizations now want to build and deploy is exceeding the financial resources they have available to hire or contract developers. The more time developers spend studying how an application has been constructed the less time there is to write code and drive innovation. In fact, the more frustrating it becomes to add code the more likely it becomes developers will move on to a company with much less friction involved in building and deploying applications, said Pierce.

    There are many senior IT leaders that also need visibility into application environments before approving projects. Many IT teams discover that there are multiple projects or other teams writing duplicate code or replicating existing functions. Regardless of the reason, more developers are voting with their feet when they feel their time and effort is not fully appreciated.

  • BMC Adds Support for DORA Metrics to Mainframe Tools Portfolio

    BMC Adds Support for DORA Metrics to Mainframe Tools Portfolio

    BMC this week announced it has added support for DevOps Research and Assessment (DORA) metrics within its portfolio of DevOps tools for mainframe environments.

    John McKenny, senior vice president and general manager for intelligent Z optimization and transformation at BMC, said the latest edition of BMC Compuware zAdviser now includes a DORA KPI Dashboard that aligns with the widely-adopted framework for measuring DevOps efficiency defined by an arm of Google.

    The DORA metrics track deployment frequency, failure rate, lead time for changes and mean-time-to-recovery (MTTR). Tracking those metrics is crucial for IT teams that have mainframes because they need to make sure applications continue to be deployed on the platform versus being usurped by another platform that is perceived to provide a faster alternative for builds and deployment, noted McKenny.

    BMC also added support for automated webhook notifications to its BMC Compuware Abend-AID offering. That includes diagnostic and root cause analysis to resolve defects in test and production faster. In addition, BMC provides a connector to the machine-identity management platform created by Venafi. That integration promises to eliminate certificate-related outages that can derail an application development initiative.

    In general, DORA metrics are being used to identify areas where DevOps teams can improve. It is up to each organization to determine to what degree those metrics will be used to coach teams versus enforce productivity mandates. However, given the overall shortage of available DevOps talent, few organizations are employing metrics to force DevOps teams to improve. In fact, there is no universal set of DevOps goals that every organization is trying to achieve. Rather, most organizations are trying to determine what set of DevOps best practices makes the most sense to implement given their own goals and internal culture. In the case of the mainframe, most organizations start with a few projects before they begin to employ DevOps more widely, noted McKenny.

    The metrics defined by DORA framework are, of course, only a subset of the total metrics that DevOps teams should track. BMC, for example, makes it possible to track tools usage to provide DevOps teams with insights into what tools may no longer be relevant or required, noted McKenny.

    Mainframe environments also have a long history of using waterfall-based approaches to building and deploying applications that many of them will continue to use alongside DevOps practices, depending on the type of application being built and deployed. In other instances, distributed applications built using DevOps practices are being integrated with mainframe applications that now need to be updated using the same workflow. The mainframe is no longer a platform that is managed in complete isolation from distributed computing environments.

    The major challenge is that many organizations using mainframes often overestimate how difficult it is to adopt DevOps  best practices, McKenny said. Regardless of the platform, there is no doubt the overall rate at which all applications are being built and deployed will continue to increase. The mainframe is proving to be no exception to that rule.

  • Planview Outlines VSM Strategy After Acquiring Tasktop

    Planview Outlines VSM Strategy After Acquiring Tasktop

    Planview this week announced it completed its acquisition of Tasktop, a provider of a value stream management (VSM) platform that enables DevOps teams to align their efforts more closely with strategic business goals.

    Louise Allen, chief product officer for Planview, said the goal is to tighten integration between the Tasktop VSM platform and the project management applications that Planview already provides to software development teams and business executives.

    It’s still early days as far as adoption of VSM within DevOps workflows is concerned, but as more organizations realize how dependent they are on software, they need to better align application development projects with their strategic business goals, said Allen. VSM platforms make it possible to analyze data collected from various DevOps tools and enable business and IT leaders to, for example, visualize how a delay to one project might impact revenue goals for an upcoming quarter.

    Given the current weakness in the overall economy, organizations are looking to more precisely understand the impact software development decisions will have on the business, she added. As part of an effort to address that requirement, Planview will also make it easier for its applications to consume data that was originally created in Tasktop, she explained.

    VSM enables more organizations to function like a software company—aligning application updates with revenue goals. As the number of digital business transformation initiatives being launched increases, organizations are finding they need to operate more like a software company that either manufactures something or provides a service.

    The concept of value stream management traces its lineage back to lean manufacturing methods, which called for each step of a manufacturing process to be continuously measured. As software development has evolved from being a craft to an automated process using DevOps best practices, there is growing appreciation for the value of monitoring things such as the impact of missed software development deadlines on the business.

    At its core, a VSM platform will automatically convert metrics collected from a DevOps workflow to track a set of key performance indicators (KPIs) defined by the business. Once those metrics are gathered and KPIs established, organizations are then able to apply advanced analytics to align the resources needed to achieve a strategic goal by, for example, devoting more developers to a specific project. The data collected via a VSM platform can also then be shared with business intelligence (BI) applications that business leaders typically use to manage the business.

    It’s not clear just how hard business leaders are looking for deeper insights into how software development initiatives are progressing, but at the very least, DevOps leaders need a simpler way to understand all the dependencies that exist between initiatives. Otherwise, they risk missing deadlines simply because no one realized a delay that occurred in one project had a cascading impact across multiple other initiatives. Regardless of who consumes the data generated by a VSM platform, the need to increase visibility across the software development life cycle had never been greater.

  • 5 Mean-Time Reliability Metrics To Follow

    5 Mean-Time Reliability Metrics To Follow

    Most folks working in DevOps or SRE roles are familiar with metrics like mean-time-to-recovery (MTTR). Keeping track of the average time a team takes to respond to incidents is crucial to identifying bottlenecks in the support process. It’s also something executives like to show higher-ups when sharing a snapshot of overall platform performance. However, focusing on one single metric might be missing the greater picture.

    For example, how long did it take to discover the incident? How long did it take from discovery until action was taken? What was the timeframe between filing a ticket and updating all clients that had a bug? When can you say you’ve completely resolved an issue? As you can see, there are many potential metrics that could inform software reliability and the platform engineering process. “One number is never going to tell you a complete story,” said Emily Arnott, community relations manager, Blameless.

    I recently met with the Blameless team for a closer look into mean-time reliability metrics. Below, we’ll explore the nuances behind five different types of MTTX metrics and consider the business value of keeping tabs on each type.

    1. Mean-Time-To-Detect

    Mean-time-to-detect is a measurement of how long it takes, on average, to detect that an incident is present. This often happens automatically within a monitoring system. Perhaps a tool sends out an alert when latency meets a certain threshold, for example. But, detection could also come from other sources, such as a customer complaint.

    For example, consider Log4j. Perhaps a runtime vulnerability scanning tool noticed one of your components is impacted by a novel CVE and automatically sent a notification to the appropriate team channel.

    2. Mean-Time-To-Acknowledge

    Now, just because an incident is detected doesn’t mean it’s immediately acknowledged. Mean-time-to-acknowledge, then, is a measurement of how long it takes a human being to realize the incident and begin to act on it.

    In our CVE example, this would be the time between vulnerability detection and initial response. For example, the on-call incident manager received a vulnerability notification, read the exposure details and then filed a JIRA ticket and contacted the relevant team members.

    Many factors might extend mean-time-to-acknowledge. Perhaps someone isn’t logged into Slack, or a hardware issue stalls the notification. Alert fatigue may also get in the way, or there may be a reluctance to file a ticket and introduce more toil. Depending on the severity of the incident, someone simply might not believe the alert is worth responding to.

    3. Mean-Time-To-Recover

    Now, the following metrics are a little more open to interpretation, but we’ll do our best to define each. Mean-time-to-recover is the average time it takes to introduce a temporary fix after discovering an incident.

    For example, if a particular region is experiencing outages, engineers might temporarily divert traffic to a more stable server. This is not a permanent fix, but the system recovers and operations are generally unaffected. This helps maintain the status quo while a more permanent solution is ideated, tested and applied.

    4. Mean-Time-To-Repair

    Mean-time-to-repair (or restore) is the mean time it takes to issue a permanent repair to a system after discovering an incident. In order for a system to be considered fully repaired, it has to not just be working, but working robustly.

    For example, let’s say the incident in question involves performance issues. Perhaps a patch is issued to the core branch to remove bulky code that’s causing slow load times for clients. Mean-time-to-repair introduces a more permanent solution but still might not be the complete resolution to the problem.

    5. Mean-Time-To-Resolve

    Mean-time-to-resolve can be thought of as the average time between when an incident occurs to when the issue is completely resolved. Not only is the core codebase patched, but all clients reliant upon the software have been updated, as well. Lessons are learned and mitigation plans are set to respond to similar incidents or vulnerabilities in the future.

    Mean-time-to-resolve is about resolving the incident entirely, said Jake Englund, senior site reliability engineer, Blameless. This includes addressing the underlying fundamental contributors, completing all logs that remain on the back burner and following up with a retrospective.

    Using Mean-Time Metrics

    Mean-time metrics can provide a quantitative picture of incident response performance, which can be valuable for overall business operations. Mean-time-to-acknowledge, for example, can expose gaps in the remediation process, such as cognitive strife in reporting incidents, said Matt Davis, intuition engineer, Blameless. Understanding these technical and human factors are the first step to making the resolution process swifter.

    Of course, the above metrics rely on incident data, which may not always be a top priority. According to Davis, encouraging a culture that declares incidents—even minor ones such as a configuration change—can improve knowledge sharing within a team. “If you declare an incident, you could enact more systemic change,” added Arnott.

    Limitations of Mean-Time Metrics

    These mean-time metrics do have some limitations. “A number is only one part of the story,” said Davis. As a result, teams might struggle with deciding precisely what to detect. MTTR can be a helpful metric, but it’s the context that matters, he explained. Therefore, tracking multiple metrics can help provide a more sophisticated, nuanced picture. This involves looking beyond averages to consider outlier events, added Englund.

    There are also semantic nuances between the MTTX metrics defined above. “There’s a lot of ambiguity around these words,” said Davis. As a result, organizations might compute each figure differently. Some of these figures use time-markers which may not be technically possible to track consistently, especially since each incident is unique. Demarcating the precise moment an incident began might require guestimation. You might know when a service is fully restored, but the lasting customer perception is harder to gauge.

    Also, another potential downside is that mean-time metrics could easily be manipulated or misinterpreted, whether deliberately or inadvertently. Operations leads might selectively recall specific windows when showing MTTX metrics to higher-ups, leaving out other statistics that paint a different picture.

    Treat MTTX As A Guidepost

    Improving incident response is becoming mission-critical to maintain fully-functional systems as things like outages, downtime, slow speeds and zero-day vulnerabilities can negatively impact user experience. Sometimes, these issues must be addressed immediately to maintain SLAs.

    But tracking reliability averages isn’t all that simple, and they will likely mean something different to each organization. “It’s about embracing complexity and asking the right questions,” said Davis.

    In summary, mean-time reliability metrics provide helpful insight into the ongoing state of incident response. Yet, such metrics shouldn’t be imposed as a strict target — instead, they should be viewed as an informative guidepost. “Metrics can help you find what is discussion-worthy, but it’s not a discussion itself,” said Arnott.


  • Survey Reveals High Cost of Application Modernization

    Survey Reveals High Cost of Application Modernization

    A survey of 250 software developers and architects in the U.S. found nearly three-quarters of respondents (74%) reported that the average cost of an application modernization project is nearly $1.5 million, with 79% noting that at least one of these projects has failed.

    Conducted by Wakefield Research on behalf of vFunction, a provider of a platform that automatically converts monolithic applications into microservices, the survey polled developers and architects at organizations with 5,000 or more employees that have been in business for at least 15 years and are maintaining Java applications. The survey found that the primary reasons application modernization projects failed were expectations not being set correctly (43%) and the need for organizational structural changes (37%).

    Despite the cost and inherent risks, however, the survey also found a full 92% of respondents planned to or are currently modernizing applications. Nearly two-thirds (62%) said having the right resources and tools is the key to application modernization success.

    Well over half of the respondents (58%) also noted that, on average, it takes 16 months to complete these projects, with more than a quarter (27%) noting it takes two years or more. Not surprisingly, a full 97% said they expected someone in their organization would push back on a proposed project.

    Application modernization, of course, is something of a catch-all phrase that can involve everything from providing applications with a web frontend to lifting-and-shifting them into the cloud or completely refactoring them to run natively on a cloud platform.

    vFunction CEO Moti Rafalin said that regardless of the scope of the initiative, most organizations should first pick these projects based on what makes the most sense for the business. Once identified, it then becomes critical for IT teams to have a deliberate strategy in place to achieve that goal given the high cost of failure, he added.

    Organizations would also be well-advised to determine how job roles will evolve, because one of the biggest inhibitors to application modernization is concern over how any job might be impacted, noted Rafalin.

    It’s not clear how quickly organizations are opting to modernize existing applications versus replacing them outright. However, as more organizations opt to run applications in the cloud, the level of interest in using microservices to build applications has risen sharply. The goal is to employ microservices to make applications both more resilient and secure. The tradeoff is that microservices-based applications tend to have lots of dependencies that make them more challenging to manage and secure.

    Regardless of approach, it’s more a question of when an application will be modernized or retired versus if. The level of technical debt that accrues over time for each application eventually becomes unsustainable. The issue, of course, is that most organizations don’t have the resources required to modernize every application at once, so it may take a decade or more to work through an entire application portfolio—even as that portfolio continues to grow. In fact, as technologies continue to evolve, it may turn out that application modernization is not a task to be completed as much as it is a permanent state of IT affairs.

  • Dynatrace Adds Synthetic Tests to Validate App Experiences

    Dynatrace Adds Synthetic Tests to Validate App Experiences

    Dynatrace today extended the application release management capabilities it provides to include synthetic tests for validating and assuring user experiences.

    Saif Gunja, director of product marketing for Dynatrace, said the user experience validation and user experience assurance (UXA) capability spans everything from application availability and performance to actual engagement with specific features based on the service level objectives (SLOs) defined by a DevOps team.

    Dynatrace views application release management as an extension of its observability platform, said Gunja. While application release management has historically been viewed as an extension of a continuous delivery (CD) platform, Gunja said that observability platforms—such as the Dynatrace platform, which is infused with a Davis artificial intelligence (AI) engine—provide the visibility required to better automate the process.

    In fact, as DevOps continues to evolve, it’s apparent that CD and continuous integration (CI) are becoming more loosely coupled as DevOps processes mature, said Gunja. Most organizations have yet to implement CD simply because it’s been too difficult to achieve. Each platform that applications have been deployed is unique. Dynatrace provides the foundation for automating application release management via the agent software it makes available to instrument applications, said Gunja.

    It’s not clear whether DevOps teams are reevaluating their approach to application delivery, but Gunja noted that much of the interest in the Dynatrace approach is coming from organizations that have already installed the Jenkins CI/CD platform. The number of extensions that have been built and that need to be supported has created a level of technical debt that is unsustainable for many DevOps teams, he noted.

    Many IT leaders concluded they would rather allocate more resources to building applications than maintaining DevOps platforms, added Gunja.

    Most DevOps teams are committed to ruthlessly automating as many IT processes as possible. Observability has always been a core DevOps tenet in pursuit of that goal. Applications that are not instrumented can be programmatically managed. The issue is that providing observability isn’t enough—DevOps teams need to be able to take actions across the entire software development life cycle based on the data collected by the observability platform, said Gunja.

    Obviously, it’s still early days as far as observability is concerned. While application performance management (APM) platforms have been employed for decades, it’s only recently that observability platforms capable of correlating application and IT infrastructure data have emerged. Thanks to the rise of open source agent software, it’s also becoming less costly to instrument IT environments. The challenge, of course, is, as always, deploying and maintaining all that agent software.

    Regardless of the approach to observability and DevOps, it’s clear that IT teams will soon have a lot more visibility into their IT environments. The days when IT teams determined the root cause of an IT issue by process of elimination are finally coming to an end. Observability, however, is not an end in itself, but instead is the end of the beginning of a previous DevOps era.

  • Quality Is a Top Challenge for Data-Driven Projects

    Quality Is a Top Challenge for Data-Driven Projects

    Software systems continue to produce more and more data. And making use of it has proven benefits — so much so that many analysts have, over the years, referred to data as the new oil. As a result, the majority of organizations are expending effort into refining their data — in fact, a recent study found that 84% of organizations have either already deployed or have data-driven projects on their roadmaps.

    Corporations like Facebook and Google are the poster children for business models that harvest and monetize end-user data. However, this is only one aspect; valuable data is being produced by internal systems as well, which, if leveraged correctly, can provide insight into software observability and increase process automation for DevOps teams and developers. For example, time-stamped application logs are necessary for informing SLOs to maintain reliability standards. There is an ongoing parallel investment into AI/ML deployed with cloud-native tools to act upon production data to drive further business growth. As such, 63% of IT decision-makers say new revenue opportunities have emerged due to data and analytics.

    The 2022 Data & Analytics Study, conducted by Foundry (formerly IDG Communications), explored how data-driven initiatives continue to be an important investment area for executive leadership. Below, I’ll review the key results from the survey to consider how organizations can continue to make intelligent decisions now and into the near future.

    The State of Data-Driven Investments

    We undoubtedly live in a data-driven world, and investment in related projects continues to rise. More than half (55%) of IT decision-makers plan to increase their data-focused investments — the report found the average spend to be $12.3 million in the coming year. This figure rises to an average of $23 million for financial services, which makes sense given the nature of modern banking.

    Naturally, the use of analytics platforms is increasing in tandem with the amount of data generated. In terms of specific analytics tools, 50% of respondents said they used business intelligence platforms while 47% used relational databases and 19% planned to invest in them in the next one to two years.

    We’re also noticing an increasing use of cloud-based solutions. For example, 27% of an organization’s data analytics workloads now run in the cloud. The report also found an uptick in cloud-based enterprise-scale data warehouse technologies, an area that shows signs of increasing in the coming year.

    Common Objectives

    So, what are the most common driving factors behind these types of projects? Well, automating internal business processes is the top goal for data-driven projects—half of IT leaders described this as a primary objective. This is closely followed by other ambitions such as improving customer insights (46%), aiding customer support (43%) and automating IT operations (43%).

    In terms of type, transactional data tends to be the most useful—54% of companies are using transactional data in their data-driven projects. This includes consumer purchasing behaviors such as sales, returns and credits. The next-most-common type is machine-generated data, which includes information from logs, sensors, telemetry, networks, security systems and/or IoT devices. The third-most-common type is customer profile information.

    Data has a powerful impact in a business context as a means to refine existing digital products. Other respondents added that a data-driven approach to DevOps helps increase visibility and drives continuous improvement.

    Data Quality: Highest Ranked Challenge

    Undoubtedly, particular challenges remain. The greatest hurdle is retaining data quality—41% of organizations reported dealing with this issue. Quality may be poor because data is unstructured or incompatible with other sources. Other widespread challenges include governance issues and integrating data from multiple sources.

    For those undertaking data-driven projects, 44% said they lacked appropriate skillsets, such as analytics training, data management, security, business intelligence and integration expertise. Companies also often faced funding and talent-related quandaries when beginning data-driven projects. For example, 26% of small-to-medium-sized businesses lacked the necessary funding to take on data-driven projects, according to the research.

    Another challenging area (that I’ve covered previously) is optimizing how data is collected and stored. As cloud storage fees rise, organizations will likely want to refine retention and resolution to avoid creating unnecessarily large, expensive data lakes.

    Rising Deployment of AI/ML

    AI/ML is already well-established as a way to advance the use of data. More than half (54%) of companies used predictive analytics or planned to incorporate it into their systems in the next 12 months. Just under one-third (31%) also either used or planned to use anomaly detection in the future. These areas along with other functionalities (such as natural language processing and predictive analytics) can be used to aid applications such as process automation, decision support, customer analysis, virtual agents and others.

    The industry is at an exciting moment for leveraging data in DevOps. Data is becoming more and more accessible to enable DevOps with a full-stack picture of the application life cycle. To direct future engineering investment, data-driven decisions will rely on things like performances and usage habits. Thus, it’s an interesting time to consider how you might leverage data for greater process automation and software development fluidity.

    The 2022 Data & Analytics Report surveyed 872 IT decision-makers (ITDMs) from around the globe working in various industries. The respondents’ average company size was about 12,000 employees. To view the report for more insights, you can pick it up here.

  • ServiceNow Adds Lightstep Notebooks to Visualize Observability Data

    ServiceNow Adds Lightstep Notebooks to Visualize Observability Data

    ServiceNow today added a visualization tool to its Lightstep observability platform that will make it simpler for DevOps teams to correlate metrics, logs and traces.

    Ben Sigelman, general manager for Lightstep at ServiceNow, said Lightstep Notebooks will make it easier for DevOps teams to make sense of the massive amounts of data collected by the observability platform.

    Lightstep Notebooks is an extension of the Change Intelligence analysis engine that ServiceNow already makes available within an observability platform it acquired in 2021.

    Included with Lightstep Notebooks are a set of ad hoc charts that include access to heat maps and time-series data with trace exemplars using the database at the core of the Lightstep observability platform.

    An instantly generated investigative path also makes it simpler to identify the root cause of any issue, and each instance of Lightstep Notebooks can be shared with other members of the IT organization via an embedded link. Finally, 100% of trace data can be retained for up to three days.

    Sigelman said the ability to share Notebooks via embedded links will also help bridge the divide between DevOps and IT service management (ITSM) teams that often need to collaborate to resolve an IT issue.

    Naturally, the level of collaboration between those teams tends to vary widely by organization. However, as DevOps best practices are more widely embraced, the number of organizations that are trying to achieve that goal continues to steadily increase. Earlier this year, ServiceNow added an incident response offering to orchestrate on-call escalation, group alerts and provide analytics in further pursuit of that goal.

    Observability platforms aggregate the collection of logs, metrics and traces in a way that makes it possible for DevOps teams to query that data. The goal is to make it easier for DevOps teams to both identify the root cause of an IT issue and pinpoint any anomalies that might disrupt an application environment. The goal is to eliminate the need to convene a “war room” meeting that requires IT teams to suffer through the painstaking process of elimination to identify the root cause of an issue.

    Of course, before an IT environment can be observed, it needs to be instrumented. Thanks to advances in the form of open source agent software being advanced via the OpenTelemetry project managed under the auspices of the Cloud Native Computing Foundation (CNCF), it’s becoming less costly to instrument IT environments. That’s especially critical at a time when more DevOps teams are deploying microservices-based applications that are more complex to manage than legacy monolithic applications. While generally more resilient, the dependencies that exist between the microservices that make up an application can be difficult to identify without the aid of an observability platform.

    As a core DevOps tenet, the need for observability and instrumentation has always been apparent. The challenge has been finding the best way to achieve that at an acceptable cost, Fortunately, there is now no shortage of observability platforms. The only remaining issue is to determine which one best fits within the construct of the organization’s defined DevOps workflow.

  • Cloudflare Outage Outrage | Yet More FAA 5G Stupidity

    Cloudflare Outage Outrage | Yet More FAA 5G Stupidity

    Welcome to The Long View—where we peruse the news of the week and strip it to the essentials. Let’s work out what really matters.

    This week: Cloudflare suffers another huge outage while the FAA and FCC still disagree over 5G/NR near airports. (more…)