Category: Application Performance Management/Monitoring

  • JFrog Aims to Push DevOps to the Edge

    JFrog Aims to Push DevOps to the Edge

    At its swampUP event, JFrog launched a JFrog Connect platform for updating, managing, monitoring and securing remote Linux and internet of things (IoT) devices.

    The JFrog Connect platform is based on a lightweight agent JFrog gained last year with the acquisition of Upswift and that has now been integrated with the JFrog Artifactory repository. DevOps teams can now use a low-code tool to build flow logic that is integrated with a Git repository in addition to triggering a rollback to ensure a device returns to its previous known software state when necessary.

    DevOps teams will also be able to connect to a wide range of Linux-based IoT devices from anywhere in the world and then manage and monitor them in real-time by name, description or tags.

    JFrog CTO Yoav Landman said in the near future, DevOps teams will find themselves building and deploying applications that will not only be deployed on fleets of endpoints at the network edge, but also will be continuously updated.

    Historically, those endpoints have been managed mainly by operations technology (OT) teams, but it will soon be up to DevOps teams to automate the management of those platforms down to an individual container using the lightweight agent created by Upswift, he said.

    The number of application workloads being deployed on edge computing platforms is rising sharply as organizations seek to process and analyze data closer to the point where it is being created and consumed. In fact, that shift is at the core of digital business transformation initiatives that depend on edge computing platforms and devices running, for example, IoT applications that process data in near-real-time.

    The challenge today is in many cases organizations lack the ability to consistently deploy software on edge computing platforms, which results in the creation of a hodgepodge of homegrown tools to manually deploy software on edge computing platforms. There is a clear need to raise the DevOps bar to address edge computing requirements, said Landman.

    It’s too early to say just how much software will be deployed on the edge, but there may come a day when there is more software at the edge than there is in the cloud. In the meantime, the line between edge computing and cloud computing continues to blur. Many more DevOps teams will soon find themselves managing thousands of distributed endpoints from a central cloud.

    In the meantime, DevOps teams should expect to find themselves working more closely with OT teams that generally have a significantly different culture. Many of those OT teams are just now coming to terms with the implications of connecting endpoints to the internet. The need to continuously update the software on those platforms is not typically the first issue that comes to mind for them. Today much of the software running on edge computing platforms is rarely updated. In the future, however, that software is likely to be updated at a rate that many OT teams are not ready to envision much less manage.

  • Go Language is Popular? | VMware Sells to Broadcom? | Unlimited PTO?

    Go Language is Popular? | VMware Sells to Broadcom? | Unlimited PTO?

    Welcome to The Long View—where we peruse the news of the week and strip it to the essentials. Let’s work out what really matters.

    This week: Golang goes from zero to hero, will Broadcom buy VMware? And limitless vacation is still a Thing. (more…)

  • DevOps and Hybrid Cloud: Life in the Fast Lane?

    DevOps and Hybrid Cloud: Life in the Fast Lane?

    Scream if you want to go faster! When it comes to a dual hybrid-cloud-and-DevOps rollout, most organizations would admit they’re eager to get going a little bit faster. But what started so enthusiastically can turn to frustration (and a different kind of screaming starts) when they’ve accelerated into this major transformation without considering all the necessary elements.

    The benefits are clear. Hybrid cloud backed up by DevOps is an efficient vehicle for change. A robust DevOps platform can be a make-or-break factor in developing a hybrid cloud strategy that goes the distance. Together, they are a force for transformation, and if organizations aren’t already implementing both DevOps and hybrid cloud, they should be asking themselves why not.

    It is true that the move to hybrid cloud is a different journey for cloud-enabled organizations than it is for cloud-native ones. The trip is harder for cloud-enabled, particularly for larger enterprises. Increased release frequency requires tighter alignment and collaboration than is traditionally seen between lines of business, development and IT operations, and this, in turn, drives the need for enhanced collaboration, automation and information transparency.

    But although the transition might be harder, it must be seen as inevitable. Organizations could wait another year, maybe a little more, but the transformation of technology and business is going to happen—so why not get started? In the first of two articles, I’m going to take a look at what needs to change so that organizations can start living life in the hybrid cloud and DevOps fast lane.

    A Cultural Phenomenon

    As has been covered in these pages in some detail already, the move to hybrid cloud backed by DevOps is doomed to fail if organizations think all they need to worry about is tooling and hiring. It’s not. Underlying both of these transformations is a sweeping cultural change. DevOps is about agility, trust and autonomy, and so is hybrid cloud.

    Most of all, though, DevOps and hybrid cloud are a commitment to enhancing an organization’s developer experience (DevX), and that’s not something that can be achieved with simply a ticketing tool or by adopting a GitOps approach. DevX means autonomous, unbound movement. It means empowerment, user experience and self-service. These are changes that can only happen with a successful change in business culture, not a tool. And this is an important starting point that many organizations are still struggling to understand.

    The People Problem

    People are another well-worn topic, but one that continues to present a major challenge. The cultural transition required to successfully implement DevOps can, theoretically, start with just one person. But for a successful outcome, it actually requires long-term change as deeply-ingrained beliefs are disbanded and tribal loyalties are broken down.

    For instance, many believe that implementing DevOps requires hiring new people. That belief embraces two fallacies: One, that organizations will be able to hire the teams they need and two, that DevOps is just a job title. As we know, a good DevOps team is not hired, it is developed through the melding of development and operations. The old silos, where devs developed and ops operated, is a relic from less-enlightened times.

    Today, it requires learning how to build automation, often open source, while managing on-premises, private and public cloud infrastructure. DevOps is a philosophy that seeks to help others, and with that comes the need for collaboration, encouragement, persuasion and other soft skills.

    Security and Privacy Are not Straightforward

    Moving to a hybrid cloud means that more care needs to be taken with regard to security and privacy. One of the main problems is that it’s no longer enough for security teams to reign from on high. With control moving from the server room to the cloud and from highly-siloed ops engineers to the whole team, security policies also need to change. Competent developers will make the right decisions, but they need the right bottom-up tooling that takes their decisions from theory to reality and safeguards those who aren’t as aware.

    These must be a catalyst to make organizations sit up and take a long look at what security in the age of cloud, containers and microservices really means. If the simultaneous move to DevOps and hybrid cloud is that catalyst, then so be it. Just as DevOps is revolutionizing the way teams approach their work, DevSecOps is going to revolutionize the way they look at security.

    Security shows its face at various stages of infrastructure: When a cloud organization is created and structured; when a vault is integrated to ensure that key passwords are secured and even when a pipeline is launched that triggers dedicated security software. This isn’t an exhaustive list, but it illustrates how organizations need to start taking a methodical, step-by-step look at security in their hybrid cloud.

    What About GitOps?

    Gartner recently found that the average company uses 28 infrastructure tools. That’s simply too many to be handled and understood by one person. Even specialist DevOps engineers can’t be experts in all the cloud providers, OpenStack and VMware. Other studies showed that a developer generally only uses 5% of their Git repositories or an average of five repositories.

    The mistake lots of companies make is thinking that suddenly shifting to using APIs with a GitOps approach is adequate to handle the change to hybrid cloud. It’s not, and can actually be detrimental to DevX. Why? There’s too big a gap—it’s like just doing a long weekly run the day before a marathon. You might start, but you’ll be severely compromising your ability to meet your goal. Even DevOps engineers struggle to maintain a single source of truth and well-maintained reusable repositories.

    The solution is to plan for the long term. It’s not realistic to believe that one or two DevOps engineers can be the saviors of a hybrid cloud approach. There are far too many tools, best practices and options—between Ansible, Terraform, Kubernetes and Concourse CI/CD to name just a few—to be managed by a handful of devs, no matter how talented they are.

    That’s why the true way to hybrid cloud mastery lies in the ability to get the whole tech team pulling in the same direction, collaborating, upskilling and leveraging their strengths to support the parts that make the whole. This might sound like a pipe dream, but there are companies out there talking the talk and walking the walk.

    Start Your Engines

    It is futile to tell an organization exactly how to get started since many are already taking the first steps and every organization’s situation is unique. There is more to cover; in the next installment, I’ll be taking a look at areas like FinOps, automation and cloud waste. Hopefully, you’ll see the fast lane is clear up ahead.


  • Datadog Adds Support for OpenTelemetry Protocol

    Datadog Adds Support for OpenTelemetry Protocol

    At the KubeCon + CloudNativeCon Europe 2022 event, Datadog announced it made support for the OpenTelemetry Protocol (OTLP) generally available in the agent software it provides to instrument applications.

    Ilan Rabinovitch, senior vice president of product and community at Datadog, said that capability eliminates the need to install a separate OpenTelemetry collector to aggregate metrics, logs and traces from applications instrumented using the open source OpenTelemetry libraries being advanced under the auspices of the Cloud Native Computing Foundation (CNCF).

    The Datadog Agent can already collect application profiles, network data and infrastructure metrics via more than 500 integrations provided by Datadog. OpenTelemetry extends that capability with a set of application programming interfaces (APIs) and a wire protocol for instrumenting applications.

    Datadog is the latest in a series of providers of observability platforms that added support for the OpenTelemetry project that continues to gain momentum. The goal is to make it less costly to instrument applications using open source agent software that surfaces a consistent set of interfaces. Previously, each observability platform provider developed their own agent software that DevOps teams would need to install. Datadog is making a case for agent software that, in addition to collecting data from existing applications, is now compatible with the OLTP protocol created by contributors to the OpenTelemetry project.

    The issue that DevOps teams will need to come to terms with is that while OpenTelemetry agent software is free, many of them have already installed proprietary agent software to instrument applications. That agent software can often provide additional context that is not yet available in OpenTelemetry. History, however, shows that, in time, open source projects with larger numbers of contributors will outpace the ability of any single vendor to innovate.

    One way or another, DevOps teams will be instrumenting more applications as more microservices-based applications are deployed. The dependencies that exist between microservices make it too difficult to manage an application environment without additional instrumentation. The goal within many DevOps teams is to eventually replace the hodgepodge of monitoring tools that track a limited set of pre-defined metrics with an observability platform that not only aggregates metrics but enables DevOps teams to launch queries and surface IT issues before they become a major issue. In some instances, the rationalization of monitoring tools will help justify the acquisition of an observability platform.

    Observability, of course, is one of the core tenets of any set of DevOps best practices. Achieving it, however, has always been a challenge. Rabinovitch said an observability platform that regularly surfaces critical IT issues without requiring DevOps teams to launch queries to search for anomalies will eventually win the battle for observability supremacy.

    In the meantime, there is already no shortage of observability platforms. The challenge will be determining which one enables the highest level of instrumentation at the most reasonable cost.

  • DevSecOps Deluge: Choosing the Right Tools

    DevSecOps Deluge: Choosing the Right Tools

    In the last few years, DevSecOps has become the security process of choice for many forward-thinking enterprises. 

    These organizations have come to understand that fixing bugs in the latter stages of product and application development offers no favors to anyone but cybercriminals. So, they have overhauled traditional processes and united development, operations and security teams to form DevSecOps where the teams now work in tandem, cooperating to embed security into the entire process of application and software development.

    The benefits of this are clear; finding and fixing bugs early closes doors on cybercriminals while bringing peace of mind, cost savings and better products to customers. However, one of the challenges many organizations face when transitioning to DevSecOps is making the process seamless, ensuring it doesn’t slow down the software development life cycle, make security checks more cumbersome or cause frustration among teams. 

    Security teams need to ensure their DevSecOps program is delivering value to the culture of the organization while speeding up time-to-fix, capturing the right metrics, and categorizing and prioritizing issues based on their risk so that nothing goes live that could cause major damage.   

    Additionally, they also need to select the correct DevSecOps toolkit to carry out application security testing while ensuring the tools easily integrate into software development and can be used across multiple projects. When identifying tools for testing, DevSecOps teams are often overwhelmed by the huge range and volume available, which makes choosing which ones to use and learning how to use them a minefield, even for those with the right training and know-how. 

    A DevSecOps automation program needs lots of technical tools and cultural aspects to come together to make it work. Security teams need static analysis tools to check the code, third-party library analysis to check the dependencies, separate analysis to check the infrastructure-as-code (IaC) configuration, scanners to check containers for issues, tools to test the running system, cloud security checks and infrastructure testing for patches and ports. They also need to match these tools up to the right technology each team is using and keep up with the constant changes.

    Given all of these complexities, how can DevSecOps teams overcome these challenges and build out an effective DevSecOps program with the correct toolset? 

    Here are some top tips to help them along the way.

    Keep Security Processes Flexible 

    Your teams are going to be using different technology stacks, different languages, frameworks, and so on. If you tie your process too tightly to a few tools, it’ll be harder to slot in new checks when things change. Remember that the aim is a consistent, repeatable security process with the right visibility—the technical tools feed into that, but they are not the whole process. What security checks will you need in 12 months that you don’t have now? What about 36 months? These are questions that must be asked continuously. 

    Automation is Your Friend

    If development pipelines are running smoothly and automatically, then any manual security steps are not going to fit in with the process. Automating security tools together—from orchestrating their running to aggregating their responses and managing issues—will save a lot of time and give you the results you need in line with your releases.

    Keep an Eye On Your ROI

    It’s very common for big-ticket commercial tools to be underused; you have the licenses for repeated testing and you have frequent code drops, but the processes or the integrations mean testing isn’t applied as often as needed or the results take time to collect and process. Explore ways to bring commercial tools easily into the existing processes.

    There’s No Such Thing as a Free Lunch

    The open source community provides great security tools, but remember: There is a cost associated with the time it takes your teams to use them and to manage the outputs. From developers learning how to run them to the time it takes to actually run them or extract the results or manage false positives—these aren’t free. A ‘free’ tool that costs two hours of work every release might not be worth it.

    DevSecOps is All About Collaboration

    Weaving security checks into development processes, CI/CD pipelines, ticketing systems and sprint meetings help security to be part of the development process, but not every developer is—or wants to be—a security expert. Think about how the aims of development and security can meet in the middle. How can developers include security without much effort or thought? How can security help supply the tooling and help triage issues in developer pipelines? How can the process conform to auditors’ tools and with correct profiles, not just turned down to zero to avoid reporting issues? How can security add value at scale to help developers fix issues faster regardless of the tooling being used?

  • New Relic Expands Scope of Observability Reach

    New Relic Expands Scope of Observability Reach

    At its Futurestack conference, New Relic announced it expanded the integrations and tools it provides for its observability platform and added its first cybersecurity tool.

    The company now provides more than 470 integrations with cloud services, open source tools and other enterprise technologies, with support for offerings from Akamai, Atlassian, CircleCI, Cloudflare, Netlify, PagerDuty and Postman now being added to its Instant Observability platform. The company has also added the ability to now collect logs alongside metrics and traces within its Application Performance Monitoring (APM) offering.

    Finally, New Relic has deepened its cloud ties with Microsoft, added a guided user onboarding interface, support for a wider range of instrumentation methods, tighter integration with Kubernetes and, for the first time, is branching out into the realm of cybersecurity via a New Relic Vulnerability Management service that is being added to its software-as-a-service (SaaS) portfolio.

    Ishan Mukherjee, group vice president for product go-to-market at New Relic, said New Relic Vulnerability Management is the start of a larger effort to enable IT teams to leverage the observability data they already collect via the New Relic platform to drive the adoption of DevSecOps best practices. Legacy approaches to vulnerability management create yet another silo of data that only further aggravates cybersecurity blind spots, he noted. New Relic Vulnerability Management aggregates data collected via its agent software and integrations with a wide range of platforms to provide a unified view of the overall security posture of an IT environment, Mukherjee added.

    It’s still early days as far as adoption of observability platforms is concerned, but it’s apparent that platforms that unify the collection of metrics, logs and traces across both applications and the IT infrastructure they run on are transforming how IT is managed. Most DevOps teams today are able to continuously monitor IT environments using tools that track a set of pre-defined metrics; observability platforms make it possible to aggregate data so that DevOps teams can launch queries that help them uncover the root cause of an IT issue. That capability is increasingly becoming critical as IT environments—thanks, in part, to the rise of microservices and cloud computing environments—become too complex for IT teams to manage using legacy tools.

    The challenge is that most IT teams are not quite sure what questions they should ask to get the most value from investment in an observability platform. Observability platforms that accurately surface issues without requiring much intervention from IT teams are likely to gain the most traction, as the competition among providers of these platforms intensifies.

    In the meantime, organizations might want to start reevaluating roles within their IT teams as it becomes simpler to collaborate around a single source of data. The days when IT teams had to triage issues using disparate tools that surfaced conflicting data may finally be coming to an end. As such, it should become possible for a team of IT professionals to manage a wider range of processes across an extended enterprise IT environment.

    Naturally, it may be a while before observability platforms drive wholesale reorganizations of IT teams, but it’s now more a question of when rather than if that day will come.

  • Splunk Survey Surfaces Gains in Observability

    Splunk Survey Surfaces Gains in Observability

    A global survey of 1,250 observability practitioners, managers and other experts published today by Splunk found that sophisticated observability practitioners are able to cut downtime costs by 90%. That figure is based on an estimated cost of $23.8 million annually for comparative newcomers to $2.5 million. However, only 9% of respondents are advanced enough to be considered observability leaders compared to 59% that are still beginners.

    Those leaders reported they are seeing a 69% better mean-time-to-resolution (MTTR) for unplanned downtime or performance degradation thanks to investment in observability. The survey also noted those same organizations launched 60% more products or revenue streams from application development initiatives in the last year.

    Observability has always been a core DevOps tenet, but achieving and maintaining is a challenge. Most DevOps teams today aspire to be able to maintain some level of continuous monitoring. However, as it becomes easier and less costly to instrument applications, interest is rising in observability platforms that make it simpler to launch queries and investigate anomalies.

    Spiros Xanthos, senior vice president and general manager for observability at Splunk, said observability platforms are clearly driving down the cost of downtime. There is also a clear correlation between organizations that have embraced observability and the number of microservices-based cloud-native applications that have been deployed, he noted. In effect, increased complexity is driving organizations to turn to observability platforms to manage IT environments in the age of the cloud, said Xanthos.

    The survey found 75% of respondents have multiple cloud-native applications that run in multiple environments. Just over one-third (34%) of internally developed applications are based on microservices constructed using containers, with 28% of respondents reporting they exclusively run cloud-native applications on public cloud infrastructure.

    Overall, the survey also found that two-thirds of leaders reported their visibility into application performance is excellent compared to 44% of beginners, while 64% of leaders reported that visibility into their security posture is excellent compared to 42% for beginners.

    The survey also found 59% of leaders can push code to production on demand for most internally developed applications compared to 28% of beginners. A total of 41% of leaders said they can detect problems associated with internally developed applications within minutes compared to 20% for beginners.

    It’s still early days as far as adoption of observability platforms is concerned but, theoretically, IT should become easier to manage even as the number of platforms employed continues to expand. Advances in analytics and artificial intelligence (AI) are improving the signal-to-noise ratio so that not only are more issues being surfaced sooner but that more trusted recommendations are being made, said Xanthos.

    Observability is, of course, a journey. Most organizations are not even quite sure what type of questions they should formulate to get the most value from investment in an observability platform. Organizations should start small, with a finite project to gain an understanding of how to leverage observability more broadly as they gain more maturity, said Xanthos.

    Regardless of the approach to observability, the one thing that is certain is that traditional IT monitoring is no longer sufficient in an era where IT environments get more complex by the day.

  • Increasing Use of SLOs to Enable Observability

    Increasing Use of SLOs to Enable Observability

    Observability is a growing discipline among most IT and operations departments. To release stable software faster, operators need continuous visibility into metrics like performance, uptime and availability. As a result, engineers are increasing their use of service-level objectives (SLOs) across the board—a recent study found that 82% of companies are increasing their use of SLOs.

    SLOs enable deep visibility into specific applications’ performance and are often used by site reliability engineers (SREs) to ensure quality and avoid service interruptions. Not only that, but various teams are correlating SLOs to aspects of the business to reduce cost and help direct decision-making. But while many environments have visibility, there are still gaps present.

    Nobl9 recently released a global survey of IT professionals and executives that tracked the state of service-level objectives in 2022. Below, we’ll look at the key findings from the report and consider what they mean for the state of SLOs and observability in general.

    State of Observability and SRE

    In general, site reliability engineering is still maturing across organizations. Though only 31% of companies have adopted SRE, it’s slated for much future growth, as 46% said they plan to embrace SRE in the future.

    These operators are now faced with many cloud-native observability tools, which are producing a sea of data in the form of metrics, logs and traces. A full 39% of companies use anywhere from six to 10 observability and monitoring tools and 35% use more than 11.

    With so many tools now deployed, who is using this observability and monitoring data? Namely, at 74% of companies, observability data support operational requirements. Operations teams are the ones most likely to use SLOs to monitor uptime, performance and overall efficiency. After operations teams, security teams also use this observability data (71%), which makes sense as SLOs can inform incident response. Other areas that follow are customer support, compliance and capacity planning.

    One interesting finding is that only 42% of companies use SLOs for service-level agreement (SLA) adherence. This indicates that SLOs are most often applied to internal optimizations and decision-making.

    Hybrid Environments Complicate Visibility

    Companies are mostly tracking SLOs to increase their visibility into networks (83%), databases (76%) and applications (75%). Other top areas include private cloud environments and legacy computing arrangements. But although observability is trending, organizations still lack complete visibility across the entire stack.

    Of note is that nearly half (46%) of respondents said their monitoring and observability tools don’t provide full visibility into all of their company’s IT assets. For example, only 45% of companies have visibility into their containers and just 35% have visibility into their microservices architecture.

    A lack of full-stack visibility may be complicated due to rising hybrid and multi-cloud conditions, as 78% say a hybrid cloud environment makes monitoring infrastructure more difficult.

    Benefits of Tracking SLOs

    The report defined SLO as “a performance and availability target set for a given system, application [or] service over time.” And the benefits are readily apparent for organizations following such targets—they can help increase performances, direct decision-making and help avoid outages.

    As a result, 70% of companies are currently using SLOs in some fashion. Here are some benefits of tracking SLOs:

    • Increase microservice performance: 87% said using SLOs for microservices architecture would improve service performance.
    • Enable full-stack observability: 58% said some of their company SLOs are mapped to business operations.
    • Improve business decision-making: 91% agreed using SLOs can help drive better business decisions.
    • Prevent service interruption: 67% said their company prevented business interruptions thanks to SLO thresholds alerts.
    • Reduce expenses: 90% indicated SLOs saved their company money.

    Final Thoughts

    More teams are tracking service-level objectives than ever before. And most companies (71%) that aren’t using SLOs now plan on adopting them soon. The data demonstrated that the observability market is an evolving area with room to grow. And, the same can be said about the SRE role.

    Yet, it’s good to point out that not all companies will adopt precisely the same roles or monitoring procedures. Therefore, there will likely continue to be variance in who is using SLOs and how they are applied. Regardless, the study suggested that investigating SLOs has the potential to benefit the software life cycle in many ways.

    The study, “Adoption of SLOs Grow to Increase Visibility and Drive Business Improvements” surveyed 309 participants around the globe in various sectors. The study was sponsored by Nobl9 and conducted by Dimensional Research. For more information, you can download the report here.

  • Observe, Inc. Dives Deeper Into Observability

    Observe, Inc. Dives Deeper Into Observability

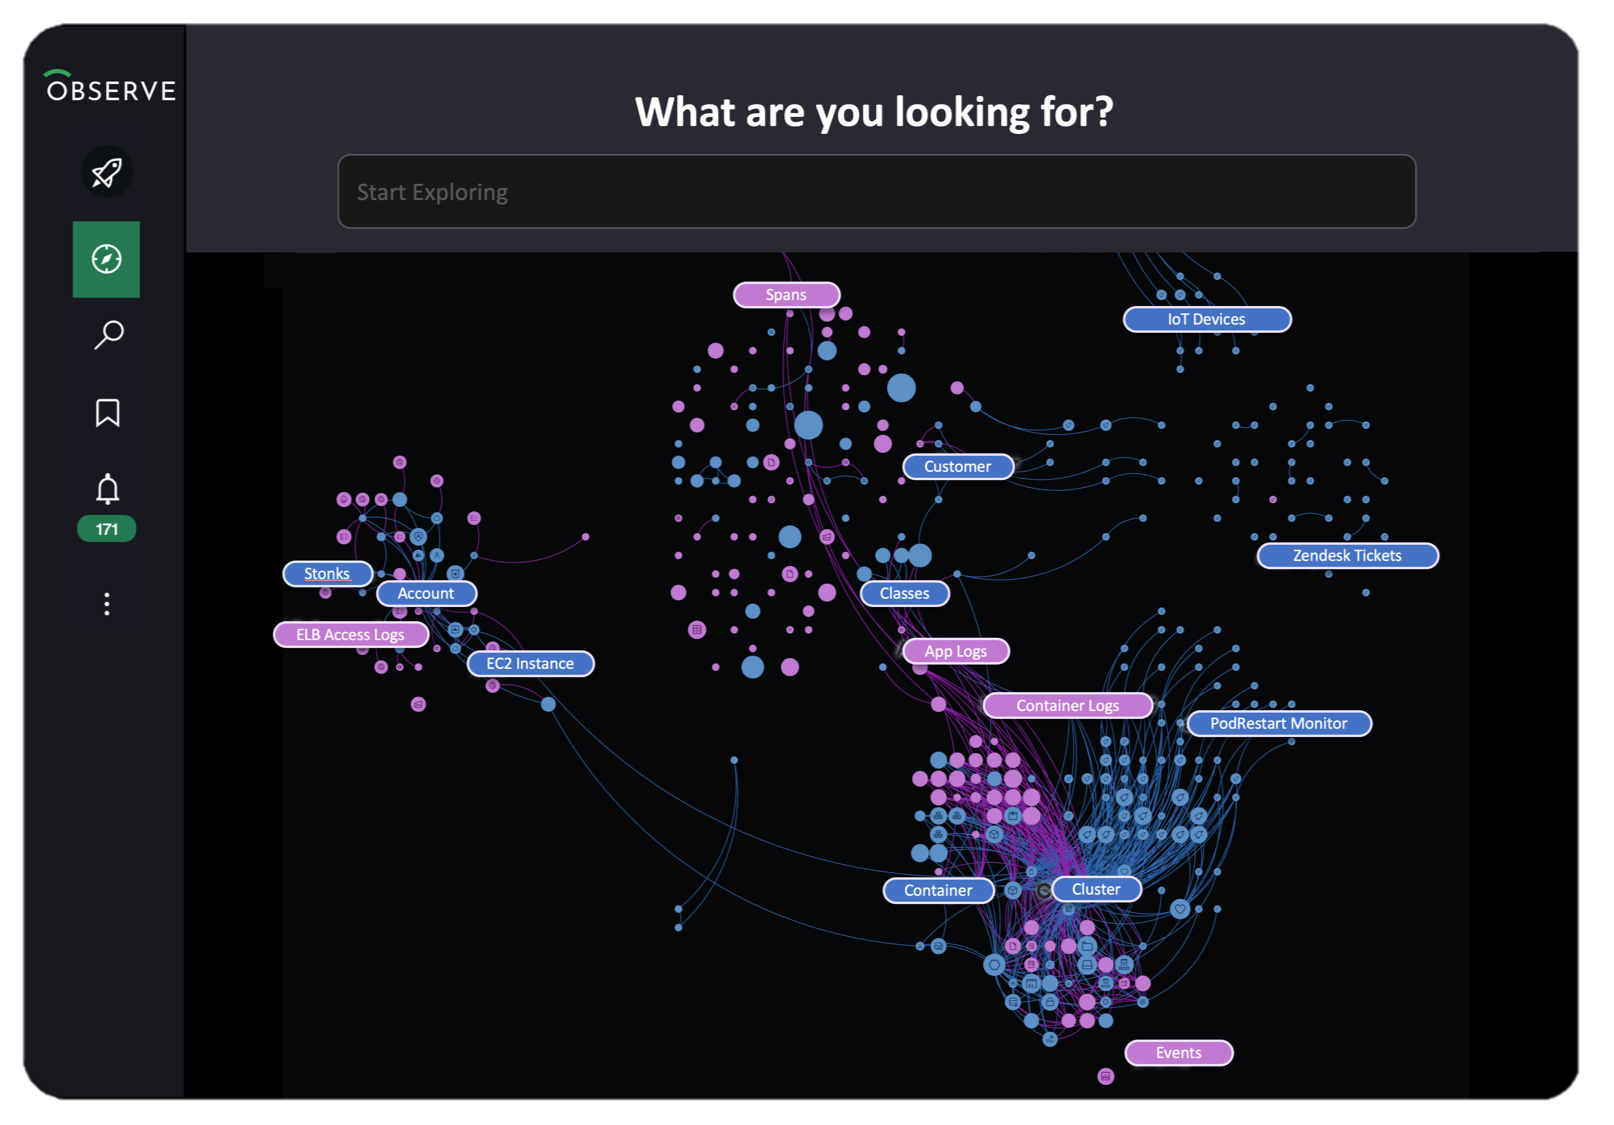
    Fresh from picking up an additional $70 million in funding, Observe, Inc. announced this week it has added multiple tools, dubbed Data Universe Maps, to its observability platform to visualize all datasets and surface underlying event data.

    The company also added pre-built applications for Kubernetes, Amazon Web Services (AWS) and Jenkins environments with editions for Google Cloud Platform (GCP) and Microsoft Azure planned for later this year. Observe Apps are intended to make it easy for IT teams to ingest data that is surfaced via pre-built dashboards that will generate alerts when issues arise.

    Finally, Observe, Inc. has added dashboards that provide transparency into its usage-based pricing model. IT teams can now more easily determine how many credits are consumed by both users and specific datasets to help contain costs.

    Observe, Inc. CEO Jeremy Burton said those tools are crucial because in the absence of tools to control data costs, most organizations will soon discover that observability is unsustainable.

    Of course, it’s not clear yet how many organizations are moving beyond monitoring metrics to embrace observability and launch queries to discover the root cause of performance issues. Many organizations don’t have the level of expertise required to structure such queries. However, as more organizations struggle to investigate and remediate issues impacting customer experience, interest in observability platforms is rising, noted Burton.

    Burton said thus far, as a startup, Observe, Inc. has expanded its customer base by a factor of three to now include 50 organizations, which has resulted in a five-fold increase in the number of monthly active users of the platform. The platform is now ingesting more than 40TB of data each day, with more than 25 million queries each day launched across nearly one trillion rows of more than 10 petabytes of data. Capital One is included among the investors in Observe, Inc.

    At the core of the Observe platform is a graph engine that makes it simpler to uncover the relationships between machine data that is ingested into the platform.

    Going forward, Burton said Observe intends to add support for distributed tracing using the open source agent software created by the OpenTelemetry project that operates under the auspices of the Cloud Native Computing Foundation (CNCF).

    Change within enterprise IT organizations happens slowly. Many will be using legacy monitoring tools alongside observability platforms for years to come. However, there is an opportunity to rationalize monitoring tools as the capabilities of observability platforms continue to expand.

    In the meantime, IT environments will continue to become more complex as more modern applications based on microservices and constructed using containers are deployed. These applications, over time, are generally more resilient than monolithic applications; given all the dependencies between microservices, determining the root cause of a performance issue can be a major challenge. As a result, it may be just a matter of time before this new class of applications ultimately forces the observability issue in the enterprise.

  • Nobl9 Shares SLO-as-Code Methodology

    Nobl9 Shares SLO-as-Code Methodology

    Nobl9 has released version 1.0 of an open specification for defining service level objectives, dubbed OpenSLO, and, in addition, has defined a repeatable SLO methodology.

    Kit Merker, Nobl9 COO, said the Service Level Objective Development Lifecycle (SLODC) methodology represents an effort to create a set of best practices for achieving and maintaining SLOs that are implemented as code within an application environment.

    A survey of more than 300 IT managers and executives conducted by Dimensional Research on behalf of Nobl9 found only 29% of respondents had no plans to implement SLOs. A full 94% of respondents that have or plan to implement SLOs intend to map them directly to business operations, with 91% reporting they expect that effort to improve decision-making. More than 80% also said their organizations are planning to increase the use of SLOs, with 87% indicating SLOs should improve overall microservices performance.

    The challenge is that most organizations have limited visibility into their IT environments. The survey, for example, found less than half of respondents (46%) had visibility into all their IT environments. Only 45% and 35% claim to have visibility into containers and microservices, respectively. More than three-quarters (78%) said hybrid clouds make observability more difficult.

    Ironically, 45% of companies reported they already employed 11 or more observability and monitoring tools. On the plus side, 31% have hired site reliability engineers (SREs), while nearly half (46%) planned to create that role.

    Nobl9 is trying to spur greater adoption of SLOs by making available an open source SLO specification that defines a common interface for constructing SLOs across a Git-based workflow. Since OpenSLO was initially launched, more capabilities have been added including a DataSource object that makes it easier to reuse connection details and which makes creating SLOs less verbose and three alerts have been defined: AlertCondition, AlertPolicy and AlertNotifcationTarget.

    Nobl9 is also releasing an OpenSLO-to-Nobl9 converter to transition OpenSLO YAML files into Nobl9 YAML when required.

    SLOs, of course, are not a new idea. They have been employed as a metric to track the performance of IT services for decades. However, as more microservices-based applications are built and deployed, it’s becoming more challenging to maintain SLOs across applications that have many more dependencies than legacy monolithic applications. Ultimately, each IT team needs to provide some sort of objective benchmark that assesses their overall effectiveness at delivering application services. SLO-as-code is intended to make it simpler to gather the metrics that confirm whether service levels are being achieved. Those SLOs are then tracked and integrated across everything from financial operations to supply chains, noted Mercer.

    It’s not clear to whether reliance on SLOs has waned over the years or if application environments simply became too complex to track meaningful metrics. However, as applications are increasingly viewed as services, it’s now only a matter of time before SLOs become more widely adopted across a modern application environment. The challenge, of course, is that defining an SLO is a lot easier than maintaining it—especially within today’s highly dynamic application environments where services tend to come, change and eventually go unexpectedly.