Category: Application Performance Management/Monitoring

  • ShiftLeft Report Reveals State of Application Security

    ShiftLeft Report Reveals State of Application Security

    A report published today by automated application security testing platform ShiftLeft found only one in three applications has an attackable vulnerability. The report also found organizations that prioritized their remediation efforts based on the level of actual threat are fixing 76% of those vulnerabilities within two sprints lasting 12 days, on average.

    Based on millions of scans performed in the last year using the ShiftLeft platform to identify vulnerabilities, organizations have reduced the number of vulnerabilities they need to address by 97% on a year-over-year basis, the report found.

    In addition, the report noted that the average median scan time is only 90 seconds, which helped drive an overall 68% increase in daily scans year-over-year. Overall mean-time-to-remediate (MTTR) has dropped by 37%, the report also found.

    ShiftLeft CEO Manish Gupta said given the increased number of vulnerabilities, it’s more critical than ever for organizations to focus their remediation efforts on those that can be exploited within their IT environment. For example, the report found that only 4% of all Log4j instances discovered in the IT environments analyzed were vulnerable. Rather than spending weeks looking for every instance, Gupta said IT teams would be much better off focusing their efforts on the instances that might actually be exploited.

    The challenge is that not enough organizations have a way to score vulnerabilities based on the risk they represent to the business, Gupta added.

    While there is a lot more focus on adopting DevSecOps best practices in the wake of a series of high-profile breaches of software supply chains, the ShiftLeft report made it clear that presenting developers with a long list of potential vulnerabilities is counterproductive. The bulk of vulnerabilities that are being discovered are not actually attackable, noted Gupta.

    That doesn’t mean application security doesn’t need to improve, but it is clear that a lot of time and effort is being wasted, added Gupta.

    In theory, at least, as the cultural divide been application development teams and cybersecurity teams continues to narrow, the overall ability to prioritize remediation efforts should improve. The first step toward achieving that goal is making it easier to identify what percentage of the application attack surface is really vulnerable. Otherwise, developers presented with a long list of theoretical vulnerabilities will continue to prioritize developing new features and capabilities versus remediating vulnerabilities.

    One way or another, vulnerability remediation issues will soon come to a head. In the wake of an executive order from the Biden administration to improve overall application security within federal IT environments, many organizations will adopt similar policies and processes. Developers, naturally, will inevitably either push back or do an end-run around processes they deem too onerous. Rather than allowing a stalemate to occur, Gupta said savvy DevOps teams will invest more time in identifying the critical vulnerabilities that need to be addressed before cybercriminals exploit them.

    The issue, of course, is that cybercriminals are getting more adept at discovering and exploiting those very same vulnerabilities.

  • Improving Observability With ML-Enabled Anomaly Detection

    Improving Observability With ML-Enabled Anomaly Detection

    Nowadays, DevOps and SRE teams have many tools to access and analyze logging data. However, there are two challenges that prevent these teams from resolving issues in a timely manner: 

    • They aren’t equipped with all the data they need
    • Detecting and resolving issues is reactive and manual

    In this article, I’m going to break down why these challenges persist and propose a new approach to observability that will help you overcome them.

    Observability Obstacles

    Challenge: You’re not analyzing all your log data

    DevOps and SRE teams need to understand the behavior of their applications and services to spot anomalies as they occur and keep them up and running. However, the cost of traditional logging platforms prevents these teams from analyzing 100% of their observability data. 

    Instead, they have adopted mechanisms to reduce ingestion volumes. In some cases, this means truncating or filtering out datasets. In others, it means moving data to a less active storage tier/target where analytics are not applied. Furthermore, engineers have to predict upfront which datasets are important and meet the criteria to index. It’s these datasets that teams have the ability to analyze in real-time. The rest are ultimately neglected.

    The net impact is that teams are left with an incomplete picture of their environment, making it difficult to understand how applications and services are behaving. As a result, they cannot pinpoint every issue as it occurs.

    Challenge: Traditional platforms create reactive and manual processes

    When working with traditional observability platforms, teams must constantly define logic to detect issues in their environment. And often, they are only able to detect the issues that they are aware of and have had time to build logic for. To keep alerts firing correctly, you have to stay on top of different data structures, changing data shapes, new schemas and libraries, and fluctuating baselines. 

    However, not every team is equipped to detect issues they haven’t seen before. When teams are faced with unknown behavior, they are left conducting a post-mortem debug which is inherently a reactive process. Furthermore, it is increasingly hard to resolve the issue quickly because logging data is often unstructured and difficult to search. Teams have to manually hunt through loglines to pinpoint the activity and affected systems or components. This approach can add hours or even days to an investigation.

    Improving Incident Response

    The solution: Machine learning-enabled anomaly detection and resolution

    To catch every issue and speed up incident investigations, teams can apply machine learning at the data source to detect potential threats and equip teams with the information they need to keep their applications and services running. This kind of approach allows engineers to analyze 100% of their log data and compile it in a consumable and actionable view so that they can spot changes in behavior and resolve anomalies quicker than the traditional approach.

    As loglines are created, they can be automatically analyzed and converted into insightful metrics that inform application and service behavior. From there, federated machine learning can be used to automatically detect and alert on an issue as it occurs. It does so by baselining key metrics, understanding when they’re outside of typical ranges, and determining the likelihood of anomalous behavior—all through machine learning.

    There is no need to continually build and refine logic, effectively eliminating overly manual engineering practices.

    When an issue occurs, developers and DevOps engineers will receive a detailed report of the specific changes in activity within their systems. In this report, they’ll see the exact window of time of the incident and the affected systems or metadata. This report also includes a pinpointed capture of the relevant raw data that contributed to the anomaly, as well as systems, components, or services that were involved.

    Finally, the relevant full-fidelity logs can be dynamically streamed to a central observability platform (Splunk, Datadog, etc.) before, during and after the anomaly. This gives teams the exact data they need to resolve the issue in a timely manner.

    In all, this kind of edge observability allows system administrators to analyze all of their logs all of the time—not just ones that match the pre-defined query in a centralized setup, saving tons of time when it comes to incident response.

  • Splunk Adds Data Management Tools to Observability Platform

    Splunk Adds Data Management Tools to Observability Platform

    At its .conf22 event, Splunk today announced it is making it easier to both onboard data and then manage it across hybrid IT environments via the Splunk Cloud Platform.

    In addition, Splunk Enterprise is being extended to add support for Microsoft Azure with SmartStore for Azure to store cold data alongside existing support for Amazon Web Services (AWS) and Google Cloud Platform (GCP). There is also a developer edition of Splunk Cloud that enables developers to create and test their own applications, which is currently in preview.

    Garth Fort, senior vice president and chief product officer for Splunk, said the overall goal is to make it easier to automatically tune the parameters used to store data in the Splunk observability platform. As more organizations embrace observability as a DevOps best practice, many of them are encountering challenges managing the large volumes of data they are now collecting in the form of logs, metrics and traces.

    The Data Manager for Splunk Cloud Platform will initially be made available on AWS and Azure, with support for GCP to come later this summer. In effect, it provides IT teams with a control plane for data management that spans multiple clouds.

    Ingest Actions, meanwhile, makes it possible to apply granular controls that enable IT teams to filter, mask and route data in motion within the Splunk Platform or to external AWS S3 cloud storage services.

    Other capabilities Splunk unveiled at the conference include an expansion of Federated Search tools to enable a single pane of view across their entire Splunk ecosystem and a fully managed Splunk Assist service for Splunk Enterprise 9.0 that provides customers with deep insights into their security environment.

    Finally, the company has enhanced Splunkbase, a framework for accessing curated collections of more than 2,500 applications and integrations provided by Splunk and its third-party partners.

    As the pioneer of IT operations analytics, Splunk has a large footprint within enterprise IT environments. It is now looking to expand that base to become an observability platform provider. It’s still early days as far as the transition to observability is concerned, but the goal is to make it simpler for IT teams to query platforms and surface issues that could lead to an IT disruption before it happens.

    It’s not clear how many organizations have the skills and expertise required to formulate those queries, but over time it should become more feasible to augment an IT staff with machine learning algorithms capable of discovering those issues.

    In the meantime, IT organizations are collecting more data than ever about their IT environments. In theory, that data will provide the context needed to optimize application environments that get more complex with each passing day. The challenge, of course, then becomes finding a way to efficiently store and manage all that data both before and after it has been analyzed.

    Regardless of the approach to observability, the need to go beyond simple monitoring of IT environments has never been more apparent.

  • Grafana Labs Adds Visual Tools to Simplify Prometheus Queries

    Grafana Labs Adds Visual Tools to Simplify Prometheus Queries

    At its GrafanaCONline event, Grafana Labs today announced an update to the open source Grafana dashboard. The update adds visual query tools to make it easier for IT professionals of any skill level to launch queries against the Prometheus monitoring platform or the company’s Grafana Loki log aggregations framework.

    In addition, Grafana said the open source edition of Grafana OnCall, a scheduling and paging application, is now also available as open source software that can be used in on-premises IT environments. Previously, Grafana OnCall was only available as part of the managed Grafana Cloud service.

    Archana Kesavan, director of product marketing for Grafana Labs, said version 9.0 of the core Grafana platform makes Prometheus monitoring more accessible. Prometheus is being advanced under the auspices of the Cloud Native Computing Foundation (CNCF). It is most widely used in Kubernetes environments, but can also be used with monolithic applications. The latest version of Grafana adds support for an exemplars overlay for traces and Prometheus sparse histograms.

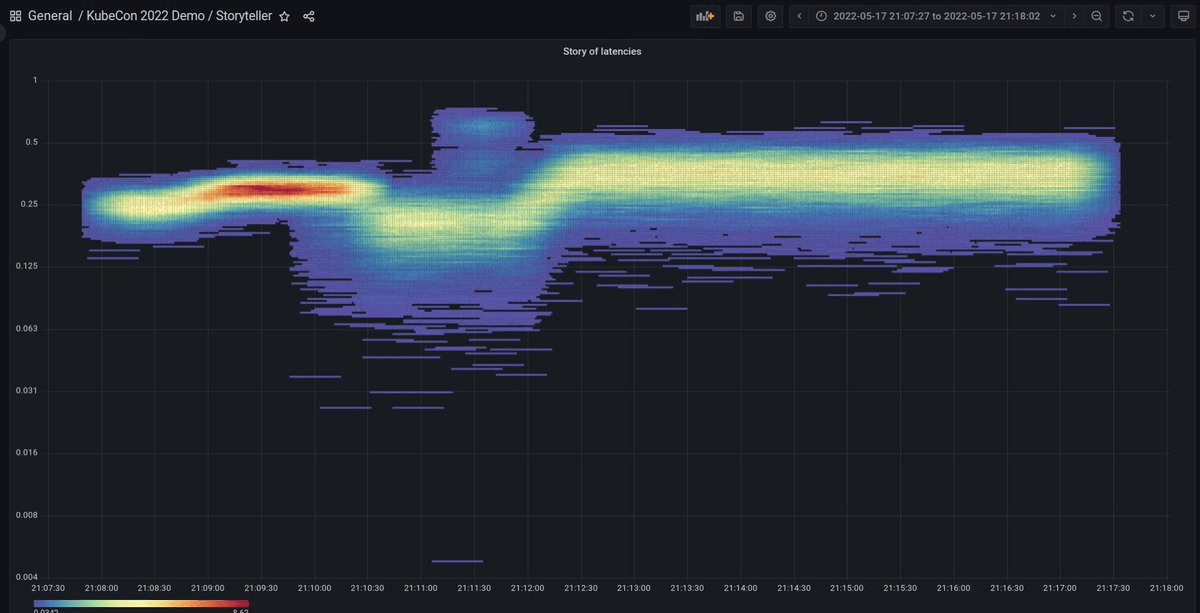
    Other capabilities added with this release include a dashboard preview and title search capability, support for envelope encryption by default, an expanded navigation bar and a revamped heatmap panel that renders more quickly than its predecessor.
    ‘

    Finally, the alert system that Grafana Labs first introduced as an option is now a default setting.

    Kesavan said in addition to making it easier to launch queries, the Grafana Labs approach also limits the ability of a poorly constructed query to impact clusters running Prometheus.

    In general, the adoption of Prometheus has risen alongside Kubernetes. At least initially, DevOps teams that adopt Kubernetes often employ Prometheus to monitor the platform. Less clear is the degree to which IT teams will continue to rely on Prometheus once cloud-native applications are deployed in a production environment. Many IT teams already have a monitoring platform they employ that they choose to extend to Kubernetes environments. Conversely, however, some organizations are opting to replace legacy tools with the Prometheus monitoring platform to monitor both Kubernetes environments and legacy monolithic applications.

    At the very least, Prometheus has established a de facto standard for collecting monitoring data from Kubernetes environments that can be queried by a wide variety of tools.

    One way or another there will soon be fleets of Kubernetes clusters deployed across the extended enterprise that will need to be monitored. DevOps teams will naturally need to decide for themselves how best to monitor those clusters and, ultimately, observe them in a way that enables queries to be launched and issues surfaced before they become a major problem.

    In the meantime, DevOps teams might want to consider consolidating many of the monitoring tools they use today as part of an effort to streamline operations. Rather than having to correlate events across a dozen tools to determine the root cause of an issue, the goal should be to have enough tools to ensure verification without spending hours sorting through conflicting reports.

  • How to Adopt an SRE Practice (When You’re not Google)

    How to Adopt an SRE Practice (When You’re not Google)

    Site reliability engineering (SRE) isn’t a new term or practice. The practice of applying software engineering skills and principles to operations problems and tasks happened even before site reliability engineer was a defined job title. But organizing a proactive approach to building and maintaining software drives long-term success in improving operational efficiency, data-driven roadmap planning and general uptime and reliability. All these advantages account for the widespread adoption of SRE. 

    In this article, I’ll dive into what it takes to get into site reliability engineering, how to adopt it within your own organization and some of the core principles and best practices you’ll need to keep in mind as you move forward in your SRE maturity journey.

    What is SRE?

    SRE, or site reliability engineering, is the practice of applying software engineering expertise to DevOps and operations problems. Often, this means proactively writing code and developing internal applications or services to combat reliability and performance concerns. SRE has been a practice for many years but has been more recently popularized by Google when they first published Site Reliability Engineering: How Google Runs Production Systems in March 2016.

    SRE is a complicated acronym because it both relates to a job title, site reliability engineer,  as well as a general practice adopted by development and IT teams, site reliability engineering. SRE teams are often organized differently depending on the organization and the services they support. Sometimes site reliability engineers (SREs) are sprinkled among development teams. This means they can vocalize concerns during roadmap planning and work closely with QA teams, collaborating on everything from shipping features to staging to managing production environments. 

    Another approach organizes an SRE team as a standalone group. The SRE team as a whole is focused on responsibilities including monitoring applications and infrastructure, establishing reliability metrics, tracking issues with new releases and handling on-call duties. No matter how they are organized, what remains the same for all these SREs is their initiative—reliability and performance.  

    DevOps Vs. SRE

    The rapid adoption of DevOps practices may have you wondering, “How is SRE different from DevOps?” Commonly, the two terms go hand-in-hand. SRE is a practice that doesn’t necessarily have to be part of DevOps culture and adoption but is often implemented by organizations that are further along in their DevOps journey. The further along on your DevOps maturity model, the more likely you are to have bought into SRE practices.

    The conversation isn’t ‘SRE versus DevOps; the conversation is about establishing a proactive SRE team and operating model to help strengthen your DevOps practice. Whether you choose an SRE framework integrated into your development and IT teams, or you want to make SRE a standalone business unit, you need to understand their general responsibilities.

    SRE Team Responsibilities

    Site reliability engineers are responsible for defining what performant and reliable really mean when you talk about your applications, services and infrastructure. The day-to-day tasks can range anywhere from instrumenting new monitoring solutions to building custom apps for technical support teams. They might ship new code to production to fix bugs or deliver new features, or they might respond to incidents in real-time and work closely with support teams to deliver positive customer experiences.

    At the end of the day, site reliability engineers are the key to understanding exactly how customers experience your product and how to track system performance and reliability through your customers’ eyes. SRE teams need to figure out exactly where service boundaries exist between what development teams ship and what customers experience. From there, they need to find ways to monitor reliability and performance concerns in a way that helps your internal teams proactively identify risks and deliver better software. 

    SRE teams spread knowledge across the product and development teams to consistently define reliability across the entire organization. With everyone on the same page, the engineering teams can make data-driven decisions when it comes to releasing new features or improving current experiences in production. 

    Site Reliability Engineering Principles and Practices

    At a very high level, Google defines the core of SRE principles and practices as an ability to ’embrace risk.’ Site reliability engineers balance the organizational need for constant innovation and delivery of new software with the reliability and performance of production environments. 

    The practice of SRE grows as the adoption of DevOps grows because they both help balance the sometimes opposing needs of the development and operations teams. Site reliability engineers inject processes into the CI/CD and software delivery workflows to improve performance and reliability but they will know when to sacrifice stability for speed. By working closely with DevOps teams to understand critical components of their applications and infrastructure, SREs can also learn the non-critical components.

    Creating transparency across all teams about the health of their applications and systems can help site reliability engineers determine a level of risk they can feel comfortable with. The level of desired service availability and acceptable performance issues that you can reasonably allow will depend on the type of service you support as well. SRE principles and practices embrace experimentation and require a dedication to proactively understanding the health of the services they support.

    An SRE Operating and Maturity Model

    You can perform a lot of the responsibilities asked of a site reliability engineer and still have a software engineer job title. So, how do you know how mature your site reliability engineering practice is? Luckily for you, we’ll lay out a quick way to build an effective SRE operating model and track your maturity against it. An SRE operating model typically includes three elements, which you might achieve in phases:

    1. A team (or at least one person) dedicated to the practice of SRE.
    2. Deep integration and influence across product, development and operations teams.
    3. Autonomy to automate workflows and write code for nearly any part of your application or system.

    Your SRE maturity depends on where your organization falls along these three elements of an SRE operating model. If you’ve taken the steps to make an SRE team or hire your first site reliability engineer, you’re at the beginning of your journey. If you have a team and they are a valued part of roadmap discussions, QA, deployment workflows, incident management processes, then you have a somewhat mature SRE practice. 

    An organization only reaches complete SRE maturity when the SRE business unit has the autonomy to automate workflows, build applications, own monitoring and alerting solutions, or interject themselves into nearly any conversation. Vocalizing performance and reliability concerns upfront and having a proactive discussion about those concerns is always better than simply ignoring them until it’s too late.

    Monitoring, CI/CD and Organizational Automation

    Site reliability engineers can and will automate just about anything and everything. If it can proactively detect, remediate or resolve an issue, it needs to be automated. From continuous integration and delivery practices to production environment monitoring, SREs should have some visibility into all of it. If they can identify ways to proactively uncover performance and reliability issues, then they need to have the authority to implement those changes.

    Today’s DevOps and IT capabilities around automation, monitoring, artificial intelligence and machine learning give SRE teams a huge advantage when identifying issues, responding to them and fixing them. Organizations with mature DevOps and SRE practices can catch problems in staging and they can also build automated incident management workflows and self-correcting systems. By determining critical components in your applications and infrastructure, SREs can narrow down the scope of things that can cause major problems.

    The Practice of Service Levels (SLIs, SLOs and SLAs)

    Service levels come into play to help SRE teams communicate the true health of digital products and services to all stakeholders. This is done by identifying and measuring critical components that are key to delivering positive customer experiences. In particular, they need to know when one or more components expose functionality to external customers. We call these intersection points system boundaries. System boundaries are the place where site reliability engineers need to apply service-level indicators and objectives to their metrics in order to tell the real story of system performance and reliability. 

    • Service-level indicators (SLIs) are the key measurements to determine the availability of a system.
    • Service-level objectives (SLOs) are goals you set for how much availability you expect out of a system.
    • Service-level agreements (SLAs) are the legal contracts that explain what happens if the system doesn’t meet its SLO.

    While SREs aren’t always responsible for managing service levels, it often falls within their purview. By tracking SLIs and tying them to SLOs, you can set goals around the performance of a system. Google’s SRE book defines the four golden signals of service levels as latency, traffic, errors and saturation. So, for example, you could look at an API call and track its number of successful/failed requests (the SLI) against a general percentage of requests that need to be successful for customers to have a good experience (the SLO).

    SRE teams will often set strict SLOs on critical components within their applications and services to better understand how strict of an SLA they can agree to with customers. From here, the team can apply error budgets as a way to understand how quickly they must resolve issues in order to stay compliant with their SLOs. Service levels allow teams to aggregate metrics and create a transparent view of uptime, performance, and reliability across the entire organization. At a glance, business leaders can use service levels to monitor compliance across multiple teams, applications, services, etc. to gain a comprehensive understanding of their system’s health.

    Adopting SRE Best Practices

    Adopting SRE best practices and principles won’t happen overnight. It takes time and effort to proactively monitor your teams and systems for performance and reliability concerns. But, in the end, your DevOps teams and especially your customers will thank you for deciding to take advantage of site reliability engineering.

  • AppSmith Adds Git Support to Low-Code App Dev Framework

    AppSmith Adds Git Support to Low-Code App Dev Framework

    AppSmith has added support for Git repositories to an open source framework for building custom applications using a low-code platform based on the JavaScript programming language.

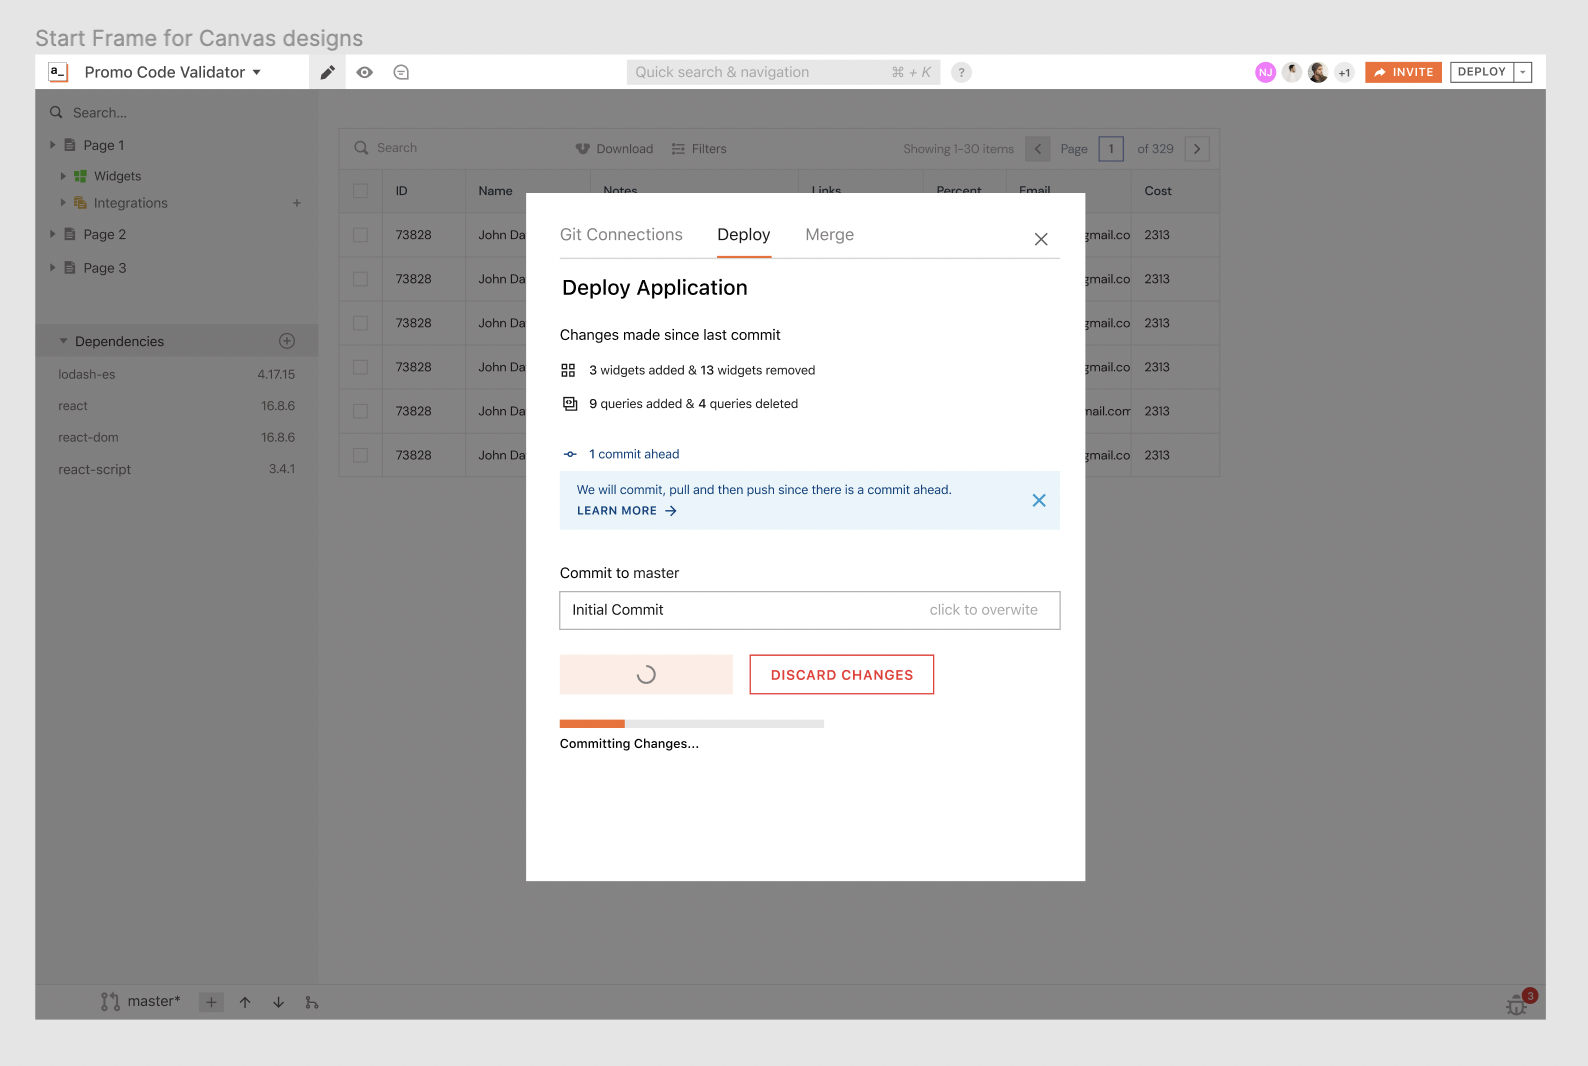
    Rishabh Kaul, head of marketing for AppSmith, said the Git support will make it simpler for developers to manage version control as they iteratively build applications using a set of graphical widgets provided by AppSmith.

    AppSmith is used primarily by developers to build internal applications that automate a specific task or workflow. Support for Git makes it possible for multiple developers to more easily collaborate as they add work to a Git branch and make requests within the context of a continuous integration/continuous delivery (CI/CD) pipeline.

    That also makes it simpler to test applications and roll back to a previous version in the event something should go wrong, said Kaul.

    The Community Edition of AppSmith will make it possible to connect to unlimited public repositories and up to three private ones before requiring developers to upgrade.

    In recent years, use of low-code tools has increased dramatically as organizations embrace tools that enable them to build applications faster. Not every application requires developers to employ tools for working with procedural code. There are typically hundreds of use cases where an organization could build and deploy an application that would eliminate the need for an internal team to license yet another packaged application.

    In general, AppSmith and other open source tool and framework providers are betting that, as the economy continues to shrink, the adoption of these tools will increase as organizations continue to become more sensitive to costs. That approach will allow them to continue to provide applications tailored to automate specific tasks.

    The challenge, of course, is that as the number of applications being built and deployed steadily increases, the DevOps workflows that regularly update, secure and maintain those applications become much more challenging.

    It’s not clear what percentage of applications are now being built using some type of low-code tool. However, the overall size of organizations’ application portfolio is generally much higher than it was prior to the pandemic. Many of those applications are driving digital business processes intended to make the workforce more efficient at a time when many employees continue to work from home.

    Less clear, however, is how many new applications are being built by so-called citizen developers. One way or another, however, it’s becoming easier for end users that have some basic software understanding to build applications. Inevitably, those application development efforts will also need to be integrated within the context of a DevOps workflow.

    Regardless of how an individual DevOps team may view low-code tools, they have permanently altered the application development landscape. The issue is no longer whether low-code tools will be used by developers but rather to what extent. In the meantime, DevOps teams would be well advised to review just how extensible their existing pipelines need to become.

  • Saying Goodbye to Legacy Systems

    Saying Goodbye to Legacy Systems

    Are you still using a rotary phone, tube television or Rolodex? Probably not. But if you were, you’d still be using newer technology than what many enterprises still rely on every day to drive mission-critical applications that we use every day when shopping, banking or hundreds of other normal tasks. 

    At least two-thirds of large enterprises are running mainframe-based apps that date back 10 to 20 years and more than 25% of businesses feature applications that are between 20 or 30 years old. Today, businesses are often running and maintaining legacy applications built on traditional databases while simultaneously building microservices-based apps to accelerate new services and innovations. The mantra “If it ain’t broke, don’t fix it” certainly applies here; and while there are many reasons organizations continue to rely on mainframes and legacy systems, there are also many organizations that want to begin modernization initiatives but don’t know where to start.

    However, the past few years saw a wave of new digital-first companies in all industries putting pressure on legacy systems-based businesses—from retail to finance to manufacturing to technology. The COVID-19 pandemic accelerated many organizations’ modernization plans and made clear that for those that wanted or needed to modernize to stay competitive, avoiding the problem just wasn’t an option. Companies found that if they weren’t proactive about modernizing, the cost of being reactive when they needed to update and evolve was exorbitant.  

    Accelerating IT modernization initiatives can be a major challenge: Safely modernizing those legacy apps and mainframe systems and the critical data in them can seem impossible, but it can be done. Companies like Kroger, for example, have already made that jump and there’s a lot to learn from them. Here are three things that can help any enterprise on their journey to say goodbye to mainframes and legacy systems:

    You Need a Frictionless Path for Legacy Apps

    Many modern solutions are only focused on greenfield applications and helping newer born-in-the-cloud companies and projects; however, the reality is most Fortune 1000 companies have a lot of existing applications they can’t afford to ignore or completely rebuild all at once. Supporting existing applications with standard interfaces like Postgres while delivering the scalability and resiliency to support modern applications is critical to providing a bridge from where companies have been to where they are trying to go. Distributed SQL databases provide a seamless path forward to modernize existing apps while supporting new and current initiatives. 

    Embrace Automation

    It’s time to stop relying on complex code or fragile systems with bolted-on third-party tools. Being able to rely on intelligence and automation in the data layer for distribution, resiliency and availability is critical to minimizing changes and impacts on current applications. Doing so will reduce risk, offload legacy app tasks and ensure systems have the intelligence to work properly. With a distributed SQL database, you can deliver a single logical database that appears to applications like a monolithic, single-server database but with the underlying intelligence to allow it to stretch across hybrid, private and public clouds. 

    Finding Flexibility and Becoming Future-Proof

    To avoid being tied to specific systems or architectures, it’s time to adopt a future-proof mindset. Businesses can achieve this through:

    • Multi-cloud/hybrid cloud: With a distributed SQL database, you can deliver a single logical database that looks like a monolithic, single-server database but with the intelligence to stretch across hybrid, private and public clouds—providing the flexibility to be deployed wherever the application is needed or is best served.
    • Any hardware: No two data centers look alike and there are a wide variety of hardware needs, from bare metal to VMs and containers. The right modern distributed database provides ultimate flexibility in where the data layer can be installed to match whatever hardware and configurations are already in use. 
    • Any deployment: Existing organizations have a wide variety of environments and deployment types, from single data centers to two or more private data centers to more and more hybrid environments that span on-premises and public clouds. A modern distributed database provides the freedom to support a wide range of deployment options, including synchronous replication, geo-partitioning and cross-cluster asynchronous replication.  
    • Open source freedom: While many databases provide some open source components, there are still a few 100% open source solutions committed to the Apache 2.0 license. Users can benefit from the full set of enterprise features and capabilities in these open source solutions as well as benefit from the security and transparency that comes with a 100%-open source solution. 

    It’s time to update the old adage, “If it ain’t broke, don’t fix it” to “If it ain’t fixed, it could be broke,” with regard to modernizing legacy systems. If you’re considering starting a modernization journey, save time, resources and money now to make upgrades that might later be costly, time-consuming and overwhelming for your internal teams. 

  • Solving the Speed Paradox With Open Source PaaS

    Solving the Speed Paradox With Open Source PaaS

    The number of DevOps tools keeps growing, as does the number of cloud resources and options to manage those resources. On EC2 alone, AWS offers nearly 400 instance types across storage, networking and operating systems. Complicating this further is that users can choose from machines located in 24 regions and 77 availability zones.

    This proliferation is driving a ‘speed paradox’ wherein the faster you grow the more fragmented and complex your ecosystem becomes which, in turn, slows everything down. Most DevOps teams struggle to keep up with the demand for more environments from developers.

    The Speed Paradox

    The Rise of the Internal Developer Platform (IDP)

    One intriguing solution to the speed paradox is the internal developer platform (IDP). As its name suggests, an IDP provides a single place where developers can find all the resources needed to run their environments. An IDP allows developers to speed development processes by offering improvements in:

    • Efficiency – Simplifying access to development and testing infrastructure through a self-service experience;
    • Consistency – Providing a consistent way to consume infrastructure resources across teams; and
    • Visibility – Providing a single place to see all the pipelines, workflows and states associated with each environment.

    Gartner sums it nicely: “Product teams often struggle due to disparate tools and disjointed workflows as they accelerate digital transformation. Software engineering leaders leading platform teams must establish internal, self-service developer portals to enable consistency and scale cloud, agile and DevOps initiatives.”

    Lessons From the ‘PaaS-t’

    The idea of a developer platform isn’t new. Previous-generation PaaS—Google App Engine, Heroku Cloud Foundry, for instance—provided a simple interface to write applications by abstracting cloud resources. But early PaaS failed, perhaps mostly due to the long tail of developer needs. Back in 2013, I observed: 

    “Every Access project will eventually fail because, while 80% of what the user wants is fast and easy to create and the next 10% is possible with difficulty, ultimately the last 10% is impossible because you can’t get far enough underneath the built-in abstractions and users always want 100% of what they want.”

    You can sum up the failures of early PaaS in three points:

    • Too opinionated: It is hard (impossible?) to control the way the platforms run their infrastructure resources. You’re dependent on the platform vendor for customization.
    • Limited to simple web applications and language choices: Modern SaaS applications are complex and include backend services that don’t fit that architecture.
    • Maturity: Early PaaS attempted to abstract cloud when it was a young, moving target.

    What’s Changed?

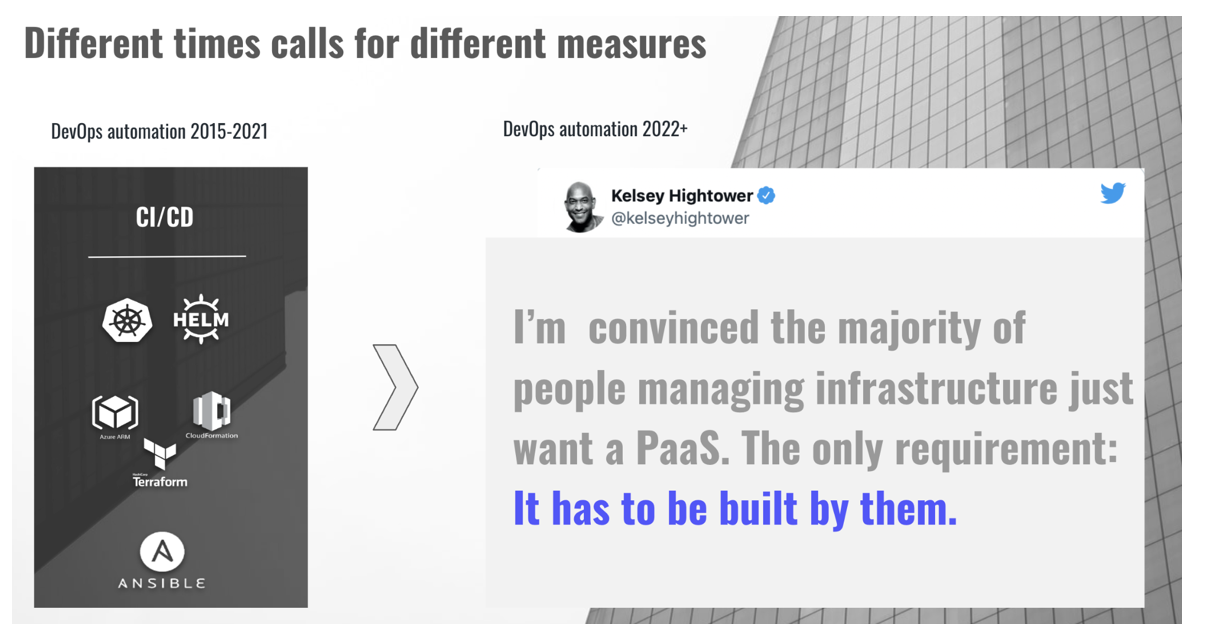
    With early PaaS, we traded simplicity for flexibility. Finding the right balance between the two is the heart of the challenge. Kubernetes and Docker, as well as IaC tools like Terraform, Cloud Formation and Azure ARM are a great substrate: They provide a consistent framework to manage applications across a wide range of infrastructure resources among clouds. Maturity and adoption of these tools reduces barriers to build a developer platform. This opens the opportunity to create a custom platform for each organization, allowing teams to control how their platform fits into their organization’s environments. It also offers balance between simplicity and flexibility, because each organization can choose where to draw the line—and even redraw that line without being dependent on an external vendor.

    The next-generation platform 

    Enter Backstage

    Backstage is an open source IDP project led by Spotify. Its three main parts are:

    • Service Definition—Based on the Kubernetes template format, it provides a service descriptor that fits into a range of services: monitoring, CI/CD and Git repositories
    • Backstage service catalog—Basically a web application with a database backend providing a single point of access to manage resources
    • Integrated tooling via plugins —A marketplace of integrated resources

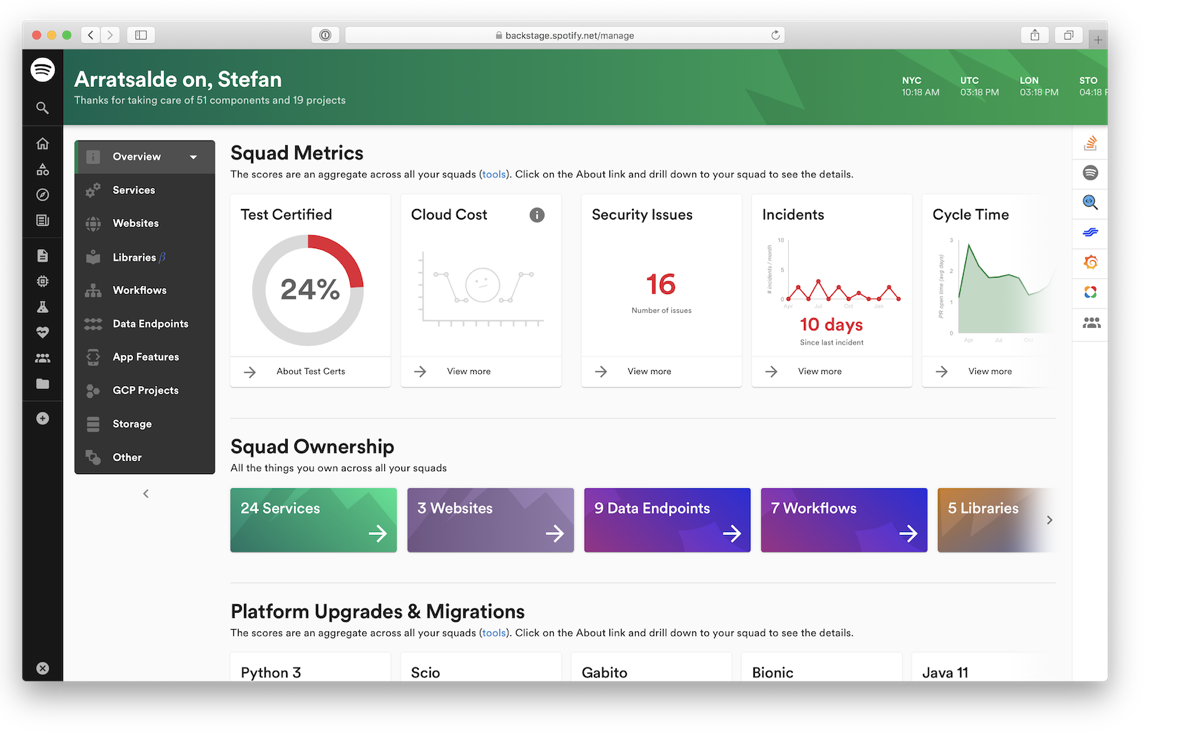
    Here’s how an IDP based on Backstage can look:

    An example of an internal development platform based on backstage

    We can use Backstage to organize all development services and resources such as our squad KPI, the development pipeline, API and Git repositories, all in one place.

    Turning Backstage Into a Full-Blown PaaS

    One of the missing pieces in Backstage is infrastructure provisioning. Adding it turns Backstage into something closer to a full-blown PaaS. Cloudify provides a remote execution engine that integrates with a variety of infrastructure resources and allows users to organize them into a self-service development or production environment. The integration of Cloudify into Backstage includes synchronizing the development environments into the Backstage service catalog and allowing self-provisioning of those services through the Backstage portal or through GitOps.

    Integrating Cloudify as a remote execution engine to Backstage 

    You can watch a demo or get more information on the integration from the Cloudify Backstage Git repo.

    The End of ‘Growth At Any Cost’

    Last year, Sarah Wang and Marti Cassado analyzed the impact of cloud spending on hypergrowth companies. As tech companies trade away efficiency in pursuit of velocity, they face a non-sustainable growth model where cloud costs surpass 50% of total revenue. Wang and Cassado’s analysis illustrates how this condition directly impacts a company’s profitability—and valuation.

    In today’s market upheaval, it’s even easier to see how a “growth at any cost” policy is unsustainable. Today, DevOps teams have to find ways to support growth while controlling costs. This forces organizations to better control how development teams use cloud infrastructure. 

    IDPs can become a major tool in this effort. Unsurprisingly they’re becoming the next hot DevOps trend. Backstage provides a great framework and ecosystem to shorten the time a team needs to build its own internal platform and Cloudify provides the open, remote execution engine with a single place to organize infrastructure resources into a self-service environment. The integration turns Backstage into a full-blown PaaS.

    The current Cloudify-Backstage integration is only an MVP release. Next, we’ll deepen the integration, providing more monitoring within the Backstage portal. Here, you can find more information on our open source contribution to Backstage and offer feedback.

    An Open Source Solution to the Speed Paradox 

    The “speed paradox”—where the faster you grow the more fragmented and complex your ecosystem becomes, which in turn slows everything down—need not grind our DevOps agility goals into the ground. By using open source Cloudify integrated into the Backstage project, DevOps teams can avoid becoming the new bottleneck in software development agility goals. 


  • LogicMonitor Expands Reach and Scope of Observability Platform

    LogicMonitor Expands Reach and Scope of Observability Platform

    At its LM Elevate user conference, LogicMonitor today formally launched LM Envision, an observability platform that incorporates artificial intelligence (AI) to both discover and then remediate issues.

    LogicMonitor CEO Christina Kosmowski said LM Envision is the only observability platform available via a software-as-a-service (SaaS) model that can be applied to both on-premises and cloud applications. In total, there are already more than 2,000 integrations for the platform as part of the open LM Envision ecosystem, she noted.

    Over the last year, additional capabilities have been developed and added to the observability platform. These include application performance monitoring (APM) tools to identify bottlenecks and optimize performance, expanded support for public clouds and Kubernetes environments, integration with the StackStorm automation platform, integration with Terraform infrastructure-as-code tools and more advanced tools for searching logs.

    The company has also extended its AI operations tools to provide more context when troubleshooting issues by aggregating logs and including topology tools and graphs.

    Finally, LogicMonitor has added a push metrics application programming interface (API) to make it simpler to ingest data, pre-integrated dashboards and support for open source OpenTelemetry agent software.

    Kosmowski said it’s only a matter of time before observability and AIOps converge to the point where IT teams will finally be able to spend less time managing platforms. One of the major challenges IT teams face is that each platform they use requires its own framework to monitor and manage it. As observability and management frameworks converge, the overall overhead associated with managing modern IT environments should steadily decline as machine learning algorithms make it easier to surface issues before they create a major disruption, she noted.

    The overall goal is to close the loop between the discovery of an IT issue and its remediation, Kosmowski added.

    Observability, of course, is one of the core tenets of any set of DevOps best practices. Achieving it, however, has always been a challenge. The goal now is to eventually replace the hodgepodge of monitoring tools that track a limited set of pre-defined metrics with an observability platform that not only aggregates metrics but enables DevOps teams to launch queries and surface IT issues. In some instances, the rationalization of monitoring tools will help justify the acquisition of an observability platform. The paradox is that, as IT environments become more complex, it may actually become easier to manage those environments as more applications become instrumented and the various silos that isolate IT teams from one another start to collapse.

    In the meantime, there is no shortage of observability platform options. The primary difference between each of them is the degree of integration they provide and their ability to employ AIOps to automatically resolve issues, said Kosmowski. Each minute DevOps teams don’t spend on managing IT platforms is a minute that can be applied to spurring innovation, she added.

    One way or another, DevOps teams will soon have more access to information about their IT environments than ever. Less clear is how much of the data being collected by observability platforms will actually constitute actionable intelligence. But as observability continues to evolve, it’s now more a question of the degree to which that goal will be achieved versus if or when.

  • Catchpoint Enables Experimentation by Automating Web App Testing

    Catchpoint Enables Experimentation by Automating Web App Testing

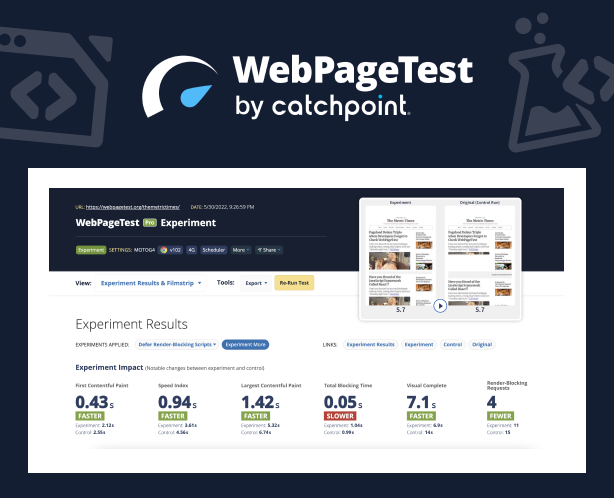
    Catchpoint this week expanded its open source WebPageTest performance testing suite of tools to enable IT teams to run instant tests that surface suggestions for improving overall web application and site performance.

    In addition, Catchpoint is now providing support for private tests, bulk tests and priority testing capabilities within the WebPageTest tool suite.

    Tim Kadlec, director of engineering for WebPageTest, said the goal is to make it easier for both developers and DevOps teams to experiment with how changes to applications and websites could improve performance using a capability that has now been added to the core suite.

    Identifying opportunities to improve performance typically requires tediously constructing manual tests over a period of weeks, noted Kadlec. Much of that effort is experimental in the sense that no one knows for sure if the tests being constructed will have a material impact on performance.

    The Opportunities and Experiments capability provides teams with a low-code tool for building tests based on a set of best practices that Catchpoint has defined. That approach makes it simpler to automatically generate and test tweaks that, for example, eliminate blocking scripts, optimize image rendering and minimize layout shifts. The result is optimization tests that show how their applications and websites could benefit from specific, actionable improvements without having to change any of the code that has already been deployed, said Kadlec.

    That’s a critical capability because it will encourage a level of experimentation that previously IT teams shied away from, simply because the amount of effort required to achieve an uncertain outcome was too high.

    It’s not precisely clear who is conducting these types of tests, as more responsibility for testing applications continues to shift left toward developers. The latest additions to WebPageTest make it easier for developers to conduct those tests without necessarily requiring help from a DevOps team, noted Kadlec.

    While there has always been a tremendous amount of focus on web application and site performance, the attention level has risen across organizations in the digital business transformation era. Many of the processes being implemented via web applications are extremely latency-sensitive. As more of those applications become routinely tested, the overall level of application performance should steadily improve.

    At the same time, the number of web applications and websites that most organizations are supporting also continues to expand. Most of those organizations are looking for ways to test applications without necessarily having to expand the size of the testing team or significantly increase the amount of time spent on testing.

    Regardless of the approach, it is apparent that testing is becoming more automated. The goal is not so much to eliminate the need for dedicated testing teams, but reduce the number of rote tasks that contribute to test avoidance in the interest of saving time. In theory, the more tests run—and the earlier they are run—the fewer issues that DevOps teams will need to deal with later.