Category: Application Performance Management/Monitoring

  • Red Hat Adds Managed Ansible Service on Azure

    Red Hat Adds Managed Ansible Service on Azure

    Red Hat today announced general availability of a managed instance of the Red Hat Ansible Automation Platform on the Microsoft Azure cloud.

    Announced at the Red Hat Summit 2022 event, this offering makes it possible to deploy the control plane for Ansible on the Microsoft Azure cloud as an alternative to existing support for Amazon Web Services (AWS) or an on-premises IT environment.

    In addition, in version 2.2 of the Ansible Automation platform, Red Hat is previewing support for content signing technology that automatically validates content to improve overall security.

    Thomas Anderson, vice president of Ansible for Red Hat, said this managed service enables IT teams to take advantage of integrated Microsoft billing in addition to the latest features and content provided for the platform and other capabilities that have been added to optimize Microsoft Azure environments.

    The open source Ansible platform has been gaining traction as an automation framework that enables IT teams to declaratively automate tasks. It requires less programming expertise than rival automation frameworks, which Anderson said is the primary reason so many third-party vendors have adopted Ansible to automate a range of IT tasks.

    The challenge many organizations encounter today is managing multiple islands of automation across multiple clouds and on-premises IT environments. Ansible presents IT teams with the ability to begin unifying all those islands under a single framework, said Anderson.

    It’s not clear to what degree DevOps teams that have embraced rival automation frameworks might be willing to replace them with Ansible. However, as more IT teams embrace automation to make up for shortages of IT personnel, it’s apparent that Ansible is being used across a wide range of IT disciplines spanning everything from DevOps to network management.

    Regardless of the approach, the need to automate as many tasks as possible is becoming critical as IT environments grow increasingly more complex. Many of the scripts that IT teams created on their own simply don’t scale. More challenging still, they are not often documented, so every time the IT professional that created that script leaves the organization it becomes difficult to maintain that scripting code.

    In the longer term, of course, automation frameworks will be increasingly infused with machine learning algorithms capable of learning the unique nuances of individual IT environments. It’s not likely those algorithms will replace the need for IT professionals any time soon. However, rather than resisting automation, more IT professionals have concluded that the tasks required are simply too challenging to manually perform. Many will conclude they simply prefer to work for organizations that have a consistent approach to IT automation that makes it feasible for them to manage a wide range of IT tasks.

    One way or another, IT automation is becoming a standard capability that now goes well beyond the scope of a few isolated DevOps workflows. The issue is finding a way for IT professionals with varying skill levels to collaborate across a common framework that is both easily accessible and highly extensible.


  • OpenSSF Adds Open Source Package Analysis Tool Prototype

    OpenSSF Adds Open Source Package Analysis Tool Prototype

    The Open Source Security Foundation (OpenSSF) has made available a prototype of a package analysis tool that has already identified more than 200 malicious packages uploaded to PyPI and npm software components.

    Caleb Brown, an OpenSSF maintainer of the project, said the goal is to understand the behavior and capabilities of packages available on open source repositories. It also tracks how packages behave over time to make it easier to identify when previously safe software began to act in a suspicious manner.

    Most of the malicious packages detected are employing dependency confusion and typosquatting techniques, Brown said. They usually contain a simple script that runs during installation and provides a few details about the host to an external command-and-control system. Most of these packages are not exfiltrating meaningful data except the name of the machine or a username, but they make no attempt to disguise their behavior. The issue is that any one of these packages could have done far more damage, noted Brown.

    Future goals for the project include detecting differences in package behavior over time; automating the processing of the package analysis results; storing the packages themselves as they are processed for long-term analysis and improving the reliability of the pipeline. As such, the OpenSSF is looking for application developers and cybersecurity researchers to contribute to the project. The expectation is that many providers of application security tools will incorporate the package analysis tool within their offerings rather than requiring each vendor to create their own version of the same tool, said Brown.

    The OpenSSF has launched a series of initiatives to improve the overall state of open source security. Most recently, it added an Alpha-Omega Project to automate security testing processes for open source software using a $5 million initial investment provided by Microsoft and Google. The core challenge is that many organizations are dependent on open source software projects created and maintained by just a handful of volunteer maintainers and contributors. The individuals that created those projects don’t always have a lot of cybersecurity expertise. In fact, many of them would argue that the onus for securing open source software is on the organizations that use what amounts to free software. It’s not the responsibility of the contributors and maintainers to, for example, drop everything and immediately create a patch to address a zero-day vulnerability.

    It’s not clear how easily open source software could be compromised by cybercriminals that insert malware into downstream applications that rely on that code. However, in the wake of a series of high-profile breaches, it’s safe to assume that more cybercriminals than ever are trying to compromise open source software projects. While some organizations may opt to limit their dependency on open source code that has not been properly vetted, there is no way to entirely avoid using open source code. The challenge is finding a more efficient way to ensure the integrity of that code for all concerned.

  • Twitter/Bluesky ADX Algorithm | Cloud Energy Use ‘Tripled’ | Apple Staff are Revolting

    Twitter/Bluesky ADX Algorithm | Cloud Energy Use ‘Tripled’ | Apple Staff are Revolting

    Welcome to The Long View—where we peruse the news of the week and strip it to the essentials. Let’s work out what really matters.

    This week: Bluesky—Twitter’s research spinout—opens its ADX algorithm, Irish data center electricity worries grow, and Apple employees are the latest to rise up against hybrid working. (more…)

  • Libbpf Vs. BCC for BPF Development

    Libbpf Vs. BCC for BPF Development

    If you’re into Linux development, you’ve probably heard BPF mentioned over the last few years. BPF stands for Berkeley Packet Filter, and the technology has a large number of use cases. BPF apps can get deep access into an operating system and enable you to perform tasks such as high-performance load balancing, DDoS mitigation and more simply and easily.

    Libbpf and BCC-Tools are both sets of tools to help with BPF development. However, both of these have their own strengths and weaknesses. In this guide, you will learn in detail about the two tool collections and understand when to use them.

    What is BCC?

    BCC stands for BPF Compiler Collection and is one of the oldest ways to develop BPF applications. It helps you embed your BPF code into your user-space program in the form of a plain string. When the user-space program is executed by the kernel, BCC invokes its embedded Clang/LLVM, pulls in system-wide kernel headers and compiles the program on the spot. 

    Since BCC compiles BPF programs on the host machine, it ensures that the memory layout your BPF program expects is precisely the same as that of the target host.

    BPF programs are designed to be injected directly into a kernel, so BCC tools seem to be the perfect solution for developing BPF applications. However, they have proven to be bulky in the modern context due to their heavy reliance on the Clang/LLVM combination, which is resource-intensive. This has led to the need for a better, more modern solution to developing BPF apps.

    What is Libbpf?

    Libbpf is one of the hottest new BPF tools on the market. It is usually coupled with BPF CO-RE (which stands for compile once, run everywhere). BPF CO-RE enables you to generate binaries that run on multiple kernel versions.

    The idea behind Libbpf is to make BPF development as similar to other forms of development as possible. With BPF CO-RE, Libbpf does this by compiling BPF programs into small binaries that can be deployed to multiple deployment hosts. Libbpf does the setup work like loading and verifying programs, creating maps, attaching to hooks, etc., which enables developers to focus on more critical tasks at hand, such as program performance and correctness.

    Libbpf aims to eliminate the overheads associated with BPF app development and deployment by reducing the dependency on system-wide kernel headers as well as Clang/LLVM libraries for compilation on runtime.

    Libbpf Vs. BCC: Key Takeaways

    Now that you understand how each of these tools works, let’s compare some key benchmarks to learn when to use them.

    Dependency Management

    BCC relies on kernel header packages that need to be installed on the target host machines. While it is not a problem in most cases, it can get difficult to set up and maintain if you are working on multiple machines. 

    Libbpf, on the other hand, eliminates this issue by relying on a vmheader file. This file includes multiple kernel types which helps you to remove dependency from system-wide kernel headers.

    Compilation Style

    For programs written with BCC, compilation occurs at runtime. To facilitate this, such programs require Clang/LLVM be present on the host machine. This adds to the code footprint of your programs.

    Furthermore, the Clang/LLVM libraries are resource-intensive. Complete libraries need to be available and run at compile time, even for small programs. This can upset a perfectly balanced BPF workload on the host machine.

    On the other hand, Libbpf enables you to generate binaries that are compiled once and can be run anywhere. You do not need any system-wide dependencies to be present on the target machine for running such apps. Hence, it reduces the overall application size as well as resource consumption on runtime.

    Error Detection

    For apps developed with BCC tools, errors are detected only at runtime since that is when the programs are compiled. This leads to a rather sluggish development experience compared to apps developed using Libbpf. Since Libbpf enables compilation while developing, finding and fixing bugs is easier.

    Final Thoughts

    In this guide, we walked you through what Libbpf and BCC tools are and compared them based on some important aspects of application development and delivery. 

    All in all, Libbpf appears to best BCC tools in most aspects. BCC tools offer fast prototyping and experimentation possibilities, but when it comes to production deployments, BCC tools turn out to be a rather expensive choice compared to Libbpf. 

    You can learn more about why BCC became the popular alternative and how it was eventually replaced by Libbpf here. Even if you currently use BCC tools for your apps, you can easily migrate to Libbpf by following a few simple steps. And, in most cases, it is better to opt for Libbpf than BCC tools for a better development experience and application performance.

  • Applause Report Surfaces Functional Testing Issues

    Applause Report Surfaces Functional Testing Issues

    An analysis of more than 340,000 bugs collected by Applause, a provider of a testing platform designed to integrate with a range of DevOps platforms, found functional bugs accounted for 68% of issues. The research gathered data from 13,000 mobile devices and 1,000 unique desktops running 500 versions of operating systems and found that the majority of issues could be traced to functional bugs compared to visual (17%), content (9%), crashes (4%) and lags and latency (2%) issues that, collectively, only add up to 32%, the report found.

    The report also found screen readers comprised 66% of all accessibility bugs compared to keyboard navigation issues and insufficient color contrast which accounted for only 12%. In terms of localization, poor and missing translations account for more than two-thirds (67%) of bugs, the report found. Based on ongoing feedback data that Applause also continuously collects from customers, nearly half of organizations (47%) identified currency and number formatting as the most valuable bugs to identify when it came to localization.

    Overall, organizations ranked the discovery of crashes (75%), functional bugs (61%) and lag and latency issues (53%) as exceptionally valuable, according to Applause.

    Luke Damien, chief growth officer for Applause, said when it comes to testing, in general, there is still not enough focus on user and customer journeys. That lack of focus is becoming a larger issue as more organizations invest in digital business transformation initiatives that are driven largely by mobile applications, he noted. Payments are especially problematic because they often rely on application programming interfaces (APIs) exposed by a third party in a way that results in suboptimal application experiences that have a direct impact on revenues, he added.

    The challenge is that it’s not entirely clear how far left responsibility for application testing is shifting. In some cases, developers are assuming responsibility. In other cases, a dedicated testing team is still responsible. Developers, of course, will test applications as they build them but application experiences on a local machine may not always be replicated in a production environment. The issue is that most end users today are not especially forgiving when a mobile application fails to meet expectations. Months of development effort can be wasted simply because a function was not tested in a production environment.

    Less clear is to what degree testing will be automated in the future. Machine learning algorithms are making it possible to automate testing of both functions and user interfaces. It’s not likely the need for humans to be involved in testing will be eliminated any time soon, but many of the routine tedious tasks that conspire to limit the rate at which applications can be tested should be sharply reduced in the months and years ahead.

    In the meantime, an organization’s entire brand reputation is now tied to the quality of the application experience it enables on a mobile device. Revenue targets can now be easily missed if users of a mobile device choose one application over another simply because a function was broken—even for a short amount of time. As such, testing has never been more critical given organizations’ dependency on software.

  • GitLab Adds Fourth DORA Metric API to CI/CD Platform

    GitLab Adds Fourth DORA Metric API to CI/CD Platform

    The latest update to GitLab’s namesake continuous integration/continuous delivery (CI/CD) platform has added support for the application programming interface (API) for measuring change failure rates. This addition supports the fourth metric as defined in the DevOps Research and Assessment (DORA) framework.

    Version 14.10 of GitLab also expands the GitLab Runner Operator for Kubernetes to any distribution of the open source platform in addition to making it possible to manually trigger incident responses when needed.

    Finally, a compliance report that surfaces every individual merge request violation has been added along with a tool for setting up streaming audit events.

    Brendan O’Leary, staff developer evangelist for GitLab, said that as DevOps processes continue to mature, DORA metrics make it simple for IT leaders to measure overall progress. While it’s not likely that any single set of DevOps practices will be universally implemented across an entire enterprise, O’Leary noted it’s important for DevOps teams to keep track of key performance indicators (KPIs) that enable teams to identify areas for ongoing improvement. For example, it’s not uncommon for technical debt to accumulate in the absence of metrics that track the progress of builds, he added.

    In general, a transition to microservices-based applications is increasing the need for CI/CD platforms that make it simpler to build them. Each of these applications is constructed using microservices that are typically built independently of one another. The challenge is that each microservice has dependencies on other microservices, so the need for DevOps workflows to optimally manage that development process is becoming more widespread, noted O’Leary.

    In some cases, organizations are deploying a CI/CD platform for the first time to build these applications. In other cases, they are looking to replace a CI/CD platform that was adopted to build legacy monolithic applications. Regardless of the type of application, there is a need to continuously refine and improve software engineering practices to increase developer productivity.

    It’s not clear to what degree developers are voting with their feet to work for one organization versus another based on the overall quality of developer experience. Organizations that do have a consistent approach to software engineering, however, make it easier for developers to spend more time writing code rather than managing the build process. The challenge is to make sure the DevOps platform itself does not become a bottleneck that hinders the rate at which developers can build code. It’s also not clear whether organizations are building applications faster than they can secure it and ensure overall quality. The only way to know for sure is, of course, to track metrics.

    Naturally, not every developer is a fan of metrics. Application development is still as much art as it is science. There is, however, a general appreciation that the amount of code that needs to be written far exceeds the available talent to write it; any effort to make software engineering more efficient benefits everyone involved. As such, given all the code that needs to be written, a software engineer is often today the best friend a developer can have.

  • Hasura Adds Join Capability to GraphQL Engine

    Hasura Adds Join Capability to GraphQL Engine

    Hasura today announced it has extended its GraphQL engine to make it possible to join data generated by multiple sources.

    Hasura CEO Tanmai Gopal said GraphQL Joins makes it possible to join data from across different GraphQL services that can then be accessed via a single GraphQL application programming interface (API). The extension of the federation capabilities enabled by the Hasura GraphQL engine eliminates the need for custom code that would otherwise be required to join that data, he added.

    The Hasura engine automatically generates a GraphQL schema from a data source that can then be used to accelerate the development of APIs. GraphQL Joins extends that federation capability to now include multiple GraphQL and, eventually, other data sources accessed via, for example, legacy REST APIs, said Gopal. That capability will make it easier for a wider range of developers to build applications that aggregate data across multiple sources, he added.

    The core Hasura Engine is based on open source software that the company claims has now been downloaded more than 500 million times. Hasura makes available a cloud service based on that core engine. That approach eliminates the backend complexity that IT teams encounter when adding GraphQL APIs to an application environment that already has a range of APIs that internal IT teams need to support, noted Gopal.

    GraphQL was originally created by Facebook, and it’s still not clear to what degree GraphQL APIs will supplant REST APIs. Developers tend to prefer GraphQL APIs because they provide more granular control over what data is accessed. The challenge is the number of backend services that expose GraphQL APIs is still comparatively limited. Most IT teams will not be replacing REST APIs with GraphQL-based APIs overnight, but the percentage of new applications that rely on GraphQL APIs will steadily increase. DevOps teams looking for easier ways to provide developers with access to backend services via a GraphQL API can employ the Hasura Engine to automate that process.

    Overall, the number of APIs employed within IT environments is rapidly expanding as more microservices-based applications are deployed. Each microservice generates its own API. Over time, IT teams will find themselves managing a range of types of APIs to support multiple digital business transformation initiatives that an organization may have simultaneously launched. In addition to building APIs, many of those organizations are now consuming data via APIs exposed by another organization. Over time, the level of interdependency between APIs and applications will serve to make application environments much more complex. The good news is that APIs make it easier to upgrade—and even replace—backend services without disrupting application services.

    It’s not always clear, though, who within IT organizations will manage those APIs. They are often created by developers that then look to IT operations teams to maintain them. Before too long, it’s not uncommon for IT teams to find themselves managing hundreds, perhaps thousands, of REST and web services APIs—and soon, that may include many built using GraphQL.

  • SRE Vs. DevOps: The Wrong Question?

    SRE Vs. DevOps: The Wrong Question?

    The age-old question about the competition between DevOps and SRE sets up a false dichotomy. DevOps is a methodology while SRE is a team within operations. Although the two are often pitted against one another, developers also embody the skills and the capabilities to implement fixes. 

    Traditionally, application changes were reactive. The process of SRE formalizes problem resolution playbooks for better efficiency within the development life cycle. This has changed substantially over the past few years with DevOps seeing more traction and mainstream adoption.

    So what is the modern relationship between DevOps and SRE and how can they best be used together? Let’s understand DevOps first.

    Defining DevOps 

    According to Chef’s Embrace DevOps guide, DevOps is about transforming the way companies run; part of that transformation is understanding that companies should focus on managing people rather than products. DevOps evolved over the last decade and was originally born into the world of software. The adoption of cloud technologies, changes in the tech stack architecture, SaaS platforms, and security regulations have all impacted DevOps culture

    Some of the fundamentals of modern DevOps are:

    Everything-as-code: The current state of IT architecture has adopted an “everything-as-code” approach. Infrastructure, configuration, compliance and security can all be transformed into code.

    Automate everything: Codifying everything enables standardization of processes and policies across the organization. The processes are simplified into repeatable functional code, and this makes it easier to automate the development and deployment processes while significantly reducing human errors.

    Validation: There are many tools used for continuous integration, delivery and deployment in addition to other tools used for maintaining infrastructure and compliance. Without validation, there would be no way to know if everything is functioning as needed and it would be difficult to ensure seamless delivery in a highly agile environment.

    Above all, teams adopting DevOps methodologies take end-to-end responsibility of managing the application development life cycle (develop, deploy and maintain). They bridge the responsibilities gap between Dev and Ops into one team. 

    SRE Focus Areas 

    Successful site reliability engineering (SRE) teams focus on the volume of performance metrics and the process of shifting left the responsibility for managing and mitigating risk. Fundamentally, they share the same values as developers in creating efficient applications. However, SRE teams focus on introducing efficiencies based on incidents that occur and sometimes need development teams’ intervention to shift the risk left in the product development cycle. 

    Troubleshooting is one of the main responsibilities of SRE teams since they have to manage incidents. As a result, SRE teams have a strong knowledge of product design which is essential for product reliability, rollouts and reducing recovery time. Scalable automation is also a big part of the challenge SRE teams face. Oftentimes, tasks are done manually and this can increase the likelihood of human error. A solution is implementing a policy-as-code approach in concert with developer teams.

    It should be noted that when it comes to the responsibility and scope of work between SRE and DevOps, the lines are blurred—especially with the proliferation of APIs and when evaluating microservices. The types of tools being used are a differentiator since SRE teams measure efficiency through monitoring, detection and incident reporting systems. 

    Breaking the Silos 

    Modern organizations will fail when divided into silos. Developers understand that to optimize their internal processes, they need to use a DevOps methodology and involve SRE teams. For example, a startup growing and looking to scale needs development teams that are performing SRE functions with strong operational knowledge. It requires buy-in and understanding of every team member to know their role and the needs of the organization as it grows and responsibilities shift. 

    These fundamental values are crucial for an enterprise looking to achieve an efficient CI/CD pipeline. In a reactive cycle, SRE teams step in and are responsible for some parts of operations, but the DevOps paradigm is different because it integrates the responsibility of deployment, monitoring and remediation throughout the entire team. 

    Organizations embracing DevOps practices should embrace SREs’ expertise and welcome their practices into developer teams. SREs can leverage automation to fix issues as they occur and also make changes in software architecture to avoid such issues in the future. Compared to the reactive approach, developer teams are incentivized to keep things constantly running. 

    Scaling DevOps practices requires shared responsibility. Of note, developers have to answer when the phone rings and this can cause chaos in engineering teams responsible for large enterprise-grade applications with fast time-to-market and frequent update cycles.

    A Modern Perspective

    Efficiency is a core value shared by both SRE teams and the DevOps methodology. When organizations can fully integrate operations within the DevOps cycle, those silos can be broken down and integrate a shift left mentality. The traditional reactive remediation cycles won’t cut it anymore. Proactivity is essential for today’s lightning-fast application needs and continuous updates. 

    Application problems can be addressed immediately when approached with modern tooling and a policy-as-code approach enabling developers and SREs teams to work together. The modern relationship between DevOps and SRE teams should be one of coexistence. Both are needed for successful scalability within the enterprise. Many once thought SRE teams and developers couldn’t coexist in harmony, but debunking that myth helps organizations optimize their collaboration efforts. 

  • Datadog Unfurls Application Security Service

    Datadog Unfurls Application Security Service

    Datadog, Inc. today made generally available an Application Security Monitoring (ASM) service that is based on the same agent software that many DevOps teams already use to monitor applications.

    Pierre Betouin, vice president of product for the cloud security platform at Datadog, said ASM is designed to make it simpler for DevOps teams to add additional DevSecOps best practices to their existing workflows. The ASM service is based on a runtime application self-protection (RASP) engine and web application firewall that Datadog gained with the acquisition of Sqreen a year ago.

    ASM then employs distributed tracing to discover code-level vulnerabilities such as server-side-request forgeries (SSRFs), SQL injection and cross-site scripting (XSS) flaws. It is designed to extend an existing Datadog Cloud Security Platform that includes cloud security posture management (CSPM), cloud workload security (CWS) and cloud SIEM services.

    The overall goal is to make it simpler for DevOps teams to address application security by eliminating the need to deploy and maintain a separate set of agents within applications, said Betouin. That approach reduces resistance among DevOps teams that would otherwise be concerned about the additional overhead another approach to application security would add to an application environment, he added.

    The number of organizations looking to implement DevSecOps best practices is expected to increase in the weeks and months ahead in the wake of a series of high-profile breaches and zero-day vulnerability disclosures. Many organizations are now performing security reviews across their entire software supply chain as part of an effort to discover any malicious malware that might have been inserted into applications.

    The challenge those organizations face is that as application environments become more dynamic, maintaining application security becomes more difficult as code is continuously updated. The best way to address that engineering challenge is to extend the reach of an observability platform that many DevOps teams already have in place, noted Betouin. Ultimately, the goal is to automate application security as much as possible but that’s not going to be achievable if DevOps teams lack the context required, he added.

    It’s not clear at what rate organizations are embracing DevSecOps best practices. However, it’s clear that DevOps teams are being held more accountable for application security. Most developers are now charged with becoming application security experts overnight, so the only way to effectively ensure application security is to uncover security flaws before applications are deployed in production environments.

    There are, of course, multiple ways of achieving that goal. Datadog is betting that the path of least resistance is via a cloud service that connects to agent software inserted within those applications. DevOps teams have been inserting agent software, in one form or another, into those applications for years. The issue is that with each new agent added there is yet another software component that needs to be deployed and regularly updated. If not carefully tracked, a DevOps team could find itself attempting to manage an entire portfolio of agent software for every platform employed.

  • Riverbed Unveils Unified Observability Platform

    Riverbed Unveils Unified Observability Platform

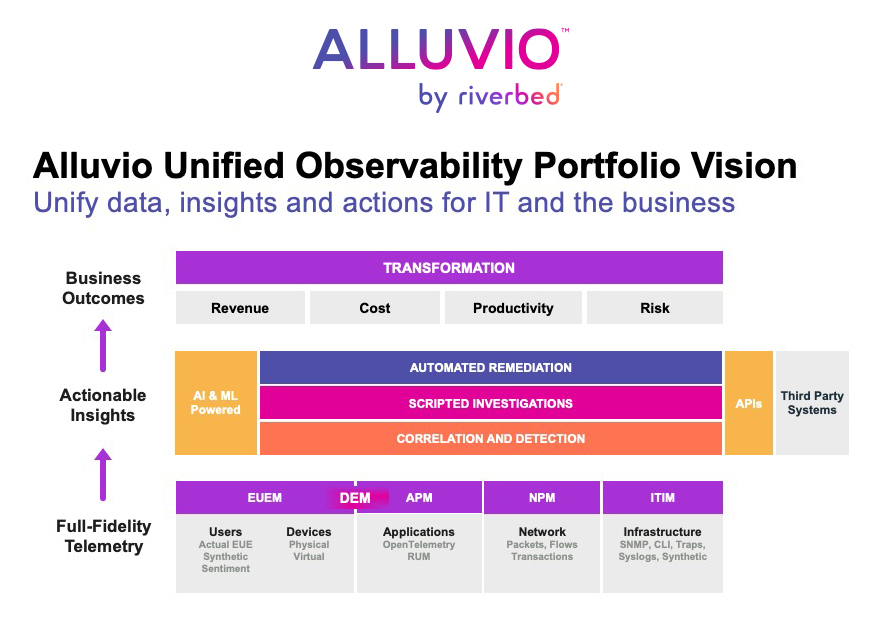
    Riverbed today launched a beta of a unified observability platform it will make available under the Alluvio by Riverbed brand name.

    Jim Hansen, senior vice president for product management at Riverbed, said the Alluvio by Riverbed observability platform combines several existing network and application performance management platforms into a single offering that is now infused with machine learning algorithms to provide deeper insights into IT environments.

    The goal is to provide an open observability platform that can not only aggregate data collected from both Riverbed and third-party offerings but also identify the best ways to resolve an IT issue, added Hansen.

    Scheduled to be generally available later this year, the Alluvio by Riverbed observability platform will differ from existing observability platforms in that it will enable IT teams to not just identify the root cause of an IT issue, but also note which processes should be employed to resolve it, he said.

    With this launch, Riverbed is attempting to reposition itself. Previously, the company offered network and application performance management platforms alongside a wide range of network software and hardware. Each of those offerings is now a source of data that can be fed into the Alluvio by Riverbed observability platform, noted Hansen.

    Observability, of course, has always been a core tenet of any DevOps best practice. Achieving that goal, however, has proven to be elusive. Most of the IT monitoring tools used today are designed to track a set of pre-defined metrics. Whenever there is an issue, IT teams typically convene in a war room where they try to uncover the root cause of, for example, a performance issue by comparing reports and the various dashboards generated by monitoring tools. It can take weeks to discover an issue that often only takes a few minutes to fix once the source of the problem is identified.

    In contrast, observability platforms promise to reduce the time required to discover IT issues by aggregating all the data generated by the IT environment within a single platform that correlates events and makes it easier to identify anomalous behavior. Armed with those insights, it becomes a lot simpler for IT teams to launch queries that enable them to resolve issues faster.

    Those insights are also increasingly being used to drive business decisions as organizations become more dependent on software to drive digital business transformation initiatives. However, a recent survey conducted by Riverbed finds three-quarters of business decision-makers (75%) said their organizations struggle to glean actionable insights from data generated by their technology infrastructure.

    The challenge IT teams inevitably encounter is they don’t always know the right questions to ask, which is an issue that can be addressed by machine learning algorithms capable of identifying anomalies indicative of an IT issue that needs to be resolved.

    There already is no shortage of observability platforms. The issue now is determining which observability platform to employ across a distributed IT environment that is becoming more instrumented with each passing day.