Category: DevOps Toolbox

  • Avoid the DevOps Temptation to Build It Yourself

    Avoid the DevOps Temptation to Build It Yourself

    As tempting as building your own DevOps incident communication tool sounds, you should think twice.

    My colleagues and I recently were on the phone with a company seeking an IT incident communications and collaboration solution (a.k.a. IT alerting) to eliminate the time wasted with inefficient communications between teams when dealing with major IT issues.  We were talking to Jeff, the director of IT operations, and Alec, the incident manager, about how our customers benefit from using IT service alerting solutions to automate the communication to their Dev and Ops teams, the stakeholders and the impacted customers every time a major IT incident is identified.

    We insisted on the fact that communication automation not only would save them a significant amount of time but also provide a consistent, predictable and repeatable process with timely and relevant communications to the different groups of people. We then moved to the ROI discussion; very easily we were able to quantify the hard dollar gains they would realize. In fact, the company estimated that an unplanned downtime of its most mission-critical business application costs the organization an average of $1,700 per minute during business hours, and half of that when issues occur at night. Depending on the nature of the incident, they need to get anywhere between five and 14 people from several teams on a restoration call or war room, and it takes them at least 20 minutes to get the right people.

    Right there, by automating the communication and the escalation, they could reduce that time down to five minutes and save the business at least $25,500 per incident.

    We were 20 minutes into the call when the conversation took a very interesting turn. Based on the cost savings we had calculated, Jeff and Alec start thinking  they may just be able to build their own communication automation solution in-house. “I’m pretty sure we can find a few developers and a DBA for a few weeks and get this done,” Jeff said.

    An IT communication automation solution provides the ability to reach out to the right on-call people via different communication channels (voice, text, SMS, mobile app) until they reply. If they don’t, automated escalation kicks in and the next person is contacted. Once they acknowledge they’ve received the notification, they can jump on the incident restoration call in one click. The solution also enables the incident manager to notify hundreds or thousands of impacted customers within a few minutes so frustrated users don’t start calling the help desk.

    “That’s a possibility, of course,” I said, “but do you really have an idea of what it would take to design the solution, build it, maintain it and support it when it is being used in production?”

    Jeff had raised a very good point, indeed. Why not build your own solution when you have software development resources available internally? The conversation had shifted from talking about our out-of-the-box solution to digging into what it would take for DevOps to build their own.

    What Does it Really Take to Build an IT Communication Automation Solution?

    The problems Jeff and Alec raised are all really big problems, and they are big enough for many IT departments for them to decide to go down the path toward building and deploying their own internal IT alerting solution. This may be the right way to go, but you need to think through the development effort involved and, more importantly, support the maintenance of this new DevOps tool.

    For some small shop, it may seem like a good idea, but building a reliable and economically viable IT alerting solution in-house requires more than just funding a development team for a few years and negotiating a good plan with telecom providers for SMS, voice and conference calls in the United States and in the countries where your IT people might be.

    You will need to consider the cost to develop the solution, host it, support and maintain it.

    To develop the solution, you’ll need to assemble a team comprised of a software architect, a few developers, a mobile app developer, a dba and a UX designer. Also, make sure they stick around for a few years so they can support and maintain their custom code and bring new features together as the tool becomes utilized across the enterprise. You surely want to avoid turnover here. The great benefit of such a custom-built solution is that it should address your specific needs, whereas a solution from a vendor may only accommodate 90 percent of those.

    These seven developers will cost you about $1 million U.S., and this is not including resources for QA and UAT, the infrastructure guys and a technical writer. That’s another few hundred thousand dollars per year, at least, until the tool is ready for prime time!

    In addition, you will need to reserve some operational budget to cover the cost associated with hosting, operating, monitoring, supporting and maintaining the solution:

    • Hosting the tool. Account for the hardware, the databases and the software you’ll need to build, test and run the solution in the production environment. If you want the solution to be highly available, you will also consider active-active clusters and a disaster recovery site. That’s another few thousand dollars U.S. every year.
    • Monitoring the tool. This new IT alerting tool most likely will be flagged as a critical application in your IT ops toolset and will require monitoring by the NOCs along with a runbook and an escalation procedure in case of a problem. Isn’t this a catch-22? When something wrong happens with your brand new IT alerting tool, you won’t be able to use it to reach out to the on-call people. Make sure you have a special emergency runbook for when this occurs. If you include technical maintenance, bug fixing, QA, that may add up to a half full-time employee, or roughly $75,000 per year.
    • Integrating the tool. It is most likely that you will want to integrate your IT alerting tool with other IT infrastructure and IT service management (ITSM) tools you are currently using so that communications can be triggered automatically as soon as a critical incident is detected. You may need to find a few API developers to make this happen. Remember, those integration connectors all must be maintained and tested with every new release of these IT operations management and ITSM tools.
    • Communicating with the tool. Besides voice, text and SMS, if mobile app push notification is a requirement then you need to build a mobile app so people can update their schedule and availability from their smartphone. This is a great feature that also will need to be developed, hosted, supported and maintained.
    • Running the tool. You will need to provision for all your communication costs should they be voice, internal voice, SMS, international SMS and collaboration tools such as conference calls. This can become significantly expensive, especially if you have distributed teams across continents. Jeff said the company had on average two critical incidents per week, with an average of 10 people on each call who would spend an average of three hours per conference call. That’s almost 200,000 minutes per year for conference calls only, not including SMS and voice. Prices range from a few pennies per minutes in the United States to a few dimes in other countries.

    What’s The Alternative to Building it?

    There are several IT alerting solutions available out there. Some are:

    • Designed for small local teams, others for broader and more distributed IT organizations.
    • Built for IT operations teams, others are built for the Service Desk.
    • On premise, others are cloud-based.
    • Only cover the USA, others offer worldwide coverage.
    • Are more expensive than others.
    • Subscription based, others offer perpetual licenses.
    • Mono product, others offer a platform you can leverage for other use cases.

    There’s a large variety of solutions you could choose from which will address most of your current needs. As a result, you may be tempted by a subscription based plan so you are not stuck with perpetual software licenses and lengthy onsite installation and configuration, support and maintenance. In additional these vendors need to meet their SLAs which will give you the assurance of a constant and good quality of service. Remember that they are also incentivized to deliver best in class customer service because subscription models imply they need to keep you as a happy customer year over year.

    How Should I Decide Which is Best for My Organization?

    It should be pretty straightforward. If you are passionate about IT alerting then go for it and build or hire a team, provide them with a roadmap and cross your fingers that everything will go smoothly and on time.

    At the opposite, if IT Alerting is outside your core business, if you don’t have bandwidth to develop this new IT Ops tool or if you need it sooner than later, then I think you are better focused on other IT projects which will have a direct positive impact on the core business of your enterprise. Save the time and budget to better align with the business and bring the new features that the business demands faster to market. If this is the case then you may consider speaking with an IT Alerting vendor. Gartner can provide insight on these vendors and how they integrate with the appropriate IT tools.

    There are so many dependencies that it will always be less expensive to buy the service from a vendor whose focus is on IT Alerting than it would be for you to build one from scratch. Today most companies are undergoing some kind of digital transformation which means more and more of the services they deliver will rely on IT. The odds of something going wrong with IT and impacting the company’s business operations have never been so high and they are only growing exponentially. Add to this the increased mobility of employees and distributed nature of teams due to acquisition, or cost optimization, and you now realize how challenging the Build-it-Yourself ­­option can quickly become.

    At the end of the day, you and your teams have a much greater chance to be rewarded and recognized by your upper management for helping the company being more efficient and gain market share over your competition than for developing a new IT Ops tool which you could have bought from a provider!

    Prior to this call, I doubt Jeff had thought through all the details of building the solution in-house, all the associated costs he would have to engage for building, supporting and maintaining his new IT Ops tool.

    We’ll see what comes out and what Jeff, his team and the CIO finally decide to do, but here’s what he said when we wrapped up: “Good thing we talked today, and I am sure we’ll be speaking again very soon”. We’ll be talking again to Jeff and his team and find out what way they want to go with their IT Alerting solution: Build it or Buy it?  This is the question.

    Can We Remain Sane Without IT Alerting?

    Without IT service alerting, when a critical IT incident occurs, the service desk or the critical incident manager ends up manually going through the following:

    • Internal procedure documents or runbooks to find out “what team(s)” should be responding to the incident.
    • Spreadsheets to identify “who” within the team should be contacted, then through listings to check “who is actually available.”

    And this becomes tricky when the teams are distributed across buildings, across geographies and countries, as you need to account for time zones, vacations, time-off, sick days and anything of this nature that may prevent someone from responding to notifications.

    Let’s say a dozen people from different teams have been identified to investigate a mission-critical application failure. That means you need to pull someone from the database team, two from the infrastructure team, three developers, two network engineers, the incident manager for this case, someone from UAT, two people from the NOC and someone from support. The developers are in Beijing, the service desk is in Atlanta and the two NOCs are located in the U.K. and the United States.

    Now, they need to be contacted as quickly as possible and the war room needs to be assembled so they can start investigating the issue and come up with a resolution action plan. Plus, in some cases, more than a hundred people would be involved in a single restoration call for a few hours, and sometimes for days. I’m not going to throw any company names here, but you can easily find these disastrous stories online as they very often make mainstream press headlines.

    In the meantime, don’t forget, the clock is ticking and every minute that passes means:

    • Bigger revenue losses for the company, particularly  in the case of an e-commerce website failure or slowdown,
    • Employee productivity drop-off when the ERP system fails,
    • Patient safety degradation if your EMR/EHR experiences a full or even a partial outage, and
    • Big mess ahead when an airline reservation system has a hiccup.

    As a reference point, the website Geekwire estimates that Amazon loses around $120,000 per minute when the site is not performing fast enough.

    In these situations, you need all hands on deck to act quickly. Not only do you need to contact every person individually, but also ensure they respond to the call and commit to working on solving the issue. As you know, emails don’t wake people up, especially on a Sunday at 2 a.m. What if not all the IT experts answer the message within the allocated time frame? You now need to escalate to the next person on the list and try reaching out …

    Also, people are not always reachable via the same channel at all time, in all countries. Some may prefer a phone call during the night and a SMS during weekends. For others, the best way to reach out is via mobile app push notifications. Ask yourself, is English OK for everybody, or do you need to take into account possible translation needs for different languages?

    Even though you are able to get the right contact information for all the right people, calling each and every person and explaining the situation can take a very long of time, and the clock is still ticking. By that time, users of the IT service may have already experienced service degradation and have started calling in to the help desk or entering tickets online. Not only do you have to deal with the outage, but your IT department is now drowning in a ticket storm. The clock is ticking and the phone is now ringing!

    If you are facing an e-commerce website slowdown or outage, you will also need to deal with bad reviews and negative comments being Tweeted and shared about your company over social networks.

    Vincent Geffray


    About the Author/Vincent Geffray

    Vincent Geffray is Senior Director of Product Marketing at Everbridge with focus on IT Service Alerting & Communications Automation and IoT.

    He has more than 14 years of experience in the information technology business, designing, promoting and selling Enterprise IT Operations Management solutions, including Critical Communications, Application Performance Management, IT Process and Workload Automation. He also has international experience as he started his career in Europe. Vincent holds a Master of Science (Mechanical Engineering and Computer Science) and executive certificates from the MIT – Sloan School of Management.

    Vincent’s LinkedIn: www.linkedin.com/in/vgeffray

    Vincent’s Twitter: @vgeffray


  • How to Fail at Test Automation

    How to Fail at Test Automation

    Let me start by admitting that I am not a test automation expert. I have done some work with test automation and have supervised teams who practiced it, but when it comes to the intricacies of it, I have to call a friend. It is from such friends that I have learned why so many test automation efforts fail. Talking to people about test automation validates my impression that this is the DevOps-related practice that people most often fail at.

    Let me share the four reasons why test automation fails, in the hope that it will help you avoid these mistakes in your test automation efforts.

    Before I go into the four reasons, allow me one more thought: Test automation is actually a bad choice of word. You are not automating testing, you automate quality assessments. What do I mean by that? It is a mistake to think of test automation as automating what you otherwise would do manually. You are finding ways to assess the quality of your product in automated ways and you will execute it way more often than you would do manual testing. This conceptual difference explains to a large degree the four reasons for test automation failure below.

    Reason 1: Underestimating the Impact on Infrastructure and the Ecosystem

    There is a physical limit of how much pressure a number of manual testers can put on your systems. Automation will put very different stress on your system. What you otherwise do once a week manually you might now do 100 times a day with automation. And into the mix an integrated environment, which means external systems need to respond that frequently, too. So you really have to consider two different aspects: Can your infrastructure in your environments support 100 times the volume it currently supports, and are your external systems set up to support this volume? Of course, you can always choose to reduce the stress on external systems by limiting the real-time interactions and stub out a certain percentage of transactions or use virtual services.

    Reason 2: Underestimate the Data Hunger

    Very often test automation is used in the same system where manual testing takes place. Test automation is data-hungry, as it needs data for each run of test execution and, remember, this is much more frequent than manual testing. This means you cannot easily refresh all test data whenever you want to run test automation and have to wait until manual testing reaches a logical refresh point. This obviously is not good enough; instead, you need to be able to run your test automation at any time. There are a few different strategies you can use (and you will likely use a combination):

    • Finish the test in the same state of data that you started with;
    • Create the data as part of the test execution;
    • Identify a partial set of data across all involved applications that you can safely replace each time; or
    • Leverage a large base of data sets to feed into your automation to last until the next logical refresh point.

    Reason 3: Not Thinking About the System

    Test automation often is an orchestration exercise as the overall business process in test flows across many different applications. If you require manual steps in multiple systems, then your automation will depend on orchestrating all those. By just building automation for one system you might get stuck if your test automation solution is not able to be orchestrated across different solutions. Also, some walled-garden test automation tools might not play well together, so think about your overall system of applications and the business processes first before heavily investing in one specific solution for one application.

    Reason 4: Not Integrating it into the Software Development Life Cycle

    Test automation is not a separate task; to be successful it needs to be part of your development efforts. From the people I have spoken to there is general agreement that a separate test automation team usually doesn’t work for several reasons:

    • They are “too far away” from the application teams to influence “ability to automate testing,” which you want to build into your architecture to be able to test the services below the user interface;
    • Tests often are not integrated in the continuous delivery pipeline, which means key performance constraints are not considered (tests should be really fast to run with each deployment);
    • Tests often are not executed often enough, which means they become more brittle and less reliable. Tests need to be treated at the same level as code and should be treated with the same severity. This is much easier when the team has to run them to claim success for any new feature and is much harder to do when it is a separate team who does the automation. It also will take much longer to understand where the problem lies.

    Of course, absence of failure does not mean success. But at least I was able to share the common mistakes I have seen and, as they say, “Learning from others’ mistakes is cheaper.” Perhaps these thoughts can help you avoid some mistakes in your test automation journey. I do have some positive guidance on test automation, too, but will leave this for another post.

    And in the case you found your own ways of failing, please share it in the comments to help others avoid those in the future. Failures are part of life and even more so part of DevOps life (trust me, I have some scars to show). We should learn to share those and not just the rosy “conference-ready” side of our stories.

    Test automation is for me the practice that requires more attention and more focus. Between some open-source solutions and very expensive proprietary solutions, I am not convinced we in the IT industry have mastered it.

    One bonus thought: If you cannot automate testing, automate the recording of your testing.

    If you cannot automate testing, find a way to record the screen with each test by default. Once you identify a defect you can use the recording to provide much richer context and make it a lot easier to find the problem and solve it. Verbal descriptions of error are very often lacking and don’t provide all the context of what was done. I keep being surprised how long triage takes because of the lack of context and detail in the defect description. There is really no excuse for not doing this. Record first, discard if successful, attach it to the defect record if you find a problem.

  • What Does DevOps Mean to Test Teams?

    What Does DevOps Mean to Test Teams?

    It wasn’t long ago that the Dev and test teams would work late hours, focused and rushed to meet a deadline: rapid fixing, reprioritizing and deferring bugs to close out the bug list, move everything to the staging server, do one last run of the regression and pass it over to Ops/IT to move to production. What happened after? No one knew. For most Dev and test team members, Ops is a black box. More often than not, they are oblivious to what happens at Ops, the roles, responsibilities and timelines. One day—long after the drop-dead deadline for Dev and test teams—after delays, questions and changes, the product went live.

    Does this scenario sound familiar? Well, DevOps is supposed to be a game changer.

    DevOps means many things to many people. But for test teams, continuous testing (CT) is the primary task in DevOps. And, CT is not merely rerunning the same set of “full regression” tests over and over, as product gets delivered and deployed. This is actually a recipe for disaster and not the intent of continuous testing.

    What is CT and How Do Traditional Test Teams Fit In?

    Recently, test teams were challenged to ramp up their practices by moving to agile and scrum. DevOps will propel the teams to now ramp their practices up even more—more automation, more technical testing and more tools to leverage. If your test team already has mature agile practices, with continuous testing, they can mature further to eventually accelerate the product release.

    Continuous testing grows from continuous integration (CI).

    Starting with CI, test teams joined the process with automated smoke tests. A strict view on CI is about automating the build process. Yet for anybody doing CI today, that is just the start. The reality of CI using tools such as Jenkins, Bamboo or TeamCity is that after automating the build process, the unit tests are rerun, the automated smoke tests (at the user interface, API level or wherever) are run and many companies build on that to include automatic rerunning the full regression in the test environment, then automatically running some set of tests against some number of VMs. This growing in CI levels of “awesomeness” is becoming a common practice. You may ask, “Isn’t this continuous testing or approaching continuous testing?” CI is the foundation. It grows from there.

    Continuous testing is a lean process of quality at every step. It includes quality user stories, quality environments, quality unit tests and quality performance tests. It is “testing at every step” and not “QA” at the end. It is also shifting testing tasks from Ops at the end, by testing earlier and testing all along the way. CT is adding more tasks as well.

    Test Strategy

    The success of CT is in its ability to get everyone involved and not just the test team.

    Running the right tests at the right time on the right environments was never an easy task. In modern development, testing—unit tests, performance tests, security tests, functional tests and workflow tests—is everyone’s responsibility. It’s the foundation of continuous testing.

    The test strategy for continuous testing is quite different than agile testing strategies. In agile, testing very often relies on a regression or a release sprint before deployment for bigger and longer tests, followed by Ops teams doing their own performance and security tests on a staging environment. In DevOps and the “shift left” approach, all these tests need to be run earlier and more often as part of the test team’s suites.

    So far we have developer unit tests and automated smoke tests run with CI, an automated full regression that gets run often. These tests in addition to manual tests, which are the normal part of new user story development during sprints, continue to be a part of continuous testing.

    Continuous testing gets bigger from here. Ops/IT builds environments and data for test teams through virtualization, VMs, containers, in the cloud, etc. Test teams will automate more and run different types of tests, much earlier, against the virtualized environments that are the same as in production. The idea is to take what used to be late development and final tests and shift them left, earlier in test cycles. Thus, eliminating a regression or release sprint and having the product ready for delivery continuously.

    Longer workflow and integration tests now must be automated and run against the builds for continuous delivery, as well as load, performance and security tests run at various points during development. This presents many problems for testing and Ops to resolve.

    This brings up the question, when do test teams do usability, soap opera, end-to-end path, workflow and task-based tests? These are tests focused on completing a full user task as opposed to testing an isolated individual function. Are those automated? Longer tests tend to break more and are more complicated to automate. Many teams automate their regression tests but exclude from the complex, difficult or long scenario tests. These require a higher level of automation skill. Too many automation tests today are small, isolated tests that validate individual functions. We all know that is not how users use a product. They use functions in various sequences, combinations and varieties of data. It is certainly not an easy task to automate and maintain all of those more complex tests.

    Also, many test teams have not been responsible for running performance, load and security tests. Traditional test teams may, in the DevOps world, still not be the team writing them. They may manage or execute these new testing tasks earlier as part of their regular automated suites. A good strategy will define when and how often these tests will be run.

    Remember, the goal of CT is immediate feedback. A common question that arises is that why can’t every test be put into one giant automated suite and have it run all the time. That is not required. We don’t need to run the same tests so often for immediate feedback. It is better to have lean and mean suites of tests that are run strategically. Run unit tests, feedback, go to the next step, run smoke tests, feedback, go to the next tests and so on.

    Automation

    I still see teams struggle with agile automation. They can’t automate enough in the same sprint, the automation is fragile, there is no methodology, which can lead to the suite staying too small, or conversely, getting bloated and slow when we need lean and mean. These problems need to be fixed before attempting CT.

    Equally important is that some teams still don’t have adequate resources to manage and maintain an automation framework, code new tests, thoughtfully retire old tests and effectively work on new user stories in new sprints. Where there are many teams that will easily slide in continuous testing, there will be more teams who cannot keep up with the new demands and compressed delivery requirements.

    Leveraging technology

    Many teams still suffer from data and environment issues. Luckily, virtualization, containers and the cloud, can take care of these by leveraging popular technologies. But most test teams will need the help of Ops to get this accomplished.

    SOA/Microservices

    There is a swiftly growing trend of building applications out of services. The trend is not new but has been picking up steam. From APIs to service-oriented architecture to web services to microservices, testing is evolving into exercising the integration of products made up of services. The use of containers has sped up the use of services. Test teams must have the knowledge, skills and tools to adequately test and automate the testing of these services.

    Outsource service testing if you don’t have the skill within your test team—don’t skip it. Waiting to test these through a user interface (UI) is always possible, but isolating a defect once it happens is much tougher through a UI than at the service level. Running a service test through the UI is not quick and easy. The most important reasons we automate so much in continuous testing is to get quick and easy feedback on the health of the system. Skipping testing API or any service at that service level is not OK anymore.

    Summary

    Testing is no longer the responsibility of a silo QA team. It is everyone’s job!

    Scrum and big movement on XP practices such as TDD or simply doing a bunch more unit testing has greased the skids for the whole team to be more responsible. Everyone on the team has to test. If you can’t, then DevOps is not for you.

    Test teams will need sophisticated automation engineers, and Ops/IT staff to support environments, data, VMs, containers and all of the virtualization needs of the test team.

    Intelligent, lean and mean test automation is the test team’s primary goal. If your dev and test teams already have mature and efficient agile practices, low maintenance test automation and a good continuous integration process in place, then continuous testing and DevOps is the next step in achieving hyper-efficiency. Everyone in the enterprise benefits by bringing Ops/IT and its processes into the dev process much earlier, by shifting left, and taking advantage of the advances in virtualization and infrastructure automation.

    About the Author/Michael Hackett

    Michael Hackett PhotoMichael is a co-founder of LogiGear Corporation, and has over two decades of experience in software engineering in banking, securities, healthcare and consumer electronics.

    Michael is a Certified Scrum Master and has co-authored two books on software testing. Testing Applications on the Web: Test Planning for Mobile and Internet-Based Systems (Wiley, 2nd ed. 2003), available in English, Chinese and Japanese, and Global Software Test Automation (HappyAbout Publishing, 2006). He is a founding member of the Board of Advisors at the University of California Berkeley Extension and has taught for the Certificate in Software Quality Engineering and Management at the University of California Santa Cruz Extension. As a member of IEEE, his training courses have brought Silicon Valley testing expertise to over 16 countries.

    Michael holds a Bachelor of Science in Engineering from Carnegie Mellon University.

  • What is JSON? How Do I Use It? Does It Beat BSON?

    What is JSON? How Do I Use It? Does It Beat BSON?

    TL;DR: If you’ve ever wondered about JSON—what it is, how to use it or what it has to do with BSON—then you’ve come to the right place. In this article I’ll explore what these acronyms stand for and what these formats do in the world of programming and databases.

    What is JSON?

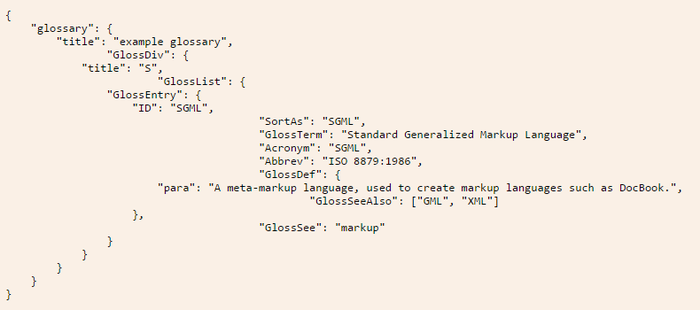
    JSON stands for JavaScript Object Notation. Basically, it uses syntax derived from JavaScript to represent data in a way that is readable to both humans and machines. For instance, an example used on the JSON website describes a glossary in JavaScript Object Notation, as shown in the figure below.

    JSON Example

    How to Use JSON

    As you can see, a hierarchy is created that encloses each level within a set of curly braces ({}). At each level, you have name/value pairs, such as “title”: “example glossary”. In the same way that JavaScript objects work, the value part of the pair can open yet another level by starting a new set of curly braces. This creates a well-structured layout of the data that can be scanned easily for information by machines, as well as be looked at by humans to find what is needed.

    This notation allows a number of data types to be represented—numbers, strings and Booleans, hashes (enclosed by {}) and arrays (enclosed by []) all can be used in this format.

    Once data is represented in this notation, a JSON parser can be used in most any programming language to turn this notation into the native data types for that language, thus allowing programmers to access the data using that language’s natural syntax. Since this notation is so prevalent, most programmers have a great deal of experience in storing and retrieving this type of data.

    Does It Get Used in Databases?

    Document databases typically store data in JSON format or something based upon that format. Rather than the tables and rows used by a relational database, a document database will store and query information through the use of the JSON format.

    These databases refer to each set of JSON data as a document. Since the structure is hierarchical, each document can have subdocuments on any of its keys. This setup makes it very easy for a programmer familiar with the language to both store and query the data within the database.

    What is BSON?

    BSON stands for Binary JSON. This format is specifically used by MongoDB for its document database. The idea behind it is to provide the utility of the JSON format, but also be able to use that format with the speed that comes with a binary format.

    JSON vs. BSON

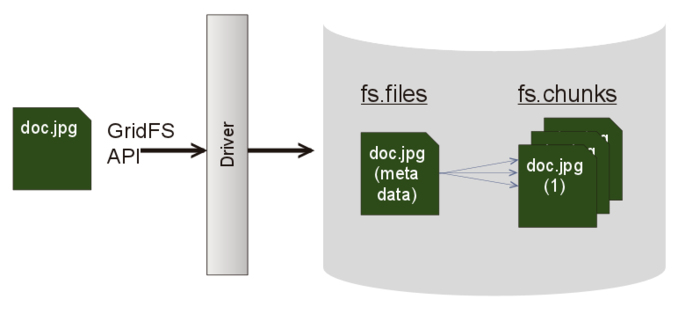
    While JSON simply represents a data structure, MongoDB can use BSON to build database indexes on keys at any level, thus helping improve speed in that area. MongoDB also provides a specification called GridFS that can be used in conjunction with BSON to store data over BSON’s 16MB document size limit. This can be useful to store large files, as it divides them into “chunks” to allow the storage to work properly in the database.
    BSON vs JSON
    For the  most part, JSON and BSON are very similar, but BSON is can provide an extra punch of speed as well. Both are certainly very handy ways of storing and retrieving data for applications.

  • It’s Time to Slay the Universal Installer Unicorn

    It’s Time to Slay the Universal Installer Unicorn

    While many people want a universal “easy button installer,” they also want it to work on their unique snowflake of infrastructures, tools, networks and operating systems. I call them snowflakes because their small differences expand combinatorially. That divergence turns the idea of a prescriptive reference architecture into a destructive myth that limits community and ecosystem growth.

    Because there is so much needful variation and change, it is better to give up on open source projects trying to own an installer and instead focus on making their required components more resilient and portable.

    Universal Installer Fallacy

    So what does an easy button install look like? Let me tell you about one that I built.

    Crowbar Mascot

    It was 2011, the dawn of the OpenStack Era, and our team at Dell was already battle-weary from trying to make repeatable installs around Azure, Eucalyptus, Joyent and Hadoop. The simple reality was there was no success pattern we could follow deploying any one of those platforms—and certainly none cross-platform. Even though all used basically the same compute and network infrastructure, each had custom deployment code and configuration approaches. We jumped on becoming an OpenStack founding partner as a way to try to break the failure pattern.

    What was failing? Each platform had deeply embedded environmental assumptions that were not repeatable or portable.

    For example, one of those platforms required thirty (30!) full racks of gear and tethering back to the master deployer because its management and topology was hardwired into its infrastructure. Others were not much better: Installation often was “ssh apt-get install platform,” then “scp pre-built configuration files.” Even worse, those steps were always proceeded with 30 pages of prescriptive manual system prep steps that were updated daily.

    Incorrectly, we believed that the solution was to create a better installer for OpenStack.

    The Crowbar project, which is still used by SUSE, created a fully integrated install sequence from PXE boot and discovery to testing the final OpenStack installation. We could build a cloud on a complete rack of gear from boxes in minutes. The open source project even used open tools such as Chef and hardware-agnostic options to increase its community appeal. As the first installer (it predated even DevStack), the project was widely used in early OpenStack evaluations.

    Despite that success, as a v1 technology, Crowbar’s major shortcoming was that it tightly coupled components and services together. That made the installation and management process very rigid and non-conforming to disparate operational models and environments.

    Our install scars showed us the real battle lines that prevented portability. Even minor infrastructure variations resulted in broken or site-specific configurations. A major part of the challenge is that variation is not neatly contained; instead, it is spread throughout the environment. We needed to create automation that could both cope with heterogeneity across the community and be change-tolerant after installation to enable upgrades.

    We came to accept that there is no single installer. Instead, scalable installers must assume that they will operate with other parts of the system in a coordinated way, because the diversity of options makes it impossible for them to control everything. In fact, we’ve seen that smaller, composable install steps are much easier to automate consistently. Even more importantly, smaller steps make it possible to manage systemwide upgrades in a controllable way.

    Asking for an “easy button” installer is the wrong question. Instead, let’s ask, “Can we create sharable components that can be automated in multiple ways?”

    There’s no universal installation script to create cloud rainbows; however, there are strategies we can use to make individual projects installable over a wide range of options. These approaches include composability, consistent configuration and use of standard tools and patterns for operation. These items help projects focus on their own concerns and allow operators to apply best practice techniques.

    Basically, the first step is for project developers to limit their scope and delegate operational concerns to operators.

    Even in a platform-as-a-service (PaaS) project that attempts to hide operational complexity from developers, such as Kubernetes, there remains someone who must operate that platform using foundational infrastructure and tooling. We make that job more complex when we get distracted trying to apply the new concepts to the old infrastructure. The addressing of an impedance mismatch pulls effort away from the central abstraction.

    Since we do need consistent installs from the community, projects do have a responsibility to help those efforts.

    How can they help? By ensuring that their component services are well-bounded with clear input configurations, operational requirements, upgrade patterns and output expectations.

    But really, that’s a future post. Please let me know what you think and where we should go from here.

  • Will MariaDB Soon Replace MySQL?

    Will MariaDB Soon Replace MySQL?

    MariaDB is a database growing in popularity. Its lead developer is Michael “Monty” Widenius, who was part of the team that created MySQL. When MySQL was acquired by Oracle, Widenius and some of the other original MySQL developers decided to launch MariaDB as a fork of MySQL and keep it as open source to mitigate any issues around Oracle’s ownership of MySQL.

    MySQL-vs-MariaDB

    In 2009, Sun Microsystems acquired MySQL. Sun’s subsequent acquisition by Oracle brought about a movement headed by Widenius to “save MySQL.” Widenius and many others in the open source community felt Oracle’s ownership might be a conflict of interest, since Oracle already had a competing closed source commercial database. They believed Oracle would be slow to further develop the MySQL database, given the potentially greater focus on the commercial Oracle database.

    In response to this, Widenius began working on MariaDB and helped form the MariaDB Foundation, which uses a community governance model. Because of the separation between the open source and commercial sides of the foundation, its governance generally is seen by the open source community as positive. This is in contrast to Oracle, which has both its commercial Oracle database and the open source MySQL both under the same governance. Often this is perceived as a conflict of interest, especially when it comes to keeping MySQL up to date.

    MariaDB vs. MySQL

    While MariaDB isn’t yet replacing MySQL, it has brought about good competition between the two, which can be good for innovation. With its backing of Oracle, MySQL may reign supreme for at least the near future; however, technically speaking, MariaDB could replace MySQL if a company decides it wants to make the switch.

    The developers designed it as a drop-in replacement of MySQL. Since it was forked from MySQL, basically all of the structures MariaDB uses are the same. This means switching from MySQL almost surely won’t require a company to alter its application in any way, since the data and data structures won’t need to be adjusted.

    In fact, the command-line tools such as mysqladmin, mysqldump, the daemon and others all keep their original names, so MariaDB is very much a drop-in replacement for database administrators as well. Indeed, many organizations have already either switched to it or simply began using it on its own: It replaced MySQL as the default database in Fedora and Red Hat. It is also used by Booking.com, CraigsList and Wikipedia, among others.

    What Else Does MariaDB Offer?

    Community improvements to MariaDB have been made by notable organizations such as Facebook, Twitter and Google. For example, Google contributed data-at-rest encryption to release 10.1.3, which is quite helpful given the security issues that can arise quickly in this ever-changing environment. In addition, it offers performance improvements such as subquery optimization and faster joins. It also has added row-based replication.

    While MariaDB may not replace MySQL immediately, it is worth watching: It is gaining traction as a potentially serious contender in the marketplace.

  • Development Tools Sprawl and the Impact of Open Source: The Herding Kittens Survey

    Development Tools Sprawl and the Impact of Open Source: The Herding Kittens Survey

    staging-devopsy.kinsta.cloud and Automic partnered up to conduct a survey back in February and March of several hundred respondents regarding their use of development tools, their use of Open Source and their rate of change. The survey report entitled: Managing Your DevOps Tool Chest, The Complexity of Herding Kittens is available from Automic here (fyi, registration is required to download the report).

    Scott Wilson of Automic and I already conducted a webinar where we took a deep dive on the findings of the survey. You can access the slides and recording of that webinar here (FYI, this is also behind a registration wall).

    If you take a moment to study the analysis you will see what I think are some interesting things in this survey. One is that we had two basic groups who answered. One was made up of our staging-devopsy.kinsta.cloud readers who tend to be DevOps adopters. The other was a more General IT group. There was some stark differences between the two groups. None was bigger than frequency of release and how often you would like to release code. Talk about polar opposites!

    Another interesting filter we applied was by size of organization. The biggest differences when comparing startup smaller organizations to large enterprises was the amount of tools and coding languages they used. Of course larger organizations used more than smaller ones. But the starker difference was in open source usage. Smaller organizations used a much greater percentage of open source tools than larger enterprises.

    Finally we also looked at geographical region and industry vertical to draw distinctions. You can read the report and listen to the webinar to to get all of the details on this and more. I highly recommend you download the report and take a look. Also if you can spare some time to listen to the webinar I think you will pick up some great insights.

  • Q&A: Sematext’s Thies on Docker Monitoring, Part 2

    Q&A: Sematext’s Thies on Docker Monitoring, Part 2

    In part one of my conversation with Stefan Thies, Sematext DevOps expert. we spoke about Docker’s use of Sematext Logsene logging, anomaly detecting and alerting software and SPM monitoring software. Let’s continue the conversation.

    David Geer: What makes Logsene centralized? Where is it centralized a typical deployment? What are the advantages of it being centralized?

    Thies: Traditionally, systems store logs from multiple applications on every server. This makes it difficult to search logs for troubleshooting or auditing purposes. To find a relevant log entry, operators must log in to each server, find the right file on this server and search in this file for a relevant message.

    This can easily take several minutes. With systems storing logs on multiple servers, it is difficult to correlate data, so minutes can turn into frustrating multi-hour root cause-hunting sessions, often involving multiple team members. Logsene provides a central full text index for all log data coming from multiple servers and applications. There is no need to log in to multiple servers and search/grep multiple log files. All team members see all data at the same time and can collaborate much more efficiently.

    Having a central place for search makes it much easier to find logs quickly, run analytic queries or centralize alert rules in a single place.

    Geer: What is it about what Logsene does for Docker logging?

    Thies: Sematext Agent for Docker interacts with the Docker API to automate the collection, parsing and processing of logs, metrics and events. It detects containers automatically (no setup or configuration for a new container!) and supports many log formats for applications on Docker Hub such as Nginx, Apache, Elasticsearch, Solr, MongoDB, MySQL and many more.

    Geer: What does your statement mean, “Some DevOps engineers even think of Logsene as ‘ELK Stack on steroids’”?

    Thies: The ELK Stack is a combination of open source tools: Elasticsearch, Logstash and Kibana. These tools are very popular for log shipping (Logstash), indexing and search (Elasticsearch) and visualization (Kibana dashboards). However, these tools are missing many enterprise features like multiuser user interface, role-based access controls, secure transport of logs or out-of-the-box configurations and an easy query language to search logs. This is where Sematext Logsene adds the relevant enterprise features to these open source tools to make them easy to use and securely integrated into the enterprise information technology infrastructure.

    Maintaining Elasticsearch clusters is another problem for many people. It requires a lot of expertise. Using Logsene does not require this sort of expertise. The Logsene SaaS provides a managed solution where users don’t need to know anything about maintaining Elasticsearch clusters or the required infrastructure. Sematext takes care of that for them. Sematext customers can benefit from these managed services and pay a fraction of the cost compared to self-hosted ELK stacks, where storage, computing and networking infrastructure and manpower for highly skilled workers counts.

    Geer: What is Tutum? What is so important about ease of launching SPM and Logsene Docker on Tutum?

    Thies: Docker acquired Tutum in 2015. Tutum provides management of Docker containers as a cloud service. Tutum is a platform made to operate “Dockerized” application stacks. In the case of Sematext Agent for Docker, the Tutum integration deploys Sematext Docker Agent automatically to all cluster nodes in a few seconds. These nodes could run on different cloud platforms such as Amazon, Digitalocean, Rackspace or on premises. Again, a big time-saver for people running larger infrastructures or hybrid clouds. Supporting Docker products and having excellent integration with Docker products is important for Sematext.

    The Sematext Docker Agent runs on all solutions offered by Docker e.g., Docker Swarm and others such as Google Kubernetes, Google Container Engine, RancherOS, CoreOS, Amazon ECS or Hashicorp Nomad.

    Geer: Please discuss the Sematext Docker and Docker image?

    Thies: Sematext Docker image is available on Docker Hub, and we shared the Tutum Stackfile for Sematext Docker on Stackfiles.io. The easiest way to get it is to use Sematext, which generates the stackfiles for you, including tokens.

    Docker Hub is the central registry for public application images including related installation instructions. Docker users can find out quickly how to run a “Dockerized” application with the help of the instructions in Docker Hub. Typically, this requires a little configuration work before a container can be started with the right settings.

    Stackfile.io is the place where people share preconfigured application stacks (e.g., a web service together with the required database). Sematext provides a preconfigured setup for Sematext Docker Agent to monitor all containers in Tutum Cloud. This means one can launch Sematext Docker Agent and monitor all containers running in Tutum Cloud with just a single click for the chosen stack file and by entering a unique identifier (Token) for the application. That is really all it takes.

    When you log in to Sematext SPM or Logsene the general installation instructions have all required configurations displayed. Sematext users can simply copy/paste the relevant commands including unique identifiers (tokens) for their application to get the Sematext Docker Agent deployed. This, too, is a big time-saver for our users and it gets them up and running in just a few minutes.

  • Q&A: Sematext’s Thies on Docker Monitoring, Part 1

    Q&A: Sematext’s Thies on Docker Monitoring, Part 1

    Stefan Thies is DevOps evangelist Sematext Group. I recently spoke with him about Docker’s use of Sematext Logsene logging, anomaly detecting and alerting software and SPM monitoring software. Read on for part one of our conversation.

    David Geer: Technically speaking, for the purposes of this article, what is logging?

    Thies: Logging means to store the output of programs (applications, servers) running on a computer. Typically, log messages that software applications produce are stored in log files. However, software running in Docker containers writes its log messages to a virtual terminal (console). The Docker Daemon (the server process managing the containers) has several facilities to forward log messages via log drivers or the Docker API to external applications, which are responsible for storing the log messages. This is not the traditional way of working with log data. This changes the log collection and storage mechanisms and forces many organizations to change their workflows for log management by introducing new tools.

    Typically, you would use a service called syslog to receive and store log messages on servers, but this requires special configuration for all Docker containers. While Docker made it easier to deploy applications, the new technology made logging and monitoring much harder as you could not use the traditional tools apart from integration with Docker.

    This is where companies like Sematext provide added value, by enabling:

    • Integration into the Docker Ecosystem
    • Cloud storage for log files
    • Indexing for full text search, analytics, visualization and alerting on log data

    Geer: What has Sematext Logsene contributed to logging, technically?

    Thies: Logsene Log Management includes all required workflows and security procedures to handle log data. Logsene provides role-based access controls for access to log data. Logs are collected and shipped to Logsene servers (running in the cloud or on premises) where the data gets stored and analyzed.

    Other important features are:

    • Full text search
    • Analytics
    • Alerts
    • Anomaly detection

    Geer: In what way is Logsene/Sematext available to users and organizations that seek solutions to capture logging for monitoring their Dockerized distributed applications?

    Thies: Logsene is available on premises and as SaaS in the cloud. It fits in hybrid environments as well such as running the Dockerized application in-house on bare metal while shipping logs to Logsene SaaS. In this case, only Sematext Agent for Docker runs on premises.

    Sematext Docker Agent automatically detects running Docker containers and automatically collects logs from the containers. The Sematext Docker Agent can transform unstructured log messages into structured data for analytics. We do this with integrated parsers and a pattern library, which detects log formats to structure logs. The final task of Sematext Docker Agent is to ship the structured logs from all containers securely to Logsene, where indexing for full text search and analytics queries takes place. The Logsene user interface provides all tools for search, visualization, anomaly detection and alerts on log data.

    Geer: What is SPM for Docker? What role does it play?

    Thies: Both Logsene and SPM collect data via the Sematext Docker Agent. SPM is a performance monitoring, anomaly detection and alerting solution for many server applications like Web servers (e.g., Apache, Nginx), databases (e.g., Cassandra, MongoDB, HBase, MySQL, etc.), big data engines (e.g., Spark, Storm, Hadoop, etc.) and full text search engines (e.g., Elasticsearch, Solr). Sematext Agent for Docker collects not only container logs but also performance metrics of all containers at the same time, plus Docker events.

    SPM for Docker provides operational insights into application performance on the Docker platform. It is not limited to performance monitoring—it integrates with Logsene for log management in a single user interface. DevOps teams can find log messages in correlation with potential performance bottlenecks. Most organizations use different tools for performance monitoring and logging. Sematext has recognized that metrics and logs must be available in a single platform to provide detailed operational insights without having to switch between different tools and without overhead for things like integration of multiple tools, multiple user interfaces, logins managing access permissions for multiple tools, and billing or licensing from multiple vendors such as NewRelic or Splunk.

    Watch this space for part two of my conversation with Stefan Thies of Sematext.

  • Top 10 IT Management Tools

    Top 10 IT Management Tools

    Staying up with the latest IT management tools is akin to keeping up on the latest Starbucks drink options. We simplify it here through a look at the most useful tools, from monitoring to DevOps orchestration and APM.

    IT management tools have entered a new heyday, thanks to the advent of cloud, DevOps and mobile computing. With all of the new types of infrastructure, software and development methods, developers and IT managers need simple automation to get through the day. But with hundreds of IT management and DevOps tools on the marketplace today, both open source and commercial, it’s hard to know where to start.

    The global DevOps tools market alone is expected to be worth $3 billion by 2019, according to Technavio. While there are many applications to choose from, we have compiled a list of our favorites below. Some of these are tried and true, while others are newfangled and still in their early days of experimentation.

    Microsoft System Center Operations Manager (SCOM)

    IT Operations Management and IT Service Management

    Microsoft SCOM is a legacy enterprise infrastructure monitoring and management tool that delivers comprehensive coverage for the Microsoft ecosystem of assets and devices, whether they are installed on internal data centers or in the cloud. SCOM has evolved over the years to monitor network and storage along with Unix-based systems.

    Cautions: Since SCOM is a deep monitoring tool that collects data from many different systems, it generates a large volume of data and alerts that can overwhelm systems administrators and IT managers.

    Vistara

    IT Operations Management and IT Service Management

    Vistara is a comprehensive tool for monitoring heterogeneous multivendor assets and devices, whether installed on-premise or in the cloud. It covers a wide swath of Microsoft and Unix applications and systems, major enterprise vendors such as Oracle and Symantec, and top storage and networking technologies. Vistara also integrates well with other monitoring tools. A unique feature of Vistara is that it records all user sessions, which provides an audit trail for tracing system changes and other events.

    Cautions:  Vistara is a powerful, multifunctional tool and needs to be set up properly to derive the maximum benefits.

    SolarWinds

    Network Monitoring

    SolarWinds is a leading tool for managing and monitoring performance of a multivendor distributed network environment. The tool delivers a lot of useful metrics, including performance, capacity and downtime. It is particularly useful in companies with many locations, such as a retail brand, or a national or multinational company with a large number of branch offices and locations.

    Cautions: SolarWinds does not provide comprehensive monitoring for servers or storage systems.

    (Editor’s Note: SolarWinds reached out to staging-devopsy.kinsta.cloud to clarify that it does offer comprehensive monitoring for servers and storage systems through its Server & Application Monitor and Storage Resource Monitor tools.)

    Nimsoft (CA)

    Network Monitoring

    Nimsoft is another excellent network monitoring tool, but is best-suited for an on-premise (internal data center) environment that has standardized on a few types of equipment and has a low rate of change. A company that is adding new technologies and devices frequently won’t find the tool to be flexible enough to adapt to evolving needs.

    Cautions: This legacy tool is not ideal for diverse and fast-changing IT environments.

    ServiceNow

    IT Service Management

    ServiceNow is well-known in the industry for comprehensive service management, including service level management, financial management, incident management, availability management, change and release management and more. ServiceNow has the broadest coverage for all ITIL activities, making it the de facto standard for service management and suitable for use in small companies up to the enterprise.

    Cautions: Because this tool is so flexible, you can easily customize it to meet your organization’s specific needs. Beware that by doing so, you’ll need a full-time administrator to manage the customized system.

    Chef/Puppet

    DevOps Automation and Management

    When it comes to tools for managing cloud application development and deployment, Chef and Puppet have near-cult status among developers. Companies occasionally use them both, but there is overlap between the tools. Chef is ideal for DevOps provisioning, orchestration and configuration management and is a more flexible platform overall, featuring auto rollback to previous versions. Chef also provides real-time visibility into metrics and messages. Puppet is best for DevOps automation and administration and is a highly prescriptive, process-driven platform that does not allow shortcuts, which should make IT Operations people happy.

    Cautions: Chef and Puppet are used primarily by developers, not IT Ops, and therefore raise some level of caution if developers are spending too much time managing the tools vs. writing code.

    Docker

    DevOps/Containerization

    Docker is the industry-leading tool for DevOps automation of application deployment inside software containers. It can be used for nearly any software project and infrastructure environment, and is especially helpful for managing dependencies and version inconsistencies. The application is a game-changer for simplifying the complexities of deployment. Docker containers wrap up a piece of software in a single, portable unit that contains everything it needs to run: code, runtime, system tools, system libraries and so on.

    Cautions: Docker’s approach to security is still unproven, and some believe it is not up to enterprise security standards.

    Apache Mesos/Google Kubernetes

    DevOps/Clustering

    Apache Mesos is best for cluster management and utilization for distributed applications in a DevOps world, while Google Kubernetes is ideal for automating deployment, scaling, and operations of application containers across clusters of hosts. Clustering tools sit on top of hardware and increase utilization through effective workload management and resource-sharing. They work in both public and private cloud infrastructure environments, across many different platforms, and allow IT organizations to run more workloads on the same hardware. While both of these tools are fairly new, Mesos has been around longer and is more appropriate for large environments with heavy management and scale needs.

    Cautions: When looking at small clusters of say, fewer than a dozen nodes, Mesos may be an overly complex solution.

    New Relic

    Application Monitoring

    New Relic is well-known for its real-time capabilities in monitoring and managing web and mobile applications within cloud, hybrid and on-premise infrastructure. For an APM tool, New Relic is strong at identifying server-based performance issues. It also allows for real user page performance tracking so you can see if certain classes of users (for instance, by region) are having worse performance than others.

    Cautions: New Relic does not capture 100 percent of transactions, but does a sampling. This may or may not be important depending upon your business needs. It is also somewhat rigid, and may not be too flexible in an environment that has a lot of microservices.

    Graphite/Grafana

    Dashboards

    Graphite and Grafana are two leading graph and dashboard builder for visualizing time series metrics. The tools are particularly useful for analyzing metrics and other types of data from on-premise systems, public cloud, private cloud and IoT systems.

    Grafana is most commonly used for visualizing time series data for Internet infrastructure and application analytics but is also used in domains including industrial sensors, home automation, weather and process control.

    Graphite is excellent at visualizing data and metrics.

    Cautions: You will need a complex and elaborate configuration of databases to gather the data and a compute engine to generate the dashboard.

    About the Author/Ravikumar Raghavenderrao

    ravikumar-raghavenderraoRavi RRK, as he is known, is the Vice President – Service Delivery at NetEnrich. Ravi’s responsibilities include service delivery management, customer satisfaction, and new service introduction. Ravi’s team also has the responsibility to ensure and enforce quality and policy standards across the NetEnrich organization.

    Ravi has over two decades of experience in the IT industry in the areas of remote infrastructure management, delivery and large account management. Prior to joining NetEnrich, Ravi spent over 20 years at Wipro Technologies in various positions. Ravi holds a Bachelor of Engineering (Mechanical) degree from Osmania University and a Master of Engineering (Mechanical) degree from the Indian Institute of Science.