Category: DevOps Toolbox

  • Datadog Adds Support for Microsoft Azure DevOps

    Datadog Adds Support for Microsoft Azure DevOps

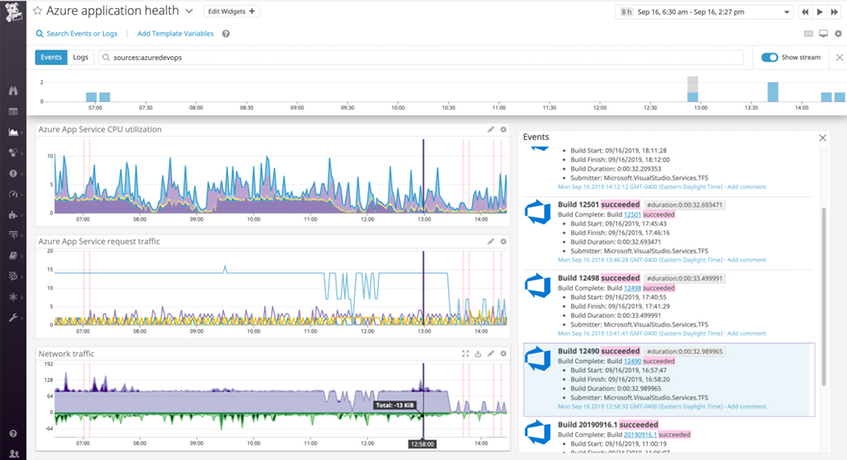
    Datadog has added support for Microsoft Azure DevOps to its namesake monitoring and analytics platform.

    Ilan Rabinovitch, vice president of product and community for Datadog, said Microsoft Azure DevOps, formally known as Visual Studio Team Services, is gaining traction as a continuous integration/continuous delivery (CI/CD) platform that can be deployed on-premises or in the cloud.

    Via this integration DevOps teams that have adopted Microsoft Azure DevOps can now pull in events to create metrics from their continuous integration pipelines, and then correlate that information in real-time against Datadog is pulling from their entire stack in Datadog. DevOps teams can also configure to monitor gates in their Azure DevOps deployment pipelines, enabling them to detect and abandon bad releases automatically, said Rabinovitch.

    Finally, DevOps teams can also employ Datadog to measure the efficiency of their processes by tracking, for example, how often builds are completing or failing or the frequency of code commits, added Rabinovitch.

    Datadog Microsoft

    Microsoft has been pouring significant resources into building out Microsoft Azure DevOps over the course of the last year. At the recent Microsoft Ignite 2019 conference, the company released Azure DevOps Server update 1.1 release candidate to address some bug issues before organizations deployed the platform in production environments. Microsoft also has added previews of auditing tools, extended reporting capabilities, enhanced the user interface for the repositories page to be more mobile device friendly and added more billing options.

    Microsoft Azure DevOps in time will play a much larger role in the company’s bifurcated approach to hybrid cloud computing. On the one hand, the company is driving an increasingly larger portfolio of Azure public cloud services. In on-premises IT environments there is a massive base of Windows servers coupled with a nascent Azure Stack platform that provides organizations with the option to deploy the same IT environment Microsoft employs on its public cloud. The long-term goal is to make it easier for organizations to build and deploy applications across hybrid cloud computing environments using the same DevOps pipeline.

    Of course, Microsoft Azure DevOps is not the only CI/CD platform that might be employed to achieve that goal. As rival CI/CD platforms continue to extend their reach into Azure and Windows environments, Microsoft will find itself competing with a small army of rival DevOps platforms that span not only Azure, Windows and Linux platforms but also rival cloud platforms such as Amazon Web Services (AWS) and Google Cloud Platform (GCP).

    In the meantime, IT organizations should expect to see a host of third-party tools becoming available for Microsoft Azure DevOps as the CI/CD platform gains traction. In some cases, organizations will standardize on Microsoft Azure DevOps. In other cases, Microsoft Azure DevOps will become one of several CI/CD platforms that different teams within an organization are employing. Regardless of the CI/CD platform adopted, however, organizations that do wind up employing multiple CI/CD platforms are likely to want to consolidate as many as the monitoring tools they rely on as possible.

    — Mike Vizard

  • Best of 2019: The Time Has Come for an Engineering Approach to DevOps

    Best of 2019: The Time Has Come for an Engineering Approach to DevOps

    As we close out 2019, we at staging-devopsy.kinsta.cloud wanted to highlight the five most popular articles of the year. Following is the third in our weeklong series of the Best of 2019.

    Do you want to know how to do DevOps? Are you doing DevOps but not satisfied with the results you are getting? DevOps is complex. It does not come with a prescription, installation guide, user’s manual or maintenance manual. It doesn’t even have a standard definition. How can anyone expect to get good results with DevOps without clear and definitive guidance? There are plenty of books that describe different aspects of DevOps and customer user stories, but up until now there has not been a book that frames DevOps as an engineering problem with a step-by-step engineering solution and a clear list of recommended engineering practices to guide implementers.

    My book, Engineering DevOps: From Chaos to Continuous Improvement … and Beyond, provides a step-by-step engineering prescription that can be followed by leaders and practitioners to understand, assess, define, implement, operationalize and evolve DevOps for their organization. It provides a unique collection of engineering practices and solutions for DevOps. By confining the scope of the content of the book to the level of engineering practices, the content is applicable to the widest possible range of implementations.

    This book was born out of my desire to help others to do DevOps, combined with a burning personal frustration. The frustration comes from hearing leaders and practitioners say, “We think we are doing DevOps, but we are not getting the business results we had expected.”

    There are many documented references, courses and other sources of information that explain a multitude of different aspects of DevOps, but there is not a comprehensive step-by-step prescriptive guide that details how to engineer a DevOps solution for any organization given any starting point.

    Engineering DevOps takes a strategic approach, applies engineering implementation discipline and focuses operational expertise to define and accomplish specific goals for each leg of your DevOps journey. This book guides the reader through a journey from defining an engineering strategy for DevOps to implementing The Three Ways of DevOps maturity using engineering practices: The First Way (called “Continuous Flow”) to The Second Way (called “Continuous Feedback”) and finally The Third Way (called “Continuous Improvement”). This book is deliberately intended to be a guide that will continue to be relevant over time as your specific DevOps, and DevOps more generally, evolves.

    Structure of this book

    This book is organized as an engineering reference guide presented in five parts as follows:

    Part I: What Is Engineering DevOps and Why Is It Important? is organized into three chapters. Chapter one, “What is Engineering DevOps?,” explains engineering concepts and terms used in this book that have proven to work with many clients I have encountered during my consulting experiences. My depiction of a DevOps Engineering Blueprint is presented for as a useful, practical “big-picture” reference for discussing engineering the major parts of DevOps. Chapter two, “Nine Pillars of DevOps,” describes a classification of DevOps practices that I have found to be useful characterization of DevOps engineering practices readily applied when engineering DevOps implementations. Chapter three, “Why Is Engineering DevOps Important?,” explains the benefits of taking an engineering approach to engineering DevOps.

    Part II: Engineering People, Processes and Technologies for DevOps provides a comprehensive explanation of recommended engineering practices for the higher levels of the DevOps Engineering Blueprint. DevOps transformations are not normally understood or applied using strict engineering principles. Engineering practices are presented in nine chapters. “How Should DevOps Be Engineered?” includes a discussion of DevOps Engineering Maturity Levels for each of the Three Dimensions (People, Process, and Technology), Twenty-Seven DevOps Engineering Critical Success Factors and Lean DevOps Value-Stream Pipeline Engineering.

    I describe recommended engineering practices for the top layers of the DevOps Engineering Blueprint in the next chapters, which include “Value-Stream Management (VSM),” “Application Release Automation (ARA),” “Version Management,” “Continuous Security (a.k.a. DevSecOps),” “Service Catalog,” “Governance,” “Site Reliability Engineering (SRE),” “Disaster Mitigation” and “Recovery.”

    Part III: Engineering Applications, Pipelines, and Infrastructures Engineered for DevOps provides a comprehensive explanation of recommended engineering practices for the lower levels of the DevOps Engineering Blueprint, presented in six chapters as follows: “DevOps Applications Engineering,” “CI/CD Pipelines Engineering,” “Elastic Infrastructure Engineering,” “Continuous Test Engineering,” “Continuous Monitoring Engineering” and “Continuous Delivery and Deployment Engineering.”

    Part IV: DevOps Seven-Step Transformation Engineering Blueprint provides a description and tools for my approach to realize and evolve DevOps. The seven steps are Visioning, Alignment, Assessment, Solution Engineering, Realization, Operationalize and Expansion. By using these tools, DevOps leaders and practitioners can create, implement, operate and expand their DevOps across the organization. The chapter goes further to explain how to evolve DevOps from a successful First Way DevOps (Continuous Flow) toward realizing more advanced Second Way (Continuous Feedback) and Third Way (Continuous Improvement) DevOps implementations. This part includes a discussion of “Beyond Continuous Improvement”—a look at emerging technologies shaping DevOps in the future, and how you can prepare your DevOps and yourself for the future. This part includes a discussion of how to set up an effective DevOps engineering training program that supports continuous learning of DevOps engineering skills needed to maintain and enhance DevOps.

    Part V: Appendices, Continuous Learning, and References includes materials and sources I have found most useful for engineering DevOps.

    To get a copy of my book “Engineering DevOps: From Chaos to Continuous Improvement … and Beyond,” or start reading for free, click here.

    — Marc Hornbeek

  • Xen Project Advances Hypervisor Project

    Xen Project Advances Hypervisor Project

    The Xen Project announced this week that the latest version of the open source hypervisor can now take advantage of core scheduling, an experimental technology that enables Xen to group multiple processors together to create a single virtual central processor unit (CPU).

    Lars Kurth, chairperson for the Xen Project advisory board, said this capability also represents an important first step toward developing a more secure form of hyperthreading. Since earlier this year, many IT organizations have turned off hyperthreading because of cybersecurity concerns. However, such decisions have resulted in significant performance penalties for many applications.

    In addition to adding support for core scheduling, version 4.13 of Xen Project Hypervisor adds support for live patching and late uCode loading that makes it possible to install updates at runtime without having to reboot the hypervisor.
    The latest version of Xen also adds support for additional processors, including AMD 2nd Generation EPYC, Hygon Dhyana 18h, Raspberry Pi4 and Intel AVX512-based platforms.

    Finally, version 4.13 of Xen adds support for OP-TEE, which enables all guests to concurrently run trusted Applications on TrustZone, firmware created by ARM to isolate processors on the same system, and improvements to Dom0less, which makes it possible to partition processors running in parallel.

    The Xen Project Group also announced it has created a Functional Safety Working Group, which is committed to making the Xen hypervisor compatible with ASIL-B requirements, a set of compliance requirements defined by the automotive industry. That effort represents a significant challenge because it requires code and development processes to comply with key tenets of ISO 26262, a set of standards for embedding electronics into any road vehicle.

    The Xen Group is also working on developing a secret-free hypervisor, which Kurth said will play a critical role in thwarting side-channel cybersecurity attacks. Cybercriminals can employ side-channel attacks to break encryption algorithms by measuring and analyzing the physical attributes such as the amount of radiation being generated by a processor.

    Kurth said version 4.13 represents a major milestone in the ongoing development of Xen. In the future, Xen will also be able to take advantage of the Rust-vmm project being led by Intel that will make it possible for a processor to run multiple types of hypervisors in a modular fashion.  In addition to providing a more agile way of isolating virtual machines, Rust-vmm will reduce the amount of time required to spin up a virtual machine. Specifically, Intel is trying to make it easier for a processor to be able to run different classes of hypervisors that are optimized for legacy monolithic applications and cloud-native applications based on containers that require a much lighter-weight hypervisor.

    It’s not clear to what degree advances in technologies such as core scheduling will influence the selection of hypervisors and virtual machines. However, from a DevOps perspective, it’s clear core capabilities being added to the next generation of hypervisors will not only improve application performance, but they should also significantly advance best DevSecOps practices.

    — Mike Vizard

  • IBM Z Open Editor Support for Language Server Protocol is a Game Changer

    IBM Z Open Editor Support for Language Server Protocol is a Game Changer

    The integrated development environment (IDE) is an indispensable tool for software developers. Before it came along, coding was a laborious, detail ladened undertaking. We’ve become accustomed to the syntax checking and code completion features than even the most basic IDEs provide. These days we tend to forget how hard it was programming with nothing but a rudimentary text editor. Something as simple as finding a missing comma or a misplaced curly bracket that was causing a compilation error could take hours, maybe days should the codebase be big enough. When it came to tracing your way through a seemingly endless chain of functions and classes in order to find the culprit of a runtime error, well…fuggedaboutit! Without the modern IDE, we’d be sunk.

    Well, that was then and this is now. A few years back, a new technology emerged on the technical landscape that’s boosting the power of the IDE, and subsequently the scope of work a developer does and the decisions he or she makes by an order of magnitude. This new technology is Language Server Protocol (LSP).

    LSP Takes the IDE to a Whole New Level

    LSP is a specification developed by Microsoft that standardizes the way certain typical features are implemented within a programming IDE. LSP attempts to consolidate the implementation of IDE commonplace features such as code completion, hover-over tips, jump-to-definition, find-references and syntax checking into a standard format that can be applied to any IDE in an agnostic manner.

    LSP is a technology designed to address the following problem. Imagine that a tools vendor has an idea for implementing a new plugin that will automatically do code completion for programs written in the COBOL programming language. Such a feature might be useful to any number of COBOL programmers. However, not every COBOL programmer is programming using the same tool. Some might be using an IDE such as IBM Developer for z/OS. Another might be using a text editor such as Sublime Text, Atom or even something more basic such as vim. In earlier times, in order to get the feature to market the vendor needed to implement different versions of the plugin in a way that was special to the given development environment. There’d be a team working on a Sublime Text version of the plugin, another team working on the vim plugin so forth and so on. Not only did the tool developer need to accommodate different operating systems, but each team might come up with its own, particular way to implement the feature. As team members left the company and new members arrived to replace them, those new developers needed to learn each particular way the feature was realized. As you can see, not only did the variety breed complexity, but things got very expensive very quickly.

    LSP does away with the need for such specialized tools development. LSP provides a standard protocol that can be implemented in any tool. The protocol defines a set of standard methods, objects and communication methods that provide a common set of services in any IDE.

    Thus, the only work that needs to be done to get the previously described COBOL code complete feature to market is to express it in a way that is compatible with the LSP. The actual work of realizing the feature then involves writing a client that supports the standard. It’s a “one ring to rule them all” process so to speak.

    The LSP specification was originally published by Microsoft specific. But the standard has been embraced as an industry-wide. There are implementations in Java, C++, C#, Python, Scala, Swift and PHP, to name a few. Also, there is an implementation of LSP for COBOL under z/OS, which brings us to IBM Z Open Editor.

    Bringing the Use of LSP to the Mainframe

    IBM Z Open Editor is a free Visual Studio Code extension that provides a state of the art programming experience for COBOL and PL/1 developers. Also, IBM Z Open Editor integrates with Eclipse Che and Eclipse Theia. Integration with Eclipse Che and Theia is particularly interesting because it enables browser-based editing. It’s a powerful tool, even more so given that historically COBOL and PL/1 programmers have lived in the backwaters of modern IDE development. IBM Z Open Editor makes IDE-based software development a general programming experience. Developers can use the same tool to program COBOL as they do in Java or even HTML for that matter.

    LSP Enabled Features in IBM Z Open Editor

    The following is a list of tool features available to mainframe programmers using Visual Studio Code with IBM Z Open Editor enabled:

    • Code completion.
    • Hover over instructions and snippets.
    • Jump to definitions.
    • Workspace symbols.
    • Find references.
    • Diagnostics and syntax error detection.
    • Outline view.
    • Previewing of included copybooks on hover.
    • Navigate to copybooks.
    • Code template snippets.
    • Refactoring such as “rename symbol.”
    • Variable completion.

     Using a single IDE to program in a variety of languages is a trend that’s been evolving for a while. However, adding LSP into the mix allows any IDE to present a consistent set of design time features. For example, one IDE is now able to do code-completion, hover-over reporting and variable tracing regardless of the programming language in play.

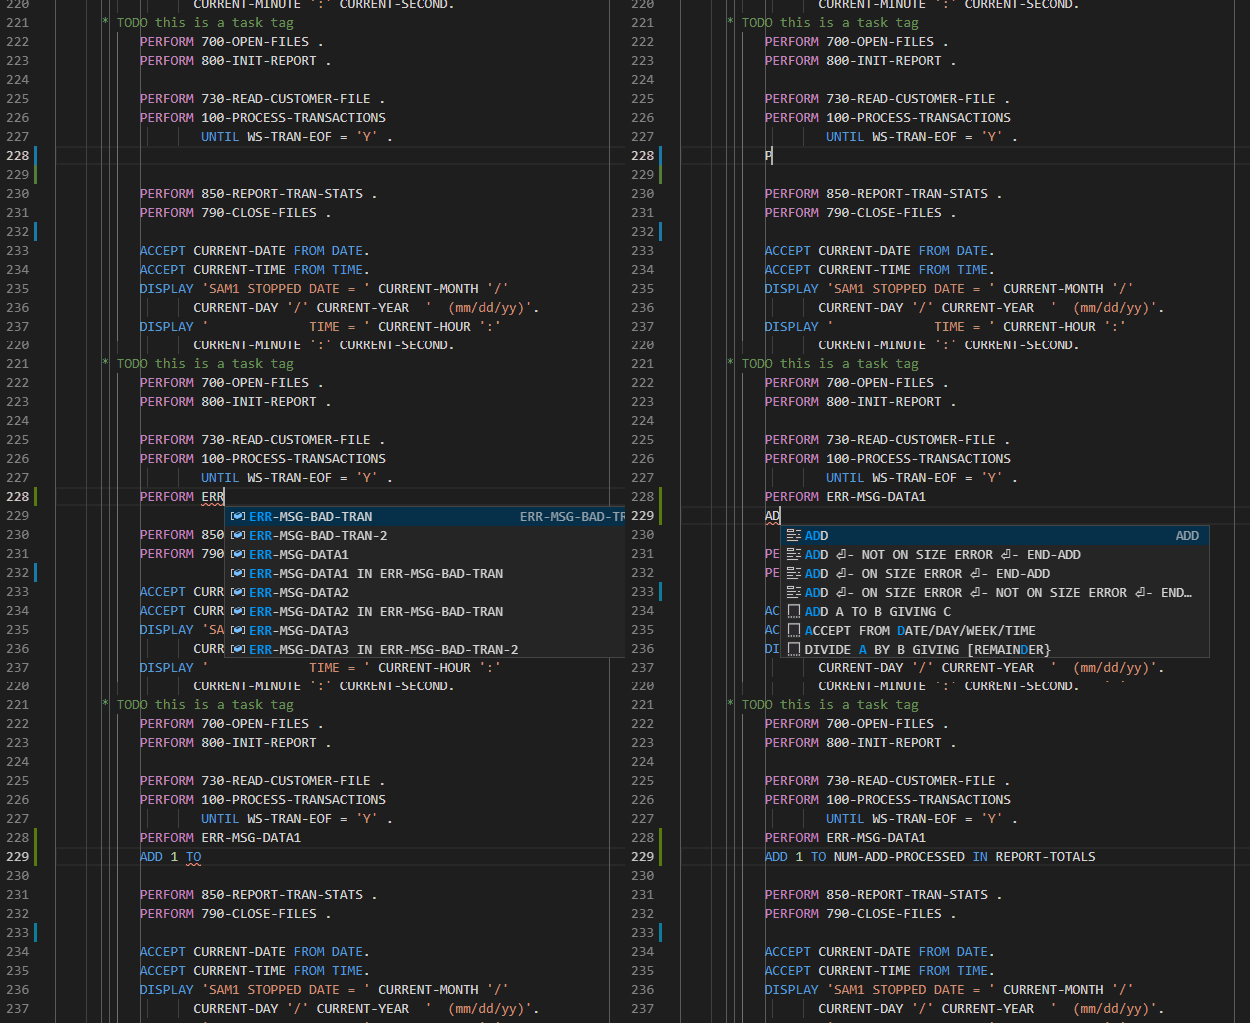
    For example, Figure 1 below shows the COBOL code completion feature of IBM Z Open Editor plugin for Visual Studio Code. IBM Z Open Editor uses LSP to facilitate code completion.

    Figure 1: IBM Z Open Editor uses the Language Server Protocol to facilitate context-sensitive code completion.

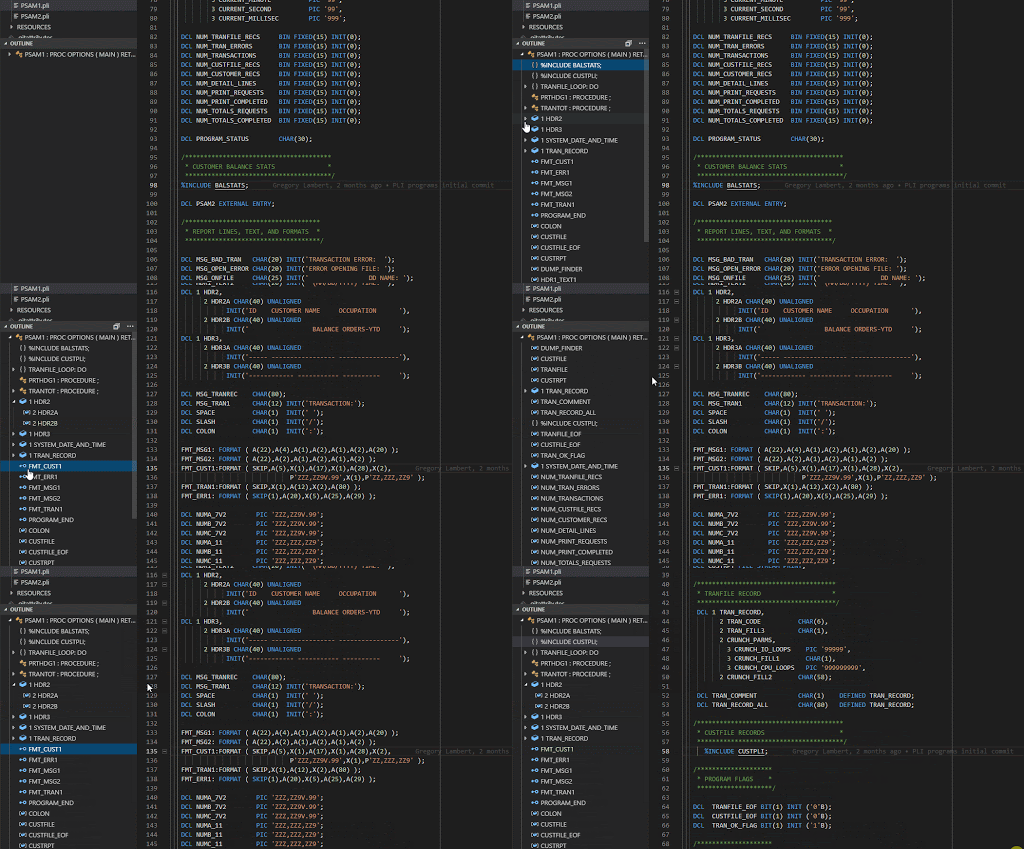
    Figure 2 shows the search and sort features of IBM Z Open Editor, which again implemented according to the LSP.

    Figure 2: Using LSP to implement IBM Z Open Editor’s sortable and searchable outline view for navigation.

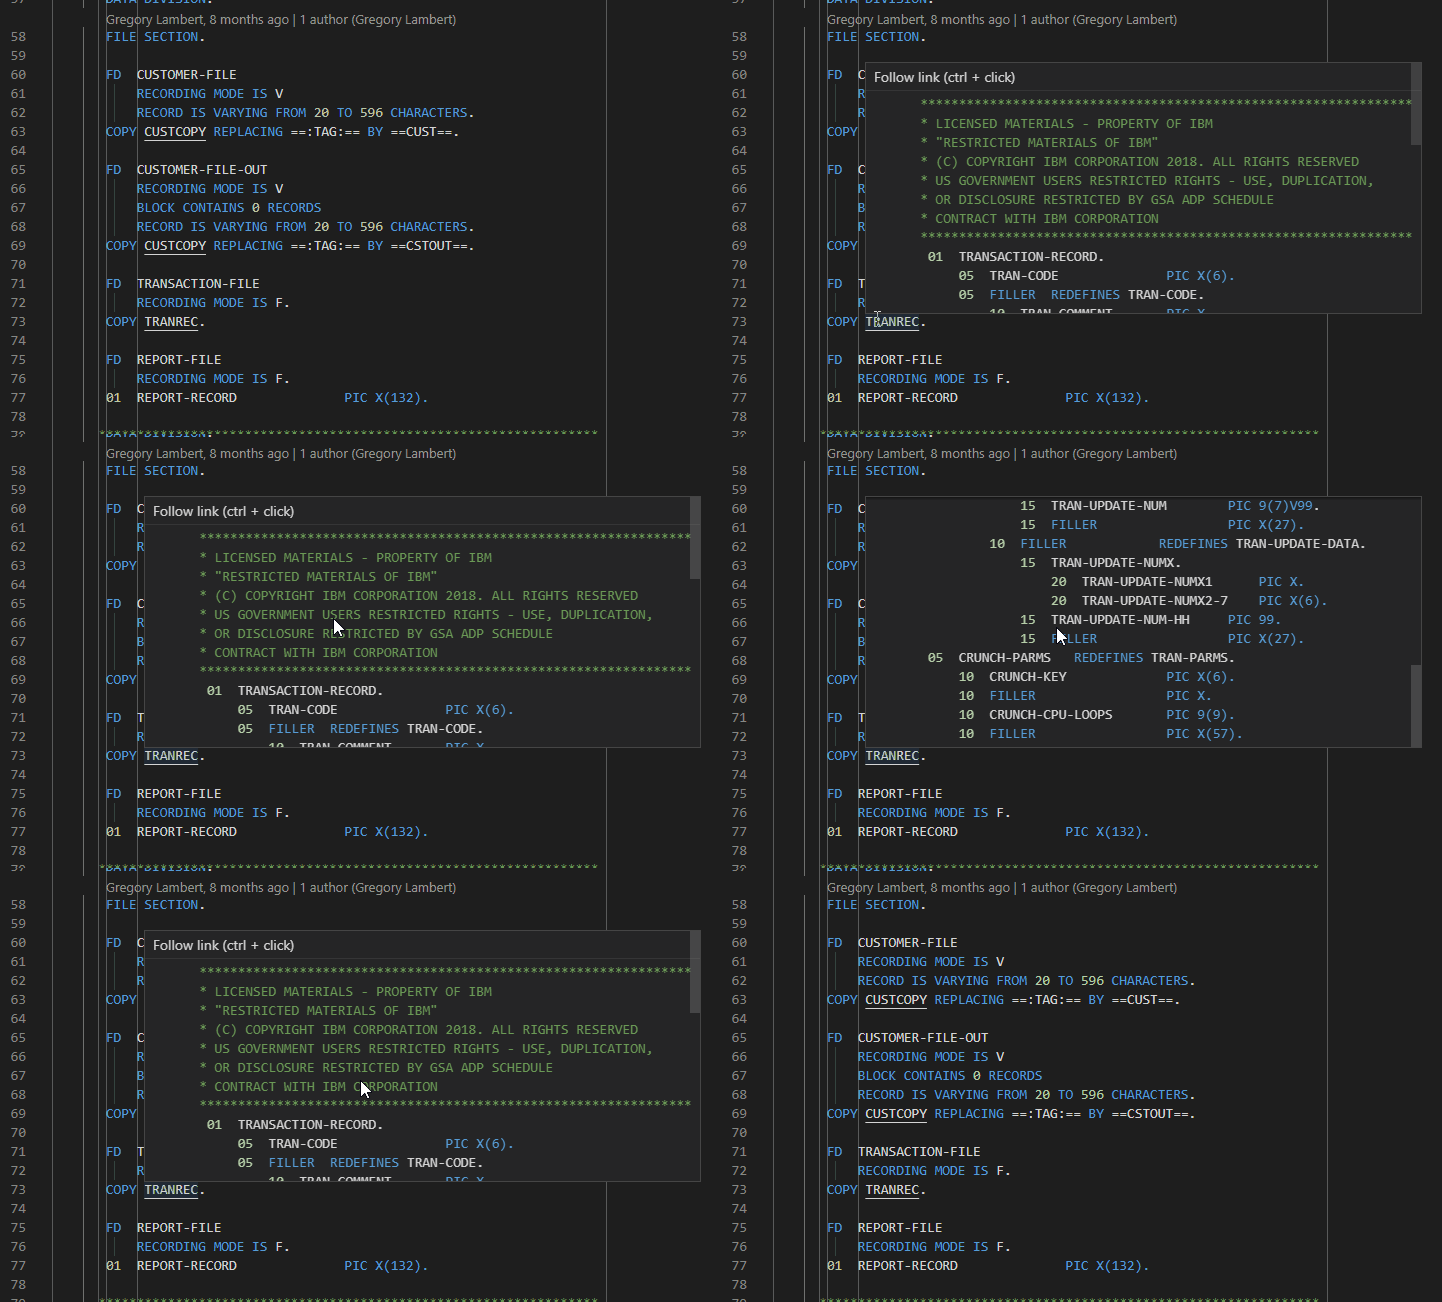
    Finally, Figure 3 shows how the IBM Z Open Editor takes advantage of the extensibility capabilities of LSP to implement a feature that resolves and loads copybooks for preview. A copybook is code that can be copied from a master source and inserted into several different programs or into a variety of places in a single program. A copybook is used to define the physical layout of program data, variables for example, as well as instances of procedural code.

    Figure 3: IBM Z Open Editor extends LSP to review and load a copybook within Visual Studio Code.

    Clearly, LSP brings a lot of power to the mainframe programming experience. Now tools developers can create a unified programming experience using a common methodology. But where things really get interesting is when LSP is used to report data that goes beyond standard programming and code management activities, to a place where the real-time behavior of those using deployed code is being reported. In other words, LSP makes it possible not only to get information about code that is local to the developer’s desktop but also about the code as it is being used at runtime out on the internet.

    Beyond the Mainframe: The Long Term Significance of LSP

    LSP is extensible by design. As you read above, IBM Z Open Editor extends LSP to allow programmers to preview and load copybooks. This is done by extending the protocol.

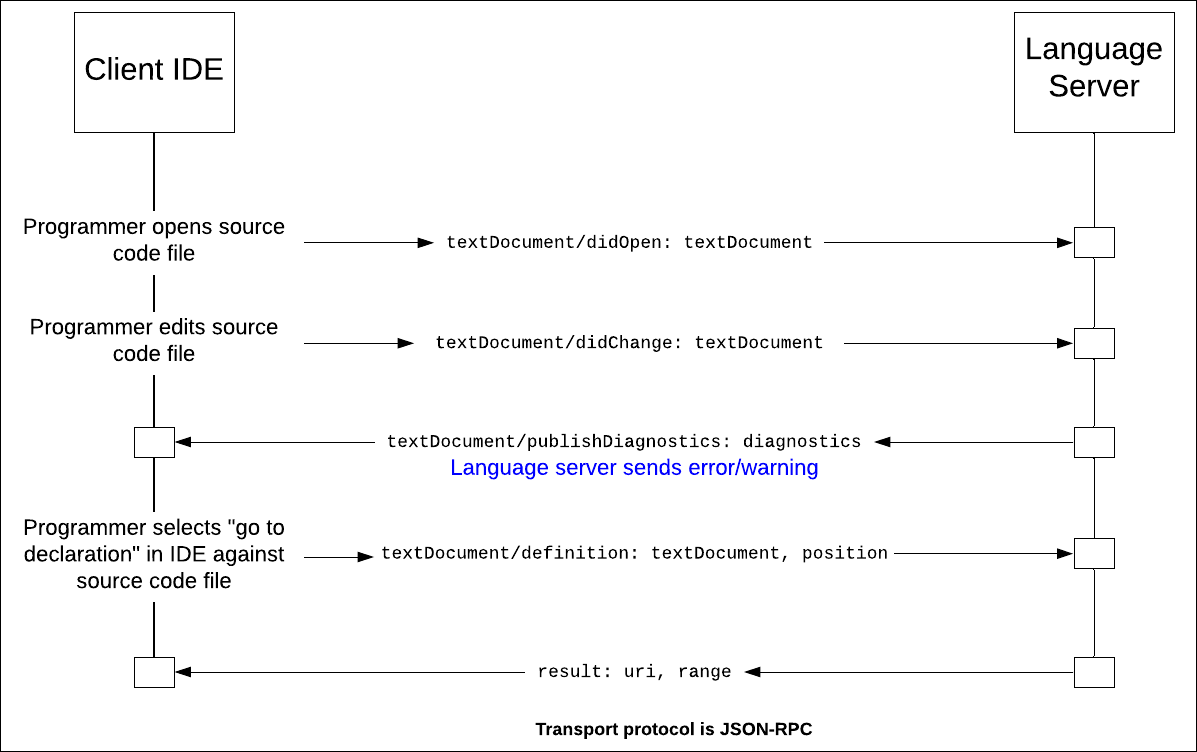
    The typical IDE to server interaction under LSP is that the LSP client reports to the LSP server when a code document has been opened, changed, saved and closed. Then, once the LSP server is aware that a code document is in play, the server can inspect the document and report back events that are relevant to the programming language (Figure 4).

    Figure 4: LSP uses a predefined set of commands and request/response objects to support programming IDE is a language and operating system agnostic manner.

    For example, the LSP server can inspect the document to make sure the code is syntactically correct. If an error is encountered the server reports back the starting and ending location of the error, along with a message. In the case of the copybook review feature, the client reports back the location of the cursor in the code window and the server determines an opportunity for a copybook review and informs the client accordingly.

    While the copybook preview feature is powerful, it’s confined in scope to the immediate document. This is good. But, imagine what it would be like if the server had knowledge of all instances of the code deployed and running on computers connected to the internet?

    Suppose for example, that your code was powering an API running on the internet and you had the ability to learn about the number of calls to a particular function backing the API or better yet, imagine that you had the ability to learn about function calls that encountered particular problems, such as a pattern of mistyped parameters or high latency calls. Then imagine if that global runtime behavior was reported right in the IDE? Such information would change the very nature of how a programmer approaches his or her work. More importantly, it would change the way an enterprise manages programmers.

    What if a programmer could decide what to work on based on global runtime behavior reported into the IDE via an LSP extension? For example, going back to the imagined pattern of mistyped parameters, let’s say that when a developer hovers over the related function in IDE a warning icon appeared informing the developer of 1000 instances of mistyped called were made at the global level. The developer decides that such an error rate is unacceptable. Then, he/she examines the developer documentation and discovers that the parameter type definitions for the function are poorly described and that the document needs to be corrected. The developer then makes updating that developer documentation a critical path, part of the day’s work that needs to be delivered immediately.

    Given the power that LSP brings to the programming experience, such a scenario is entirely possible. In fact, there are companies out there such as Apollo Graph Manager that presently allow developers and third parties to register their production APIs in order to collect the sort of global information described above and have it reported in an IDE via LSP. As those of us who have been in the software business for a while have come to learn, once a feature such as global reporting catches on, it’s only a matter of time until it becomes an industry-wide practice. It’s only a matter of time before globally collected runtime metrics delivered to a programmers LSP become commonplace.

    Again, the ramifications are significant. Once a programmer has the ability to make fundamental decisions about feature development and deployment schedules, what then becomes the role of the project manager and the product manager?

    To take the issue one step further, how much power should a programmer be given? And in terms of general business practices, how much should the programmer know about a company’s products? These questions might seem fantastic, but keep in mind at one time companies guarded their source code as a trade secret. Today, more code than not is shared between companies as part of the open-source movement. As a result, the way code is made and a developers work has changed. The same possibility exists due to the growing trend to extend the capabilities of the LSP. The ramifications of LSP go well beyond simply reporting syntax errors and doing code completion. LSP will change the way the entire industry works, from mainframe programming to developers working in the cloud or on commodity hardware.

    Putting it All Together

    Given current trends, there’s little doubt that LSP will make even the most rudimentary code editor a powerhouse tool for software development. Standardizing IDE features into a common format allows new features for any development tool to be implemented faster and at a reduced cost. In no time at all we might even figure out a way to use LSP to make is so large bodies of code can be written automatically with just a few guiding keystrokes from the developer’s keyboard no matter the programming language. It’s a real possibility.

    Not only will LSP making coding easier and faster, but it’s also going to change the role of the software developer. Once all the code running on the internet becomes LSP aware and accessible, developers will get runtime information about how their code is performing at runtime on a global level. The trend is already in play. As history has shown, the further down a technology goes into a given population, the more powerful that population becomes and the greater the ramifications when the power is exerted. There’s a very real possibility the information that LSP enabled IDEs provides will make the day-to-day programmer more prominent in the product decision-making processes that are presently the responsibilities of program and project managers. Once that shift takes place we’re likely to see another industry-wide transformation take place in the way software is made and delivered. History has shown that such transformations have long term benefit, but in the short term are disruptive and disturbing. We’ll do well to be prepared.

    — Bob Reselman

  • Waging a Winning WAR in AWS

    Waging a Winning WAR in AWS

    Above all other security advice for enterprises working with Amazon Web Services (AWS), there is one resounding war cry: “Go to WAR.” WAR is an acronym meaning Well-Architected Review. It’s a powerful and proactive way to mitigate real risk with the AWS team and its partners. If you’re using AWS (or thinking about it) consider adding WAR to your security arsenal. It’s a well-kept secret starting to proliferate in the cloud industry for reasons you will find obvious after reading this article.

    AWS Promotes a Shared Responsibility Model

    When it comes to cloud environments, a common term that is often heard and used across all cloud service providers (CSPs) is “shared responsibility model.” This model most often dictates terms of Master Service Agreement with any potential CSP, be it a Software as a Service (SaaS), Platform as a Service (PaaS) or Infrastructure as a Service (IaaS) model. The goal is to clearly identify and establish the security responsibilities that are shared between a CSP and cloud consumer. 

    As security experts, Wallarm advocates for the shared responsibility model. It is impossible for a cloud provider to provide 100% security for you, like in securing your customer’s data and access (you can see this in the AWS shared security model below). There are also enormous benefits to application and API security to having both the CSP and cloud consumer putting up a strong defense. All customers on AWS and other cloud infrastructures should be proactive agents in their cloud security. (See Securing Apps on AWS with Wallarm.)

    This visual image depicts how shared responsibility is distributed:

    It Starts with Well-Architected Frameworks for AWS Cloud Architects

    AWS Developed the Well-Architected Framework to help cloud architects build secure, high-performing, resilient and efficient infrastructure for their applications. Based on five pillars—operational excellence, security, reliability, performance efficiency and cost optimization—the framework provides a consistent approach for customers and partners to evaluate architectures and implement designs that will scale over time. 

    AWS’s Well-Architected Framework approach is built on the shared responsibility model that helps consumers and providers truly understand their portion of responsibilities, as outlined in the figure below.

    The framework was intended to be far more than an architected tool for AWS. It was designed as a sort of way of life and method of looking at your architecture to ensure resilient and consistent outcomes. 

    The Well-Architected Framework is a living set of best practices that AWS continuously updates. Every time you think about starting something new or changing something, use the five pillars to evaluate what you are proposing. This is where WAR comes in.

    Approaching the WAR of Cloud Security

    The WAR is a systematic approach to review your architecture—whether already in AWS, on-prem or even in other cloud providers. WAR is currently a set of 46 questions, which could shift in number since this is a living methodology. It is  aligned to the five pillars mentioned:

    • Security. 
    • Reliability.
    • Performance efficiency. 
    • Cost optimization.
    • Operational excellence. 

    Answering WAR questions helps identify which areas fall into three categories: 

    • Well-Architected.
    • Need Improvement.
    • Critical Issues.

    Critical issues should be remediated immediately. These are things such as not using multi-factor for your accounts or exposing data to the public. Need Improvement items should be looked at over a three to six month time period. 

    AWS recommends that you perform these reviews periodically (at least every six to 12 months) on each critical workload. Even items that are deemed Well-Architected today can change due to changes in your environment or new options that replace the way you are doing things today.

    How to Go About a WAR for AWS

    There are two key factors that must be considered before you think about conducting WAR on AWS:

    1. Architecture Complexity.
    2. Skill Level.

    We are going to look at some example cases on what combination of factors should encourage you to wage WAR, or not.

    Case 1: Highly complex architecture and expert skill set.

    If you have a highly complex architecture and an expert skill set, a hybrid approach is recommended.

    Meeting with an AWS representative at least once can be very helpful to pinpoint small, important things that are easily overlooked. For example, a focus on the business logic based infrastructure might obscure your view of a Critical Issue. 

    After the initial WAR exercise and importing the results within the AWS console, you could get away with repeating the same process internally with your highly skilled staff. Frequency of WARs depend on what you discover and the amount of resources available to you internally.

    Case 2: Highly complex architecture and novice skill set.

    When you are handling a highly complex architecture and do not have the bandwidth to understand the different pillars of the Well-Architected Framework, look for external help. Negotiating a good price with an AWS partner, is the best approach. 

    Cost concerns shouldn’t stop you from a WAR. The cost savings coming from a Well-Architected Review may justify the additional costs involved in engaging with an AWS partner consultant.

    Case 3: Less complex architecture and novice skill set.

    If you are fairly new to AWS and the complexity of your architecture is not too high, it is recommended to engage directly with AWS team. A WAR will help you understand how to handle disaster recovery, redundancy, failovers, etc. that are usually not taken into account with new teams. 

    Case 4: Less complex architecture and expert skill set.

    The only case when a do-it-yourself (DIY) approach is viable (yet optional) is when you have a low level or architectural complexity and expert level skill. 

    For a DIY WAR, you can use the AWS Well-Architected Tool, released in November of 2018, along with a user guide. Review the Well Architected Framework whitepaper and refer to the questions and best practices to conduct the review yourself.

    The Well-Architected Tool is already part of your AWS Console. It’s incredibly easy to use. There are great instructions and videos for each question. 

    Getting to know all the pillars by navigating the AWS resources is highly recommended. 

    The Process of WAR 

    The process of WAR is simple and not as tedious as you may worry. It starts with a questionnaire-based review. The review usually takes a couple of hours and is relatively painless. Whether you do it yourself, appoint an AWS partner or engage directly with the AWS team of experts, you will use the Well-Architected Tool to go through the 46 questions. At the end of the initial session, you can expect to gain a decent understanding of your current architecture and a very detailed report breaking down the Critical Issues and Need Improvement areas into actionable steps for improvement. Outside a DIY approach, you are likely to receive a detailed report identifying the gaps in all five pillars of WAR.

    Amazon is known for its fundamental principle of customer delight. This philosophy really comes alive with WAR as AWS representatives work with customers to help mitigate findings after a WAR. Often times, companies can obtain credit from AWS to fix critical issues identified during WAR. War can be done in multiple iterations, especially if several critical workloads are identified and taken into the scope of WAR.

    What Is a Critical Workload?  

    Each customer knows their business and what’s critical to their operations. That might be your customer portal processing all your orders. It might be the supply chain system driving your manufacturing processes. It might be your case management system used to ensure client work gets completed on time. The critical workload is what you identify as most critical to your operations for running, changing or growing your business.

    Various Lenses for a Stronger WAR-Time Vision

    AWS means it when they say “put on various lenses.” The WAR process is an ever-evolving process. AWS has expanded the WAR for some very specific use cases. AWS calls these “lenses”:  

    Each lens area is changing quickly and has different architecture best practices. This is a strong reason why relying exclusively on a CSP for cloud security is never a good idea. A constantly evolving threat landscape makes it critical to understand the necessity of shared responsibilities and what is at stake. 

    For the sake of understanding, let’s focus on one of the lenses: serverless.

    Serverless computing assumes the provider runs the code provided by the customer while completely taking care of the infrastructure and the environment itself. Serverless providers offer what is known as function as a service (FaaS) platforms. FaaS platforms execute code for the application logic, but remain completely stateless themselves, meaning they do not store data. AWS Lambda is the oldest and the most popular public cloud infrastructure serverless computing offering.

    Serverless lens reduces the attack surface. Because AWS takes the infrastructure concerns on itself in their entirety, there is no need to harden EC2 operating systems and configuring container. Also, because there are no data or state exposure to the data, compromise is limited. 

    What still need securing are the APIs to and from the functional computing and access control, including authentication. To secure these vulnerable areas, runtime tools—such as Wallarm’s AI-powered solutions—can enable serverless API security and apply the well-known Defense in Depth strategy.

    To augment WAR process with actionable application security steps and strong granular authentication practices, we recommend:

    1. Applying auto-configured, run-time API security for Defense in Depth.
    2. Integrating automated security testing into your build or continuous integration process.

    DAST: Dynamic Application Security Testing. DEV: Developer.

    WAF: Web Application Firewall. SEC: Security.

    FAST: Framework for Application Security Testing. OPS: Operations.

    CI/CD: Continuous Integration/Continuous Testing.

    Conclusion

    The AWS Well-Architected Framework will provide strategies to help you compare your workload against the best practices recommended in this article. It can also help you get guidance on producing stable and efficient systems, so you can focus on functional requirements and overall business.

    Start learning about WAR by downloading the AWS Well-Architected Framework whitepaper. If there is one thing you must do to best understand and operationalize your shared responsibility with your CSP, is to perform a WAR.

    — Kavya Pearlman

  • Solo.io Creates Registry for Extensions to Envoy Proxy Server

    Solo.io Creates Registry for Extensions to Envoy Proxy Server

    Solo.io has created a WebAssembly Hub registry designed to make it easier to discover and share extensions to the open source Envoy proxy server.

    Now being developed under the auspices of the Cloud Native Computing Foundation (CNCF) after being created by Lyft, Envoy is gaining traction as a proxy server in IT environments that have embraced microservices.

    Solo.io CEO Idit Levine said DevOps teams are challenged by finding a way to extend the Envoy platform, which was developed using the C++ programming language. WebAssembly Hub provides an alternative approach to extending Envoy by employing the portable WebAssembly (Wasm) binary instruction format, known as a Wasm stack machine, that can be embedded as an execution environment in other platforms.

    Wasm, which itself was developed under the auspices of the World Wide Web Consortium (W3C), provides a portable target for compilation of high-level languages such as C, C++ and Rust for building applications in a way that enables DevOps teams to add or modify extensions dynamically by moving code into a running Envoy process without having to stop a process or recompile code, said Levine.

    That approach provides the added benefit of isolating extensions from Envoy, which means if the extension crashes it will not take down Envoy with it, added Levine.

    Levine said Solo.io already employs Wasm to facilitate the development of extensions to Solo Gloo, an open source API gateway optimized for Kubernetes environments built on top of Envoy. Solo Gloo already supports the WebAssembly Hub registry.

    As it turns out, however, Envoy is also at the base of the Istio service mesh. Any platform that employs Envoy now can take advantage of WebAssembly Hub to build and distribute extensions, said Levine. Among other use cases, Solo.io envisions DevOps teams using WebAssembly Hub to discover a web application firewall that can be added to, for example, an Istio service mesh via a few clicks of a mouse—which could significantly advance the adoption of best DevSecOps processes.

    It’s not clear whether IT organizations will replace legacy proxy servers with rival offerings such as Envoy that claim to be more optimized for microservices architectures. In many cases, developers are making decisions based on personal preferences, which results in organizations soon discovering they are supporting multiple proxy servers across a range of classes of applications. Whatever the path chosen, however, those same organizations also may soon discover that a raft of extensions that were built for an Envoy-based platform may usurp a whole range of security, network and application services that today are all invoked in isolation from one another. The one thing that is clear, however, is that most of those services will be invoked programmatically instead of relying on an administrator who has mastered all the nuances of a specific graphical user interface for a single-function platform.

    It may take a while for a new generation of proxy servers to achieve critical mass. However, at this point, it’s no so much about whether they will as much as it is to what degree.

    — Mike Vizard

  • An Overview of Cloud Migration and Open Source

    An Overview of Cloud Migration and Open Source

    Most businesses are moving toward making their business processes more user-friendly, through digitization. This shift of business modernization comes with a heavy price for them in terms of money and in terms of time. It is going to take time and a great amount of investment in new innovative technologies.

    Cloud computing is the biggest trend in digital transformation due to its ability to make business applications and infrastructure easily accessible. In the roadmap toward cloud migration, businesses are looking to save capital investment or expenses (CAPEX) and operational expenses (OPEX). 

    Open source technologies come to rescue for such businesses. Be those who are present at public cloud platforms such as AWS, Azure or Google Cloud, or private data centers. The role and emergence of open source technologies simplified the equation of overall expenditure for all enterprises and organizations of any industry domains. Year by year, more open source projects are coming up and solve major challenges which businesses are facing. Companies such as Red Hat and communities like Linux Foundation have a major role in promoting open source projects at the heart of digital transformation.

    Why Open Source at Cloud?

    • The main reason to adopt open source technologies in the process of cloud migration can be avoiding vendor lock-in in the future. Most public cloud vendors have a similar portfolio of open source supports in their offerings. As open-source projects are not owned by one company and its overall framework is common to all of its consumers, any updates to its core files have an impact on all projects. And businesses can simply move their application environment from one cloud to another without worrying about backend environment that is powered by open-source projects. There can be a seamless integration of applications and services developed or deployed by different businesses and vendors.
    • Open source adoption for cloud will help in interoperability with other enterprise solutions that can be located in different data centers. Though, other data centers should be equipped with the same open source projects. This interoperability enables the reuse of software stacks, libraries and components. Such interoperability can help deploy multi-cloud environment for businesses.

    The Cloud-Native Approach in Cloud

    Application containerization has been adopted by many solutions providers and vendors in the last few years and has become significantly popular. This containerization surge has triggered the use of cloud-native applications. Most of the popular cloud-native projects are hosted in Linux Foundation’s CNCF (Cloud Native Foundation) community which nurtures the development of various open source projects. Some of the popular projects are Kubernetes, Prometheus, Envoy, Helm, rkt, Linkerd, Etcd, Jaeger, etc.

    The cloud-native approach involves the utilization of tools for handling containers, micro-services, service mesh, DevOps and continuous integration (CI) and continuous deployment (CD). Cloud-native tools for CI/CD can be Check, Ansible, puppet, etc., and service mesh can be Istio, Linkerd, etc.

    Most of the enterprises tend to involve open source projects from various umbrella’s to build the Cloud migration strategy. Moving to cloud-native management of application can be a prominent requirement for many enterprises.   

    Open Source Cloud Migration Tools

    There are open source tools and frameworks that help with cloud data migration. These tools require modification in terms of coding to make the migration process that suits your infrastructure. To make coding customizations in these tools you might need investment for skilled resources.

    The above projects help enterprises to move data. Bluethroat is an open source project which can be used for migration of overall infrastructure from data center to data center, data center to the cloud, cloud to data center and cloud to cloud. Currently it is powered with limited features and used specifically for AWS. It offers the following features:

    • Migration of infrastructure to AWS.
    • Agentless.
    • Environment discovery.
    • Automatic network creation and server deployment.
    • Linux server migration.

    Conclusion

    Cloud migration has its own challenges in terms of uptime, security and data loss. Most public clouds are evolved to handle data as well as application workload migrations. There are many benefits to open source projects, as discussed in this article. The main advantages of migrating open source frameworks to the cloud are cutting back on expenses and avoiding bottlenecks.

    — Sagar Nangare

  • HashiCorp Advances Open Source Consul Service Mesh

    HashiCorp Advances Open Source Consul Service Mesh

    HashiCorp this week updated its Consul service mesh to make it easier to manage namespaces across multiple services.

    Previously, DevOps teams would have to manually ensure each namespace assigned to a group of services did not conflict with each other. The release of 1.7 of Consul enables teams to restrict access to services residing in isolated environments on a shared cluster, eliminating the issue.

    In addition, DevOps teams can now delegate administrative privileges for a given namespace to individual teams, which enables them to manage their own services in keeping with best DevOps practices, rather than having to rely on a cybersecurity team to manage that process for them.

    With the rise of microservices based on containers, interest in service meshes to provide a means to discover and manage services is on the rise. However, services span both emerging microservices-based applications and legacy monolithic applications. Rather than adopting a service mesh that only runs on one platform, HashiCorp is opting for an open source service mesh that spans multiple platforms and is easier to deploy and manage than rival offerings such as Istio.

    Amith Nair, vice president of product marketing at HashiCorp, said that approach also makes it easier to deploy a service mesh at scale across multiple clouds and on-premises IT environments. Because Consul is designed to deployed on top of proxy servers such as Envoy or NGNIX, it can be deployed almost anywhere to manage services sprawl across the extended enterprise, noted Nair.

    As far as the adoption of service meshes are concerned, it is still early days. Many organizations are in the process of shifting away from managing applications to focusing on services that span multiple applications. Given all the dependencies that exist between various services, that shift represents a major challenge. A service mesh alleviates some of that challenge by providing a mechanism for both discovering and governing services that are increasingly interdependent.

    That approach also provides the added benefit of allowing teams tasked with governing and auditing IT environments to focus more on higher levels of abstractions versus updates to every line of code on which those services are constructed.

    For now, there are no standards, de facto or otherwise, in terms of service meshes. Many organizations may find themselves adopting multiple frameworks, which may lead to further advances in interoperability specifications such as the Service Mesh Interface between rival platforms.

    Less clear for now is who inside an IT organization will be responsible for acquiring and managing a service mesh. In some organizations it might be a network operations or cybersecurity team. In other organizations, those roles may have already been incorporated within a larger DevOps team.

    Regardless of the approach, the need for some type of service mesh is becoming more apparent. The good news is there is now no shortage of options. However, DevOps teams should note that in terms of overall complexity and amount of compute resources consumed, not all services meshes are the same.

    — Mike Vizard

  • DevOps Tools for the Monitoring Ecosystem

    DevOps Tools for the Monitoring Ecosystem

    DevOps is a cultural and process transformation—the goal of it is to achieve a higher rate of change and quality of software. There are categories of tools to help facilitate this transformation through automation and increased measurement and visibility. You can’t have or observe progress without measurement, and throughout your transformation you need to maintain a high degree of visibility in order to move quickly, safely. Not only is the idea of cultural and process transformation daunting for many organizations, adopting the tools to help you on that journey is even more so, as it requires a great deal of learning. 

    An integrated set of DevOps tools for monitoring has the power to improve visibility and productivity, achieve higher-performing systems and establish cross-functional collaboration. The right toolset is more than the tools themselves—it’s about developing the culture, discipline and practices that come to define your product/service and your workplace.

    This article will outline some of the best DevOps tools and practices when it comes to the monitoring ecosystem that help developer and operations teams work together effectively.

    Monitoring Tools

    A good monitoring platform lets you monitor infrastructure and application performance, whether on-prem, in the cloud or across containerized environments—so you have complete visibility into every system, all the time. Whether you want to monitor Kubernetes, IoT devices or bare metal, the right monitoring tool helps make it possible.

    An effective monitoring tool improves system performance and productivity, and helps you reduce downtime. You can adequately plan for upgrades and new projects, and better allocate your time and resources. You can detect problems—and solve them—before they impact users.

    There are a ton of great monitoring tools out there; I won’t go into them all here, but I’ll highlight the top three in terms of popularity.

    Love it or hate it, Nagios is still very much a widely used tool and formed the foundation for monitoring as we know it today. Plus, the Nagios service check is actually awesome (and underappreciated). Where Nagios falls short, however, is when it comes to monitoring ephemeral environments, such as Kubernetes and Docker, at scale. In reality, Nagios falls short when it comes to monitoring at scale in any environment, whether that’s virtualized or not. Enter Prometheus, an open source monitoring tool (and, like Kubernetes, a part of the CNCF) that uses a pull-based architecture. Instead of pushing metrics to the monitoring tool, it pulls metrics from services. Due to Kubernetes’ built-in exporters, Prometheus is often the go-to for monitoring Kubernetes, but it falls short when it comes to monitoring older infrastructure (see more pros and cons of Prometheus here).

    That brings me to Sensu, which offers the best of both worlds: you can reuse Nagios service checks in Sensu and monitor ephemeral environments at scale. If you have a strictly container-based environment, then Prometheus is a good choice; if you have a mix of multi-generational infrastructure (which we’re finding more often than not with our customers), then Sensu is the way to go.

    Configuration Management Tools

    Configuration management tools allow you to automate the provisioning and deployment of systems, enforce desired configurations and remediate configuration drift. By modeling your infrastructure as code, you can apply software delivery practices such as version control, automated testing and continuous delivery to infrastructure and applications.

    Automating work that used to be manual, repetitive and error-prone results in greater speed, predictability and scalability—and the assurance of standardized configurations across test, developer and production environments. Eliminating snowflake servers reduces time (and headaches) and lets you deploy software faster and more reliably.

    Popular configuration management tools include: Ansible, which is written in Python, agent-less and utilizes an imperative (as opposed to a declarative) approach. Puppet is another popular choice—it relies on a declarative config management approach and uses domain-specific language and an agent/master architecture. Finally, there’s Chef, which is written in Ruby and Erlang, and is modeled similar to Puppet.

    Alerting Tools

    Alerting tools provide both actionable and informational system alerts, and can be customized to fit the complexities of your systems. For example, your alerting system needs to be sensitive enough to cover an outage—but not so sensitive that you’re catching frequent, intermittent problems that users aren’t going to see and that would inundate you with needless alerts.

    Alerting tools help lay the foundation for your alerting policies, so you can determine who to notify, how to track issues and outcomes and how to prioritize remediation. Popular tools include PagerDuty, which offers an on-call management platform with add-ons for analytics, event intelligence and automated incident response. There’s also ServiceNow, which utilizes automated workflows for ITSM as well as customer service and business processes. You can send your alerts into Slack to consolidate alerts into the same platform you use for collaborating with your team.

    Metrics Storage

    Once you’ve automated configuration management, alerting and monitoring, you’ll have a whole lot of data at your disposal to learn from. The challenge: How do you securely store and analyze it? You need a storage system that lets you aggregate and learn from system capacity, user behavior, service levels, security risks and more.

    The insights you gain from your metrics inform decisions across all layers of your business, improving your ability to meet SLAs, satisfy customer expectations and make the case for new strategic investments. Data-driven decisions promote a culture of continuous learning and improvement.

    Popular tools for storing metrics includes InfluxDB and TimescaleDB, time-series databases (TSDBs) that are well suited for long-term storage, and Splunk, which uses a search engine database model to store and query your data. Amazon Web Services (AWS) supports a wide range of storage purposes, including relational and non-relational databases, a data warehouse for analytics, a TSDB, a leger database to store transactions and more.

    Visualization Tools

    A visualization tool might be considered the pièce de résistance of your DevOps toolchain for monitoring: You get to combine all of your data, sort and visualize it, and display it on customizable dashboards.

    Visualization tools provide context and meaning, allow you to track changes and improvements over time and give management a real-time view that helps guide strategic decisions. Customization options make it easy for team members to design and share their own dashboards.

    Grafana is a popular open source visualization tool and can be used on top of a variety of different data stores, including Graphite, InfluxDB and Elasticsearch. For more on how Grafana can integrate with your monitoring and TSDB, check out this use case.

    Evaluating Your DevOps Tools

    No matter where you are in your DevOps journey, it’s wise to re-evaluate the tools you’re using and identify where you can fine tune. Think about the DevOps tools in the monitoring ecosystem as more than their capabilities. How you use them begins to define your habits, values and work culture—and accordingly, the quality of your product or service and the value you bring to your users.

    — Sean Porter

  • Predictions 2020: The Future of APM Strategies and Tools

    Predictions 2020: The Future of APM Strategies and Tools

    As 2019 comes to an end, it’s safe to say that multi-cloud strategies are here to stay. We can predict that 2020 will bring an ever-increasing demand for application performance management (APM) tools and services.

    So what does the future of APM look like? Let’s dive in.

    Multi-Cloud Strategies Increase the Demand for APM Tool Adoption

    Companies are increasingly adopting more than one platform—either for financial leverage or to create a time-to-market or feature race between the platforms. To remain competitive, public cloud providers must offer unique features or capabilities differentiating them from competitors. This has created an upsurge in new and more complex technologies, increasing the need for APM tool adoption.

    Logs Will Be Recognized as Key Aspects of APM

    APM is a puzzle made up of user experience, metrics and traces, and logs—and each piece must be incorporated to achieve full-stack visibility and ultimately seamless app performance. However, a healthy app is not characterized solely by top performance, but also availability—making a log management solution that monitors availability, enables proactivity and reacts quickly to remediate problems key.

    In 2020, implementing solutions that achieve integrated application performance and availability management for any type of organization, including those operating on-premises and/or cloud-based applications across all mixes of cloud environments, will become increasingly important and prioritized.

    APM Skills in a Cloud-First World

    The nouns have changed, but the verbs remain the same: APM skills are among the top skills tech pros want to develop in the coming year, according to the recent SolarWinds IT Pro Day survey, Building Confidence for Tech Pros of Tomorrow. However, in 2020 tech pros will begin to recognize that many of the skills they already possess are sufficient to manage the new realm of integrated solutions in the cloud. Tech pros can leverage some of the same skills they could before as the nouns have changed, but the verbs remain the same. Where we used to have server or virtual machine, now we have containers. But the verbs? They’ve always been focused on optimizing performance, ensuring availability and planning capacity.

    In 2020, the extent to which tech pros will discover they don’t need to fear new nouns (more than they did when they moved from client virtualization) will increase.

    Universal Adoption of APM Tools

    As environments become more dynamic and complex, the opportunity for applications to break increases—creating the need for robust monitoring tools. In 2020, as buyers see the benefit of leveraging APM tools on a regular basis rather than only in critical moments, the market will adjust accordingly. We can expect easier-to-implement solutions that are more highly valuable and affordable. The paradigm that APM tools have to be expensive will be broken once and for all.

    Want to learn more about what to expect in 2020? Join us Jan. 23 for our Predict 2020 Virtual Summit  featuring discussions from some of the industry’s best and brightest offering up their visions for the future. Sign up today for this free daylong virtual event.

    — David Wagner