Category: DevOps Toolbox

  • The NVMF Boogie: How Kubernetes and NVMF Will Rock

    The NVMF Boogie: How Kubernetes and NVMF Will Rock

    I recently wrote a blog about how Kubernetes creates a global computing grid that delivers unprecedented compute flexibility. Then I wrote a blog about the importance of going fully Kubernetes-native. In today’s blog I would like to drill down into the role that the NVMe over Fabrics (NVMe-oF or just NVMF) standard will play in enabling Kubernetes infrastructure flexibility.

    What is NVMe?

    NVMe is a protocol that dictates how a CPU, moves memory via the PCI bus to a storage device. NVMe communicates over a set of rings (per CPU) where commands get submitted from any CPU to the underlying NVMe device. The design of NVMe eliminates intermediate layers between the CPU and the storage device. NVMe devices consist of a controller, queues, namespaces, namespace IDs and the actual storage media with some form of an interface.

    Storage media can be grouped into sections called namespaces with an ID. In the context of NVMF, namespaces provide a way to enforce access control for the disks/consumers. Namespaces are analogous to an OS partition, except the partitioning is done in hardware by the controller and not the OS (you can still have OS partitions on namespaces). Some NVMe namespaces might be hidden from a user (e.g. for security isolation). A controller connects to a port through queues and a namespace through its namespace ID. A controller is allowed to connect to multiple namespaces and a namespace is allowed to be controlled by multiple controllers (and thus also, multiple ports).

    Imagine smearing out this NVMe device across multiple computers and you get to the next important concept, a storage fabric.

    What is NVMF?

    When you put a network between the PCI bus and the storage device, you use NVMe over Fabric (aka NVMe-oF or simply NVMF). NVMF enables fast access between hosts and storage systems over a network. Compared to iSCSI, NVMF has much lower access latency, in practice adding only a small latency difference between local and remote storage. NVMF delivers a breakthrough in throughput and seek time relative to traditional device attached storage:
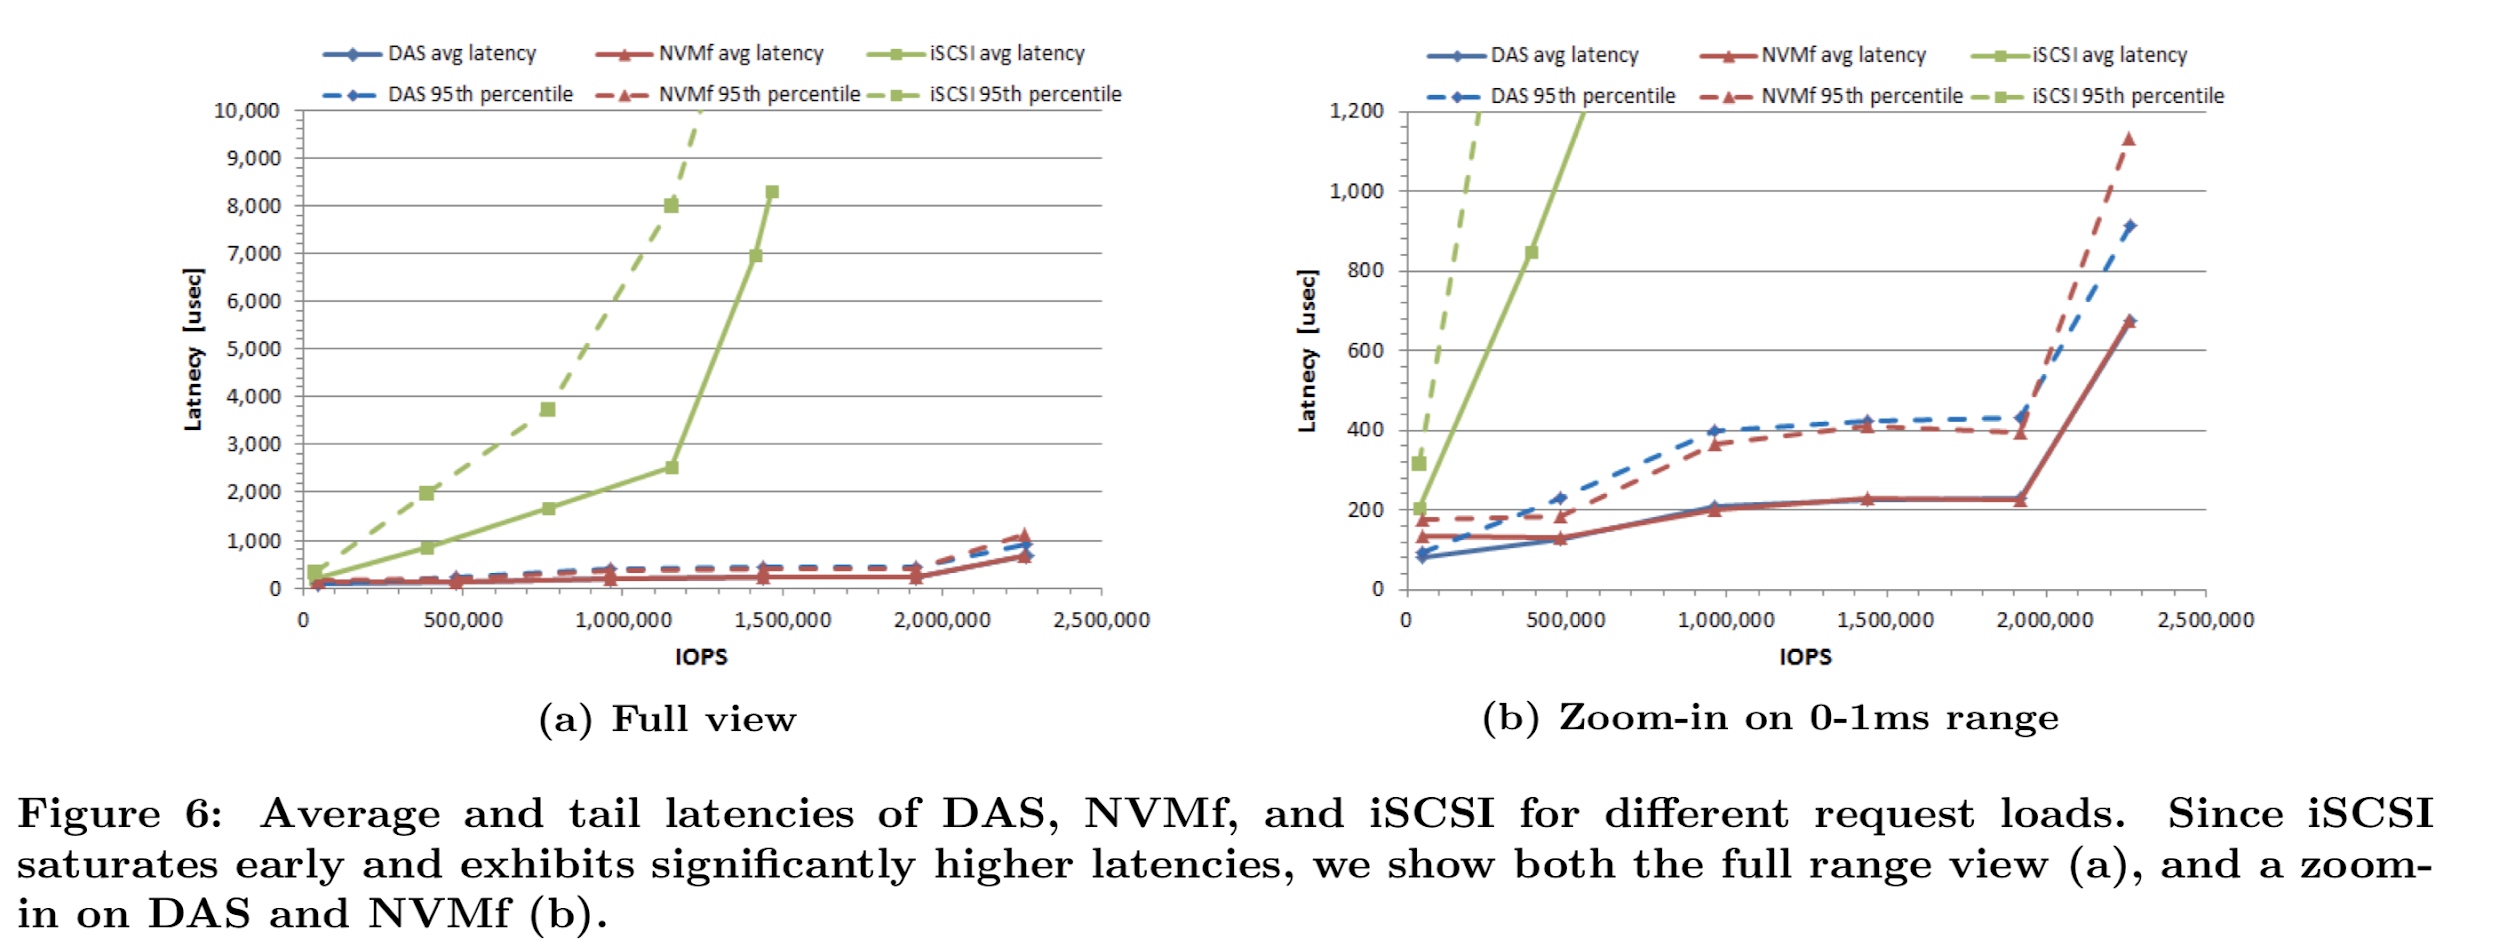
    Source: Samsung.

    This is possible because NVMF uses RDMA to efficiently access the memory of another computer without using the CPU or operating system of either. RDMA is a transport protocol that bypasses the kernel stack, offloading the workload to network hardware. This means the transport layer takes place in the RDMA NIC itself, so data is transferred directly to or from application memory without having to involve the normal OS-level network stack, achieving low latency with low CPU consumption.

    Of course, NVMF performance is gated by the networking infrastructure used, whether Ethernet, Infiniband or Fibre Channel. The November 2018 final ratification of the NVMe/TCP transport specification has accelerated adoption of NVMF because it allows storage fabrics to be deployed on standard network hardware.

    NVMF can be used with white label storage systems (JBOD), feature-rich block storage systems (SAN), and storage systems built with previous generation (SATA) devices. This means data centers can simultaneously leverage low latency devices while also using more traditional storage subsystems. NVMF also supports using storage class memory as a cache in the data center compute hierarchy.

    Why is NVMF Important?

    Think of NVMe as a replacement for SCSI, and NVMF as a replacement for iSCSI and iSER. NVMF has several distinguishing technical attributes that add up to huge performance scalability at the storage infrastructure layer:

    • Protocol Efficiency: The NVMe-oF protocol is designed specifically for efficient memory transfers at scale. Designed from the ground up for scalability, the NVMe-oF protocol dramatically reduces the internal locking needed to serialize I/O and improves the efficiency of interrupt handling. NVMe-oF also supports MSI-X and interrupt steering, which prevents bottlenecking at the CPU level and enables massive scalability as systems scale. Combined with the large number of cores in modern processors, NVMe-oF delivers massive parallelism to connected devices which increases I/O throughput and lowers I/O latency.
    • Command Set Efficiency: NVMe-oF has a streamlined and simple command set that uses less than half the number of CPU instructions to process an I/O request that SAS or SATA does, providing higher IOPS per CPU instruction cycle and lower I/O latency in the host software stack. NVMe-oF also supports enterprise features such as reservations and client features such as power management, extending the improved efficiency beyond just I/O. NVMEOF devices can approach DDR4 performance levels and, with SCM, become an integral component of the computing memory hierarchy.
    • Queue Parallelism: With 65,535 parallel queues, each with a queue depth of 65,535 entries, NVMe-oF supports massive parallelism. Every CPU has a private queue to communicate with a data device and is capable of achieving high speeds because there are no locks between queues that live on separate cores. Because each controller has its own set of queues per CPU, I/O throughput increases linearly with the number of available cores.
    • Integrated Security: NVMe-oF includes a tunneling protocol that provides security features produced by the Trusted Computing Group (TCG) and other related communities. Features planned for NVMe-oF devices and systems include simple access control, data at rest protection, crypto-erase, purge-level erase and others. Additional information on NVMe-oF security is available in the Trusted Computing Group and NVM Express Joint White Paper: TCG Storage, Opal and NVMe.

    NVMe-oF is designed not only to solve the limitations of scale-out storage, but also to lay the foundation for a storage fabric that dynamically shifts as workloads demand.

    What Makes NVMF Important to Kubernetes?

    Kubernetes applications implicitly need the infrastructure flexibility enabled by NVMF. NVMF and Kubernetes makes distributed computing within sites easier.

    The key point of my Kubernetes-native blog was “(Kubernetes-native) applications break apart into their constituent elements and can deploy and scale across the latency pyramid where they fit best. The elements dance across the infrastructure following their constituents in what I imagine as a containerized ‘ballet’ focused on delivering the best possible user experience at the lowest possible latencies.”

    However, multi-cloud, multi-site and edge deployments introduce significant additional complexity for organizations operating Kubernetes at (or beyond) enterprise scale. Business needs are pushing IT teams to move workloads between sites, clouds, WAN edge and rapidly be able to clone, burst and then destroy workloads anywhere around the world as needed. Yet Kubernetes deployment across multiple regions, sites, clouds and WAN edge remains problematic.

    OpenEBS is the solution for latency sensitive stateful Kubernetes workloads that need universal data agility. A NVMF-based disaggregated storage physical fabric mates perfectly with the disaggregated data agility software infrastructure offered by OpenEBS. NVMF allows data to physically float across a single storage fabric while OpenEBS allows stateful workloads to be loosely coupled across multiple storage infrastructures. And the OpenEBS MayaStor project natively integrates to NVMF to simplify the developer experience.

    Together, NVMF and OpenEBS become the dance floor for those Kubernetes-native application components to do their infrastructure-aware (and infrastructure-intelligent) ballet. Given its performance and scalability, however, perhaps this is better called the NVMF Boogie.

    To learn more about containerized infrastructure and cloud native technologies, consider coming to KubeCon + CloudNativeCon NA, November 18-21 in San Diego.


    — Charles Piercey

  • What Are AWS Application Patterns?

    What Are AWS Application Patterns?

    The cloud-native approach is not just about compute power and cloud services. A “set it and forget it” attitude won’t work with cloud native; there are far too many moving pieces and there is just way too much complexity. Instead, this approach requires constant testing, optimization and improvement. This is epitomized in the two key phrases of the DevOps methodology: continuous integration and continuous delivery.

    To make this a reality, however, it takes a strategic approach to defining application patterns that will govern the way in which cloud-native applications are built and shipped, rather than a one-off effort. Since AWS is the leading cloud provider, we should discuss which application patterns are relevant to the AWS platform. There are many aspects to consider when it comes to AWS application patterns, and we will cover them here.

    Operational Excellence

    The best starting point for application patterns is a commitment to operational excellence. Typically, the term “Ops” is used to identify the IT team, but in this case, operational excellence rests on the shoulders of Dev, QA and Ops teams. In cross-functional DevOps teams, every member should strive for operational excellence at every step–even in the smallest of tasks.

    In their white paper on operational excellence, AWS encourages its users to manage operations as code. This helps avoid human error, enables automation of complex processes and allows for quick and easy rollback when errors occur. Failure, according to AWS, is an opportunity for learning. They even advise performing “pre-mortems” that try to anticipate potential points of failure before a deployment.

    AWS Trusted Advisor is a useful tool that enables this type of accountability and shared responsibility within a team. It checks and reviews your new and existing AWS workloads looking for opportunities to save costs, improve performance, tighten security or follow best practices for scaling operations.

    Security

    Security is a pattern that is non-negotiable. The term “DevOps” has inspired another variation called DevSecOps that signifies this fact. Security operations take center stage when talking about DevOps.

    The interesting thing about DevSecOps is it actually results in more freedom, flexibility and trust across teams when done right. This is unlike traditional approaches to security which created silos, stifled creativity and slowed down innovation. Security is now a key piece of the puzzle, not an afterthought. AWS has many machine learning-based security solutions such as Macie which automatically identifies and secures personally identifiable information (PII).

    Along with this, configuring role-based access controls using AWS IAM is essential to have greater control over who or which applications access data and for how long. Access Control Lists govern access to data stored in AWS S3 buckets.

    The news is full of instances of data breaches due to weak security policies and access controls. Capital One is a recent example of a data breach that affected 100 million of its users. While security in the cloud is more complex than before, AWS has the necessary tools and systems in place. It’s up to organizations to implement a security strategy that prevents misuse of their data.

    Reliability

    Today, there is a low tolerance for downtime because of the potential loss of revenue. With the stakes so high, reliability is a pattern any application custodian would have high on their list of priorities. AWS has multiple reporting and health monitoring tools to keep you constantly on the pulse of your applications.

    Architectural patterns like microservices enable better resilience by decomposing monolithic applications into more manageable chunks called services. This “divide and conquer” approach leads to higher availability, which is critical for SaaS applications.

    Patterns like chaos engineering seek to intentionally kill random instances and services and force the DevOps team to figure out workarounds and backups for every scenario.

    Application Performance

    With the explosion of data, applications are always dealing with lots of data to transfer, store and process. An application’s performance depends on three factors: the backend data storage layer, the middleware components and the frontend.

    The backend data layer is the most critical component when it comes to performance. Choosing the right storage formats, database types, storage devices and organization patterns all contribute to the speed of data access. AWS has an amazing array of storage services, including S3, RedShift, Aurora and Glacier. AWS gives its users every type of storage solution, all of which should be considered to improve data management.

    AWS is devising new ways to query large datasets without bearing the load on your existing systems. RedShift Spectrum is one example of this. It is a great way to “minimize the need to scale Redshift with a new node, which can be expensive.” If you’d still rather not have to manage any RedShift clusters on your own AWS Athena is a great serverless alternative

    That gives you all the power you need to query large datasets in S3 without having to maintain any clusters of your own.

    This pay-per-use model is making its ways across the entire AWS stack with services such as ECS and Fargate offering completely serverless experiences when operating containers at scale. What started out with AWS Lambda is catching on fast, and many AWS services like the ones mentioned above enable serverless experiences with a focus on application performance.

    Cost Optimization

    When moving to the cloud, pricing is completely different. Rather than paying for perpetual licenses, you now pay a small fee for every small resource that you use. Though small on its own, you’ll soon realize that cloud costs can shoot up easily if you’re not paying close attention to your spending.

    Cost optimization is necessary as you scale operations in the cloud. Cost optimization includes looking for more efficient services, whether that’s within the same vendor platform or a different platform. At a minimum it may require a lift-and-shift approach to transition from expensive old infrastructure to inexpensive new alternatives. For example, shifting workloads from VMs to containers to serverless within the same platform can show great cost savings, since containers and serverless are generally more cost-effective than VMs.

    It pays to leverage the expertise of experts in this area. They should ideally be people who have spent years using AWS, understand Well-Architected best practices and have found ways to cut costs and derive more value from the same budget.

    Application Patterns Enable Extensibility

    Microservice applications adopt a pluggable architecture. This enables them to be easily integrated with external applications. Typically, API-based communication patterns are most common. AWS API Gateway is a service that manages API design for AWS applications. In some cases, an SDK is the better choice–for example, when you need more control over the developer experience and integrations. It’s important to know when to choose either option.

    Application Patterns Enable Portability

    Portability is the ability to move workloads across instances without interrupting their functioning. As instances change, the workloads which they support shouldn’t be affected. This is only possible if there is a clear separation layer between the workloads and the infrastructure that runs them.

    Application Patterns Enable Shift-Left

    The DevOps methodology is known to encourage a shift-left approach to software delivery. This means that not only Dev, but also QA and Ops contribute to the design and development stage of an application. This fosters deeper collaboration across teams and breaks down silos.

    A shift-right approach holds true as well. Shift-right means developers are responsible for the code they write. They are equal owners with operations teams for the resilience of the apps they build and also the bugs they introduce into the system. This practice of putting ownership and responsibility where it belongs is very healthy for a DevOps team.

    AWS facilitates pipeline management using tools such as CodePipeline, CodeCommit and CodeDeploy. They each perform similar but complementary roles and help build a CI/CD pipeline. They make it easy to get started with CI/CD within the AWS platform.

    For organizations further down the line in their cloud journey, AWS’ pipeline management tools may seem too simplistic for something like GitOps. Instead, they’d want to look outside AWS for tools such as Jenkins X or Weave Flux which are designed with GitOps automation in mind. Whether it’s the simple or advanced route, a pipeline brings great benefits over a manual development process.

    Conclusion

    Though tools enable the implementation of helpful application patterns, on their own, they are ineffective. Application patterns need a deliberate strategy and an approach for a start. Only after a strategy is in place, can you move to deciding which tools to use. With a strong strategy in place, any of the tools mentioned here can be swapped out for other better tools and the results will be the same. It’s important to not be distracted by the next shiny tool but keep a keen focus on the strategy for implementing AWS application patterns.

    As we’ve seen here, application patterns are diverse, but they all build upon each other. Without even one of these pillars, organizations would not be able to realize the goal of cloud-native applications. On the other hand, if they give careful thought to each of these application patterns, organizations would deliver cutting-edge applications that can only get better with the passing of time.

    This sponsored article was written on behalf of Eplexity.

    — Twain Taylor

  • DevOps at a Distance

    DevOps at a Distance

    How do you successfully follow DevOps practices when the two parts of your team are 5,000 miles (8,000km) and two time zones apart?

    Airwallex is a global fintech founded in Melbourne, Australia just four years ago. It is Australia’s fastest-growth tech unicorn with a valuation of over $1 billion thanks in part to investments from companies such as Tencent Holdings, Sequoia Capital, Square Peg, Horizon Ventures, DST Global and MasterCard.

    The business came into being when co-founders Jack Zhang and Max Li–who both worked in the banking sector–started a cafe in Melbourne’s Docklands area and realized that expensive foreign exchange rates hurt their profit margins when they imported products such as coffee cups.

    Zhang was a software developer working in investment banking and foreign trading, and he knew technology could be applied to the problem.

    Four years later, the company operates a network that allows SMEs to make easy and affordable payments to more than 130 countries and in 50 currencies.

    Airwallex has 400 employees spread across offices in Hong Kong, London, Melbourne, Shanghai, Shenzhen, San Francisco, Singapore and Tokyo. That headcount includes 50 engineers in Melbourne and 84 in Shanghai.

    “Communications between the two teams is incredibly important,” said Peter O’Donovan, Airwallex engineering lead.

    So the approach has been to treat all of his people as if they were remote workers.

    Tools

    Extensive use of Slack–even when both people are in the same office–keeps everyone in the loop, he explained.

    Similarly, Zoom videoconferencing is used for standups, and physical agile walls are replaced with digital equivalents.

    These tools also allow for the growth of skills across regions, and help ensure everyone is “working to a common pattern.”

    Such shared channels for collaboration and communication help accommodate overlapping working hours (Melbourne and Shanghai are three hours apart when daylight saving is in effect in Australia), as well as the need for engineers to be on call to deal with emergencies.

    This approach puts everyone on a similar footing, whether they work in one of the offices or remotely.

    DevOps leaders need to “focus on building relationships first,” he advised. Frequent video conferences are one way to build bonds with people in different locations. Understanding each others’ mindsets, establishing common ways of working and setting clear expectations are essential, and “doing it from day one is important.”

    Scaling up

    Airwallex plans to double the size of its engineering staff in both cities during 2020. O’Donovan points out that these established standards and practices help with the onboarding process and allow new hires to become productive more quickly.

    That is especially true as the company has selected tools that most people will find familiar: in addition to Slack and Zoom, Airwallex also uses GitHub and G Suite. “These tools are easy to adopt and easy to consume.”

    “Melbourne is a challenging market,” said O’Donovan, because DevOps skills are in demand and Airwallex wants to hire and retain quality talent. But there’s a virtuous circle–helping staff build a strong skill set and surrounding them with other talented people makes it a better place to work, so attraction and retention becomes less of a problem.

    O’Donovan sees DevOps as a key to scaling the company. Having all the teams using the same tools and patterns yields economies of scale by avoiding unnecessary repetition of work, and it allows developers to focus on functionality rather than plumbing.

    Furthermore, regulation and compliance is particularly important in the finance sector, and those considerations need to be built into the processes. “If you can do that seamlessly, you’re doing a good job,” said O’Donovan.

    For example, making vulnerability scanning and the segregation of duties the defaults in the CI/CD pipeline addresses such issues in an automated and auditable manner.

    You need “the right mindset for finance,” he warned. Building in compliance from the start works; trying to add it as an afterthought does not.

    Don’t segregate people, advised O’Donovan, because everyone needs to be working collaboratively toward the same goal. With the right tools and automation, a cross-functional team can deliver better code, faster.

    — Stephen Withers

  • Using Open Source for Better DevOps Outcomes

    Using Open Source for Better DevOps Outcomes

    Many insurers have jumped on the DevOps bandwagon in order to improve the efficiency and effectiveness of their systems and systems implementations. Very few insurers, however, spend much time thinking about the open source software community as a way to improve their DevOps approach–and the skills of their developers–and in that regard they’re missing a golden opportunity. In fact, insurers often restrict their developers from updating or contributing to open source libraries because they don’t realize the potential benefits available to them by participating more actively in the open source community.

    A 2016 survey by 451 Group indicated that the more companies used open source solutions in their DevOps portfolios, the more effective the DevOps function was. More specifically, the study reported that among companies with at least 60% of their DevOps portfolio as open source, a full 54% had reached the “fully deployed” DevOps state, with all of their development occurring via DevOps models.

    By comparison, only 30% of the surveyed companies that used less than 60% of open source tools in their DevOps portfolios had reached this state of DevOps adoption. Clearly there’s a link between open source use and DevOps success. Given these results, insurers should focus on the benefits of supporting and encouraging their DevOps groups to embrace the open source community.

    It’s a dated but still persistent view: Participating and contributing to the open source community means developers are giving away their time by creating and contributing intellectual property (IP) that may benefit others outside the organization. However, the truth of the matter is participating DevOps engineers, developers, analysts, etc. are often fixing bugs and making improvements to code libraries other than their own but that can have value for their own DevOps efforts.

    The very definition of open source –software for which the original source code is made freely available and may be redistributed or modified–makes it fertile ground for skills and solutions improvement. Additionally, that process of analyzing and repairing code represents some serious skills development. It’s the kind of development skills that can be difficult to obtain by just working on in-house applications and platforms–which are often proprietary and dated–lacking modern coding techniques.

    Since open source literally means a developer and/or organization has the ability to make the code fit their needs however they see fit–they control their own version of the product that may diverge from the original open source project–the opportunity for DevOps solutions improvement is substantial. Moreover, any DevOps related IP a developer creates and contributes is not lost and is certainly not stolen–the IP can be used directly by the developer and that developer can continue to benefit from the IP of other developers on a gratis basis.

    Utilizing DevOps solutions from the open source community can be both time and cost effective and can be a positive boon to organizations. While some insurers may not knowingly allow open source code in core systems or applications, its use in a DevOps ecosystem is another matter. That’s especially true since DevOps is a newer and less mature IT function that requires new tool, process and solutions development. Leveraging open source solutions can expedite that process. In fact, many of the key DevOps tools used today either are or started as open source solutions for DevOps problems. One would be hard pressed to find a DevOps development stack–from building/developing to monitoring–that didn’t use at least one open source tool as part of the stack.

    Often the fear or apprehension to using open source libraries (for DevOps or anything else) is that anyone could have written it, thus its quality is or could be sub-par. While in some cases this can be true, the same holds true for closed source proprietary software, as many insurers could attest. Simply put, open source tools and libraries are worked on by developers of the exact same caliber–if not the exact same people–who work on closed source proprietary tools and libraries. The only difference is there are often less people involved with proprietary solutions development. And since there are relatively few proprietary DevOps solutions in the marketplace to choose from, open source should be considered a viable channel for DevOps solutions.

    Even if there were more choices for proprietary DevOps solutions, the financial savings involved in combining open source solutions with DevOps can be significant. Importantly, open source solutions for DevOps are particularly useful when the right solution for a problem has yet to emerge, almost a given in a maturing DevOps ecosystem. Rather than rushing out to buy something that promises to fix the problem–or writing something themselves–DevOps developers can find open source solutions and use those to experiment, test and otherwise isolate and identify the true nature of and solution to a DevOps challenge.

    Another reason DevOps groups should avail themselves of open source techniques and tools is the fact that the tools and techniques available for DevOps–proprietary off the shelf and built inhouse–are still not quite there yet. The tools available are almost always missing something, resulting in developers at many organizations spending most of their time–and the organization’s money–trying to develop fully functional solutions from the ground up.

    More often than not, the resulting tool or solution is never as complete or well-built as the open source tool or solution that already exists. Most organizations would be better served tasking their developers with scouring open source libraries, identifying the “best fit” DevOps tools and then spending the time required creating the updates and improvements to the tools that have already been mostly built, saving time and money.

    Finally, there are lots of DevOps staff out there who participate in the open source community–in their spare time anyway, or have done so while working on previous projects. That means hiring DevOps staff with open source experience is a shortcut to potential open source techniques and tools. These are people that can hit the ground running by bringing their open source experiences to bear while they’re getting up to speed on the proprietary work they may be assigned. Considering these benefits, it’s past time for DevOps groups at insurers to dive into the open source waters.

    — Tanner Gibson

  • The Challenge of Scaling Metrics in Distributed Systems

    The Challenge of Scaling Metrics in Distributed Systems

    Whether migrating from a monolithic architecture or building a distributed system from ground zero, there are many benefits to leverage from a microservices architecture–faster software deployment cycles, enhanced scalability, improved isolation of risk. However, distributed systems are complex and as such, accompanied by many challenges, particularly when it comes to the scalability of metrics.

    The Importance of Observability in Distributed Systems

    In order to realize the benefits of a distributed system, a strategy of data-driven optimization is essential. The paradox here is visibility simplifies complexity, while the complexity of visibility is dramatically increased in distributed systems.

    As New Relic points out in their eBook Cloud Native Is the New Normal, traditional monitoring approaches need to be adapted to meet the demands of decentralized architectures, including:

    • Overcoming the loss of end-to-end monitoring capabilities by learning how to connect the dots across a complex network of environments.
    • Developing tactics to quickly drill down into issues across interconnected parts to reduce mean time to resolution (MTTR).
    • Introducing proactive reliability strategies that focus on measurement first, followed by improvement.

    Finding the Right Balance Between Monitoring Nothing and Monitoring Everything

    Most application engineers leverage some sort of metrics tooling such as Grafana, Prometheus or Graphite to track vitals for their system health. While monitoring is essential, there is such a thing as bloat when it comes to metrics ingestion; and this overload translates to scalability challenges that affect performance, cost and reliability.

    So, how do you know what to monitor? In order to derive the most valuable insights from your system, you must first understand and identify the components, and more specifically which attributes within those components drive key metrics. Knowing this requires an intimate familiarity with how all the pieces work together in your distributed system.

    Google’s Site Reliability Engineering book provides a framework for determining what to monitor in distributed systems. They break signals down into four different categories:

    • Latency: Understand resource requirements and identify bottlenecks.
    • Traffic: Monitor system response to varying levels of load; most useful when paired with other indicators.
    • Errors: Track frequency and nature of interruptions in request/response flow.
    • Saturation: Surface capacity-related issues.

    Even when you’ve identified the most important metrics to track, scalability is still a challenge that must be addressed, particularly when dealing with applications that handle massive volumes of data across a complex application architecture.

    M3: Uber’s Open Source Large-Scale Metrics Platform

    A solution directly addressing the challenges of distributed metrics at scale is M3, an open source project developed by Uber’s engineering team.

    Before using M3, the Uber team sent metrics to a Graphite stack with storage handled using the Whisper file format in a shared Carbon cluster. From there, they created Grafana dashboards to visualize the data and used Nagios for alerting based on Graphite threshold checks via source-controlled scripts. As the volume of metrics continued to expand, manual processes to scale the solution became unsustainable and repeat failures resulting in permanent data loss led them to build a more fault-tolerant, scalable system.

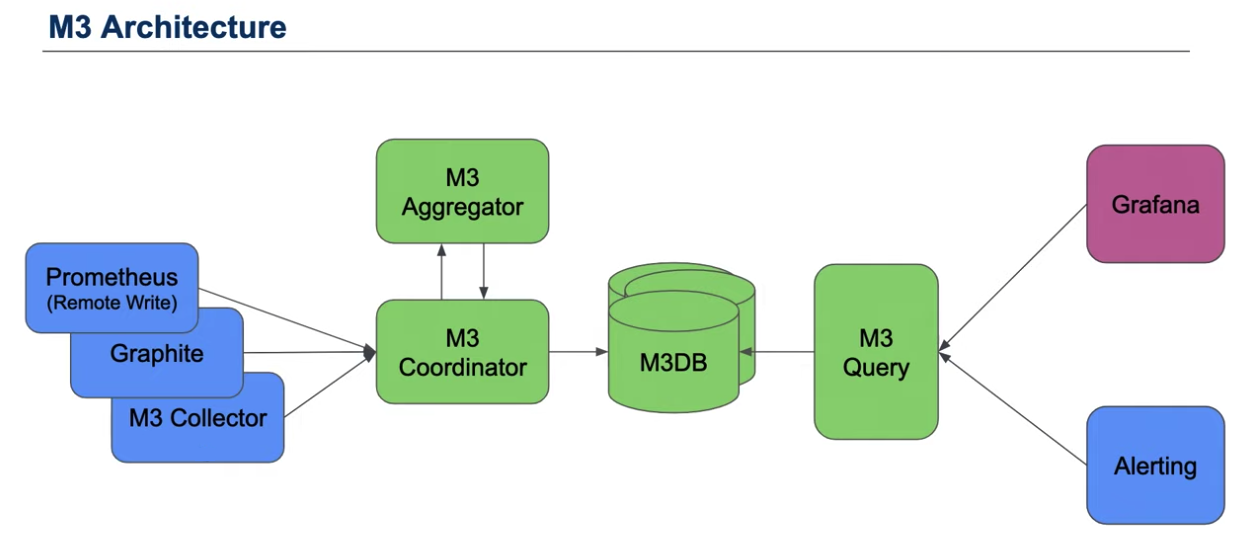
    M3 is focused on providing a reliable storage solution for large-scale metrics over long retention periods, solving inherent single node-associated limitations with Prometheus by offering a multi-tenant store for Prometheus metrics. A key component of this solution is M3DB, the scalable storage backend for M3.

    M3DB, built in Go, is a distributed time series store and reverse index with configurable out-of-order writes. By enabling the storage of real-time metrics over long periods of retention, M3DB can replace a Prometheus cluster. In developing the M3DB solution, the Uber team essentially deconstructed Prometheus into microservices to enable the scaling of each component individually. By taking this approach, M3DB is able to offer better reliability, efficiency and performance.

    At a minimum, M3DB can be leveraged as remote storage for Prometheus (or used to replace any other remote storage solution). There are, however, other features the solution offers, including an external aggregation engine and a separate query engine.

    The M3DB project is still under development with a growing community of contributors.

    To learn more about containerized infrastructure and cloud native technologies, consider coming to KubeCon + CloudNativeCon NA, November 18-21 in San Diego.
    — Molly Wojcik

  • IBM Advances DevOps on the Mainframe

    IBM Advances DevOps on the Mainframe

    IBM has expanded its efforts to bring DevOps best practices to the mainframe by adding automated unit testing capabilities for CICS COBOL programs using Db2 to IBM Developer for z/OS (IDz) V14.2.1. The company is also making an instance of z/OS available within a Docker container that can be deployed on an x86 platform.

    Sanjay Chandru, director for IBM Z DevOps, said both capabilities will play a critical role in enabling IT organizations that have invested in mainframe to be much more agile. The Docker x86 capability will enable developers to build and test applications without requiring access to a mainframe, while IBM’s automated unit testing tools provide a much lighter-weight alternative to previous generations of tools, he said.

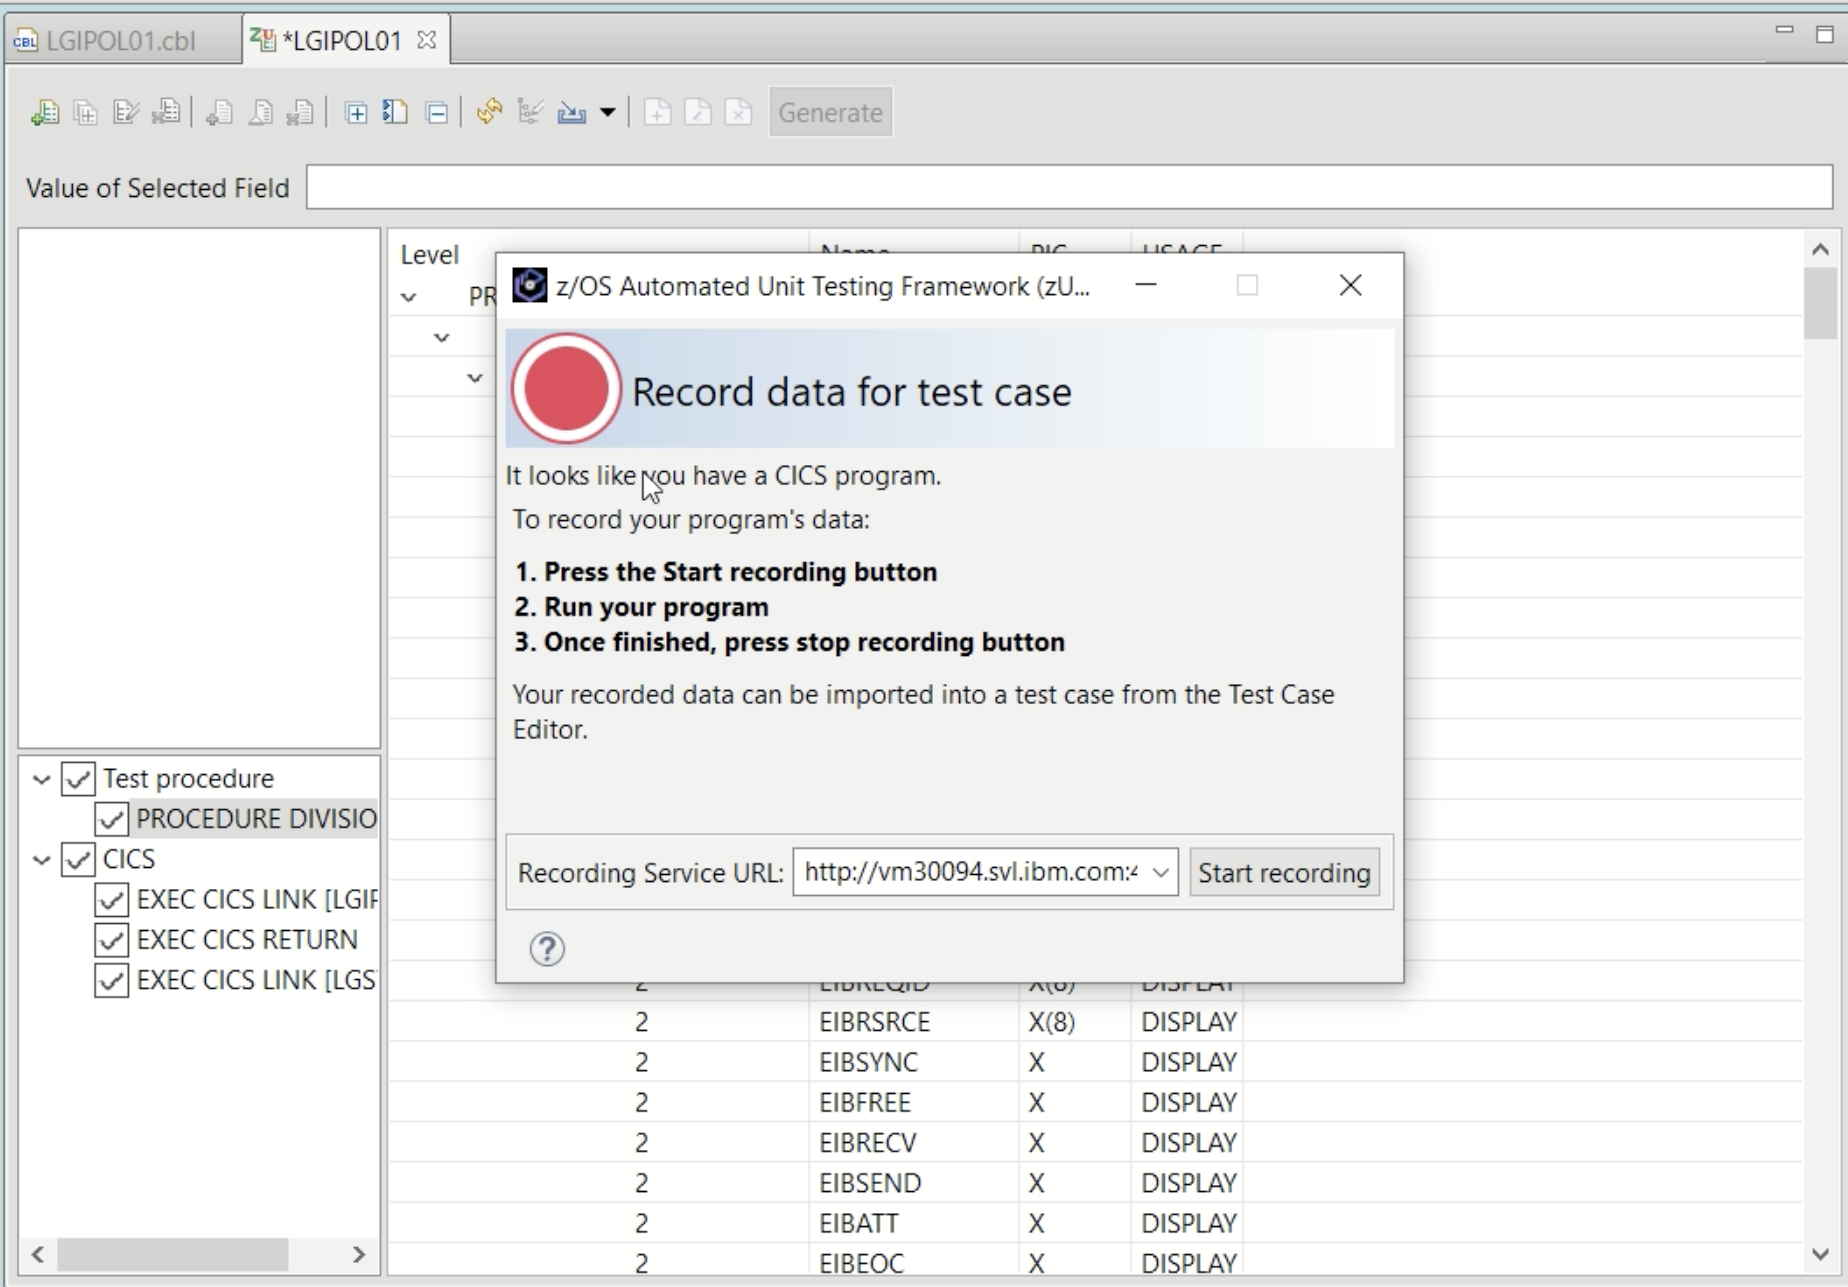
    In addition to automating assertions and pass/fail checks, the automated unit testing capability for IDz makes it possible to invoke the tests from within either the tool itself or as part of a continuous integration/continuous delivery (CI/CD) pipeline, Chandru said. DevOps teams also can now store tests in a modern source code management application alongside the code being developed, he added.

    The IBM unit testing tool can now intercept EXEC CICS and EXEC SQL application calls under CICS to allow data capture during a live run. This recorded data can then be used to create additional tests, including negative tests, in a virtual environment without having CICS because tests are now run as a batch job, Chandru said.

    Finally, IBM is also making it possible to export test results in PDF or XML in addition to JUnit and SonarQube formats.

    Chandru said interest in applying best DevOps practices in mainframe environments has increased dramatically as organizations embrace digital business transformation initiatives. Almost invariably, projects access applications that run on mainframe environments but still process most of the data within enterprise IT environments, he noted. Many organizations are now developing microservices-based applications that rely on mainframes at their back end, he added.

    However, given the rate at which those applications are being developed, legacy approaches to building and deploying mainframe applications are not able to keep pace with the rate of innovation now expected, said Chandru. As a result, IBM is encouraging organizations that have mainframes to shift responsibility for building and deploying applications much further to the left, he said.

    Long term, IBM wants to make developing applications for the mainframe “unremarkable” in the sense that tools for building and deploying applications for any platform should work equally well on mainframes, Chandru said, noting that approach will significantly expand the pool of developers that can build applications for the mainframe.

    It may be a while before DevOps best practices are employed pervasively across mainframe environments, many of which are steeped in legacy waterfall approaches to application development. However, there are pockets of IT teams within mainframe environments that are starting to appreciate the need to be able to respond to changing requirements more rapidly. The only issue that remains now is to determine just how deeply best DevOps practices on the mainframe will be embraced.

    — Mike Vizard

  • Identifying and Abstracting Business Intelligence from Kubernetes Workloads

    Identifying and Abstracting Business Intelligence from Kubernetes Workloads

    In the age of big data, businesses are inundated with data points. While they know there’s an abundance of valuable resources available to them, making sense of this data to derive actionable insights is often still a challenge.

    CNCF industry survey data shows workload complexity and monitoring remain top challenges for enterprises in terms of using and deploying Kubernetes. Many understand there are valuable resources within these environments, but struggle to best identify and extract meaning from machine data. While most of this data is readily available, it just takes the right tools to gather and view intelligent insights.

    The Benefits of Open-Source Data Collection

    Perusing the CNCF website, there are a wealth of tools built around Kubernetes to enable not only monitoring but networking, storage and security. There is even a Kubernetes-specific package manager, Helm, to make the deployment and management of these resources easy and consistent.

    There are a couple of key benefits to taking advantage of these open-source collectors:

    1. They stay up to date. Each of these tools benefits from deep community support. As new versions of Kubernetes are released, the extensive use of each of these tools ensures they are quickly updated.
    2. They integrate with everything. Prometheus, for example, has an impressive list of integrations and exporters.  Regardless of your unique stack, it is likely that there is support for what you might want to export data from. The importance of these integrations cannot be overstated, as they enable the flexibility needed to grow and evolve a Kubernetes deployment over time.

    Ensuring Complete and Organized Metrics Collection

    Prometheus–endorsed by the CNCF–is the de facto tool of choice for metrics monitoring with extensive support for anything you might use to collect metrics data.

    Prometheus works by pulling data from all of the components and jobs running in Kubernetes since every component of Kubernetes exposes its metrics in a Prometheus format. The processes running behind those components then serve up the metrics on an HTTP URL. For example, the Kubernetes API Server serves its metrics on https://$API_HOST:443/metrics.

    Prometheus is particularly good at auto-discovering the jobs and services currently running in a Kubernetes cluster. As pods are added, removed or restarted, the Kubernetes Service construct keeps track of what pods exist for a given service. This auto-discovery capability is one of the primary reasons for Prometheus’ popularity, ensuring that all new and existing components are monitored.

    The Importance of Cluster Level Logging and Event Collection

    Kubernetes does not define a single standard approach to log collection, but the most common method is called cluster level logging. Cluster level logging deploys a node level logging agent to each node which then funnels data to a separate backend for storage and analysis of logs. The primary benefit of this solution is that if a pod dies, the logs detailing what happened are retained. Implementing node level logging, without funneling data to a logging backend, will not retain log data if pods die or are evicted, while cluster level logging ensures that data is captured and retailed. A common tool for implementing cluster level logging is Fluentd—or Fluentbit, a lightweight version of Fluentd—which acts as the node level logging agent funneling data to a logging backend.

    Events provide insight into decisions being made by the cluster and unexpected events that occur in Kubernetes. Events are stored by the API server on the master node and collected using the same method as log collection—via a node level logging agent like Fluentd.

    Establishing a Continuous Intelligence Dashboard

    Finally, collectors for logs, metrics, events and security can be easily deployed using Helm—an open source Kubernetes package manager. Helm can significantly simplify the setup process, reducing hundreds of lines of configuration to one. These collection plugins can be used on any Kubernetes cluster, whether one from a managed service such Amazon Elastic Kubernetes Service (EKS) or a cluster you are running entirely on your own.

    According to Sumo Logic’s recent Continuous Intelligence Report, enterprise adoption and deployments of multi-cloud grew 50% year-over-year, and 80% of users across multi-cloud environments are now utilizing Kubernetes architectures. As Kubernetes continues to become mainstream, it’s essential that businesses understand how these workloads operate and how to best extract valuable insights to inform business decisions.

    — Katie Lane

  • Continuous Optimization: An Idea Whose Time Has Come?

    Continuous Optimization: An Idea Whose Time Has Come?

    Agile makes development deliver code faster. CI makes testing move faster and CD makes delivery faster, but what keeps track of the volume of change all of this introduces and delivers optimizations faster?

    That is the question Opsani wants you to be asking. And it’s a valid question. Optimization in a complex and constantly changing software world becomes more important–if it can keep up. Opsani thinks it can, with a little AIOps to help anyway.

    The premise is simple. There are ways to adjust the environment that might increase performance and/or reduce costs. Those ways are individually relatively simple (such as JVM settings or cloud instance sizing), but combined they make a complex web that impacts performance as a whole, with individual bits sometimes helping and sometimes hurting.

    Up JVM memory on a large instance and it might help. Switch to a smaller instance later, and that JVM change may cause problems on the smaller footprint, for example. So something more dynamic is needed. As code changes, best optimization options might change also. As the other parts of the environment change, that magnifies the concern that applications are not running at their best and might be costing too much money.

    Opsani’s answer to this problem is continuous optimization. Using AIOps to check different combinations of settings at a rate that operations staff couldn’t manage even if they did have the time. And they generally don’t.

    From my (not their) perspective, there are two pieces to this puzzle. First is gathering inputs and determining performance, second is tweaking settings. Then repeat. Seems simple but the environment continuous optimization would work in is increasingly complex. Any look at how many places optimization can occur in a given environment–from VM/Instance to code to network to management platform to storage/database choices–there is a lot going on, and all of these settings can impact each other.

    Hence the idea of continuous optimization appeals to me. They’ve got the interfaces that one would expect to gather inputs, names such as Jenkins, DataDog and New Relic. They’ve got the interfaces to enact and test out changes too, with interfaces to products such as Kubernetes, Terraform, Rancher and Wavefront. So it certainly appears they’ve got the basics covered. Of course there are vendor interfaces I’d like to see that aren’t in the list of integrations, and no doubt the same is true for you. But the core is here, getting to the monitoring and management tools most companies use regularly.

    Opsani seems to be aware of the different comfort levels of various organizations, also. Able to run in dev or test as well as production. Since every organization has a different taste for putting new ideas into production, this is a good idea, though personally I would aim for eventual production rollout, just because that is where the rubber meets the road. Having it running as part of normal operations means even that small change that reduces responsiveness of your application by 25% (we’ve all seen it) will be detected, and Opsani can try changing some of the environment to compensate.

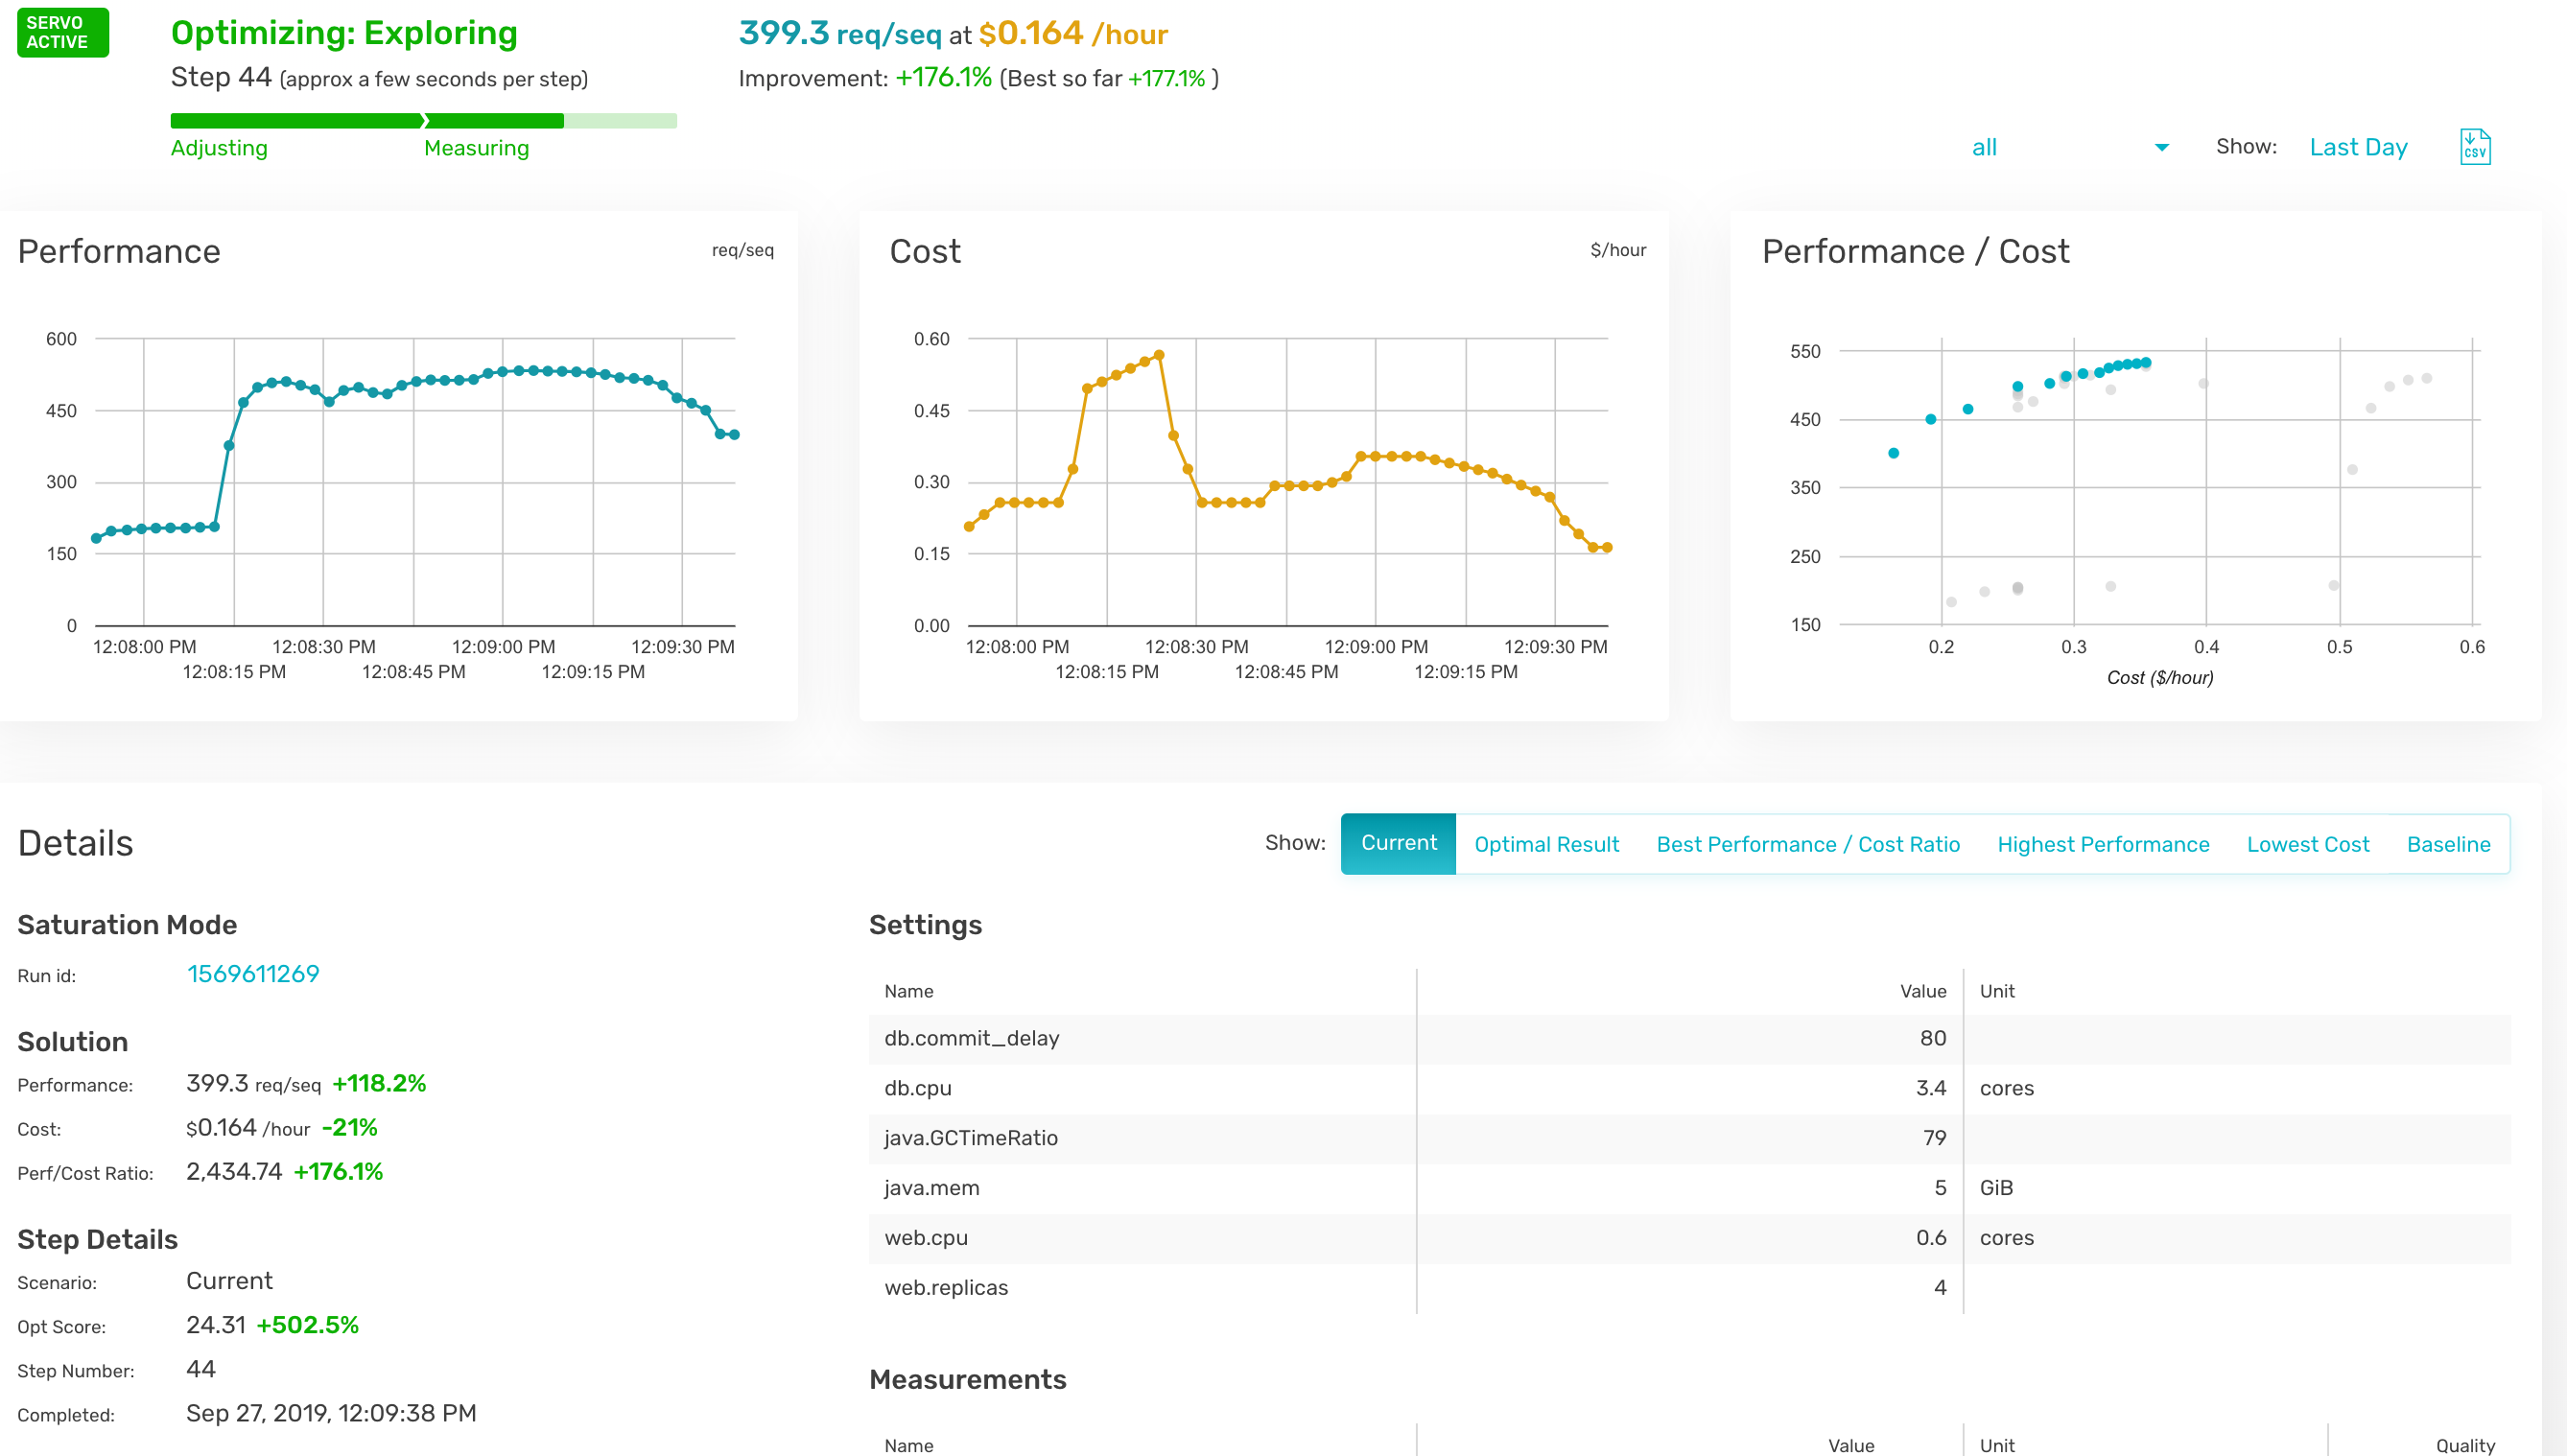
    When I spoke with them, we did not discuss cost, but we did discuss savings. For budget-sensitive environments, it is worth looking into the cost in your organization versus the potential savings in actual monthly dollars. Here is a screenshot showing the cost measure combined with the performance measure. Reducing monthly overhead to pay for a tool that also improves performance might just be a no-brainer–if it suits your environment.

    I can’t say if it suits your environment, nor can any other analyst/pundit. That’s for your organization to decide. But the idea of continuous optimization is a good one. Opsani is not alone in working on this problem, so even if this particular tool doesn’t suit your needs, you can look for others that do. I recommend getting the demo and seeing what they’ve got, and how it might help in your environment.

    — Don Macvittie

  • Dell Boomi Dives Into DevOps

    Dell Boomi Dives Into DevOps

    Boomi, a Dell Technologies business, today announced it has extended its integration platform-as-a-service (iPaaS) platform to include application programming interface (API) lifecycle management capabilities.

    Announced at the Boomi World 2019 conference, the API lifecycle management tools are an extension of a larger initiative to bring apply best DevOps practices to the building of APIs deployed using the Atom runtime that Boomi relies on to integrate applications and processes.

    The three additions being made to the Boomi platform include an API Proxy, a centralized mechanism managing Boomi and third-party APIs; API Gateway, a mechanism for applying governance to APIs; and a self-service API Developer Portal.

    In addition, Boomi announced integrations with Pravega, an open source data streaming software project led by Dell EMC, and the publish and subscribe software made available by Solace. Those partnerships extend an Event Driven Architecture that Boomi has defined around its iPaaS environment that includes existing support for Amazon SQS, Microsoft’s Azure Service Bus services and Pivotal RabbitMQ software.

    Steve Wood, chief product officer for Boomi, said by partnering with CloudBees to integrate the open source Jenkins continuous integration and continuous deployment (CI/CD) platform and joining the Continuous Delivery Foundation, Boomi is making a concerted effort to meld DevOps and API management to simplify deployment of the Atom runtimes on which the Boomi iPaaS platform depends to integrate applications and services.

    In general, Boomi sees a need to embrace DevOps to help customers drive digital business initiatives. To become more agile, Wood said organizations need to be able to deploy Atom runtimes faster.

    At the conference, CloudBees CTO Kohsuke Kawaguchi, the founder of Jenkins, told attendees that as they embrace DevOps they should be wary of creating CI islands within their organization. A more holistic approach to DevOps will enable organizations to harness a “gold mine” of metadata using analytics tools that will enable organizations to make more objective decisions about how best to accelerate application development and deployment.

    The sharing of best DevOps practices will also be core to Boomiverse, an end user community that Boomi launched this week as part of an effort to increase the number of IT professionals that have Boomi certifications. In the last two years, Boomi has increased the number of certifications being attained from about five a day to now more than 40 as it makes a concerted effort to increase the amount of iPaaS integration expertise available to customers.

    It’s not clear to what degree CI/CD platforms and API management ultimately will meld. It’s hard to imagine any organization trying to build and deploy cloud-native applications without having access to both platforms. In fact, most organizations now build, deploy and manage APIs as if they were a standalone application. As such, best DevOps practices are going to be required to manage APIs at scale. The challenge IT organizations now face is finding a way to teach the developers and IT operations teams responsible for building and deploying those APIs how best to work together collaboratively.

    — Mike Vizard

  • Kong Employs Machine Learning to Extend Services Control

    Kong Employs Machine Learning to Extend Services Control

    At the Kong Summit 2019 conference, Kong today announced it has acquired Insomnia, an open source testing tool for application programming interfaces (APIs). In addition, it has added support for REST, Kafka Streams, gRPC, GraphQL and plugins written in Go to its service control platform.

    Kong also added more capabilities based on machine learning algorithms in the form of a visual service map a Kong Immunity module that detects anomalies across services spanning multiple platforms.

    Additionally, the company is delivering Kong Studio, a suite of tools to design, build and maintain APIs for REST and GraphQL endpoints based on the API testing and debugging tool Insomnia, which then can be published to Kong Gateway, proxy software for deploying and managing distributed APIs. The 2.0 release of Kong Gateway separates the data and control plane for the platform and provides the ability to write plugins in Go via Kong’s Plugin Development Kit.

    Kong CTO Marco Palladino said collectively, this approach makes it easier to address a raft of potential API issues at design time rather than after an API has been pushed into a production environment.

    Finally, Kong also updated Kuma, an open source control plane for a service mesh based on Envoy proxy software developed under the auspices of the Cloud Native Computing Foundation (CNCF).

    Kong has been making the case for a service control plane dubbed Kong Brain, which spans both cloud-native and legacy monolithic environments and makes extensive use of machine learning algorithms. Palladino said as more services proliferate across existing monolithic and cloud-native application environments, there is no way IT organizations will be able to keep pace without relying more on machine learning algorithms to manage events and processes occurring within milliseconds of one another across the much more complex IT environment.

    In fact, Palladino noted that rather than expecting one environment to supplant the other, IT organizations should expect to see services proliferate across both monolithic and cloud-native application environments. Managing all those different classes of services will require a service control platform capable of spanning multiple environments, he said.

    Over time, machine learning algorithms will enable service control platforms to become smarter as IT environments transition to managing services end to end versus continuing to focus on individual applications. Naturally, there’s a high correlation between organizations that have made that transition and those that have embraced DevOps to build, deploy and manage those services, said Palladino, noting the most successful organizations employ DevOps to deploy and update APIs as if they were a standalone application rather than a set of add-on capabilities that tend to be forgotten over time.

    It remains to be seen how the confluence of APIs and DevOps ultimately will change how IT is managed. The only thing that is for certain is the days when applications were managed in isolation are finally coming to a much-needed close.

    — Mike Vizard